HAL Id: hal-02398635
https://hal.archives-ouvertes.fr/hal-02398635
Submitted on 7 Dec 2019
HAL is a multi-disciplinary open access
archive for the deposit and dissemination of
sci-entific research documents, whether they are
pub-lished or not. The documents may come from
teaching and research institutions in France or
abroad, or from public or private research centers.
L’archive ouverte pluridisciplinaire HAL, est
destinée au dépôt et à la diffusion de documents
scientifiques de niveau recherche, publiés ou non,
émanant des établissements d’enseignement et de
recherche français ou étrangers, des laboratoires
publics ou privés.
Analysis of fluid-fluid porometry from pore network
simulations
O Maalal, Marc Prat, Didier Lasseux, R Peinador
To cite this version:
O Maalal, Marc Prat, Didier Lasseux, R Peinador. Analysis of fluid-fluid porometry from pore
net-work simulations. 14èmes Journées d’Etude sur les Milieux Poreux, Oct 2018, Nantes, France.
�hal-02398635�
Analysis of fluid-fluid porometry from pore network
simulations
O. Maalala,c, M. Prata, D. Lasseuxb, R. Peinadorc
aInstitut de M´ecanique des Fluides de Toulouse, IMFT, Universit´e de Toulouse, CNRS - Toulouse, France
bInstitut de M´ecanique, 351, Cours de la Lib´eration. Universit´e de Bordeaux - TALENCE Cedex, France, 33405
cInstitut de la Filtration et des Techniques S´eparatives, Rue Marcel Pagnol - Foulayronnes, France, 47510
Keywords: Thin porous media, Pore Size Distribution, Porometry, Pore Network Simulation
1. Introduction
Characterization of the pore-size distribution(PSD) of a porous material has been widely investigated among the scientific community. Direct methods based on imaging techniques such as microtomography and indirect methods based on the analysis of some macroscopic results such as fluid-fluid porometry are used to determine the PSD of a porous medium. Interpretation of the results from fluid-fluid porometry is generally based on a representation of the porous medium as a bundle of parallel tubes. It is clear that this model is quite a crude approximation of the real microstructure of many porous media. In this context, the objective is twofold: i) assess the validity of the results obtained from the parallel tube model, ii) develop a better model to determine the PSD. The work is based on pore network simulations of the immiscible displacement process occurring in the fluid-fluid porometers, i.e. on in silico fluid-fluid porometry.
2. Methods and results 2.1. Methods
In the fluid fluid porometry [1], a wetting fluid initially saturating the thin porous medium of interest is displaced by injection of a non-wetting fluid through a series of pressure steps at the inlet while the pressure is kept constant at the outlet. In addition to the pressures, the volumetric flow-rate at the outlet is measured for each step after stabilization of the inlet pressure. Then a PSD is obtained from the parallel tubes model by combining the Laplace and Poiseuille equations [1],[2]. The Young-Laplace equation allows determining the critical tube radius corresponding to each pressure step (only the tubes greater than the critical radius are invaded), whereas the Poiseuille equation allows computing the volumetric flow-rate as a function of the pressure difference in the tubes whose size is greater than the critical radius. The idea is then to test this method from pore network simulations.
Pore network models typically represent the porous medium as a network of nodes referred to as pores [3] interconnected by throats. As examples, we consider structured square and cubic networks in 2D and 3D , pores and throats being modeled by spheres and cylinders, respectively. Pore radii are assumed to be larger than those of throats both being randomly taken from a given distribution. Thus, one can actu-ally make a distinction between the PSD (pore size distribution) and the TSD (throat size distribution). The simulation method of the displacement is inspired from the classical invasion-percolation algorithm [4]. It combines the tracking of the fluid-fluid interfaces and the invasion of the throats whose thresh-old capillary pressures, as given by the Young-Laplace equation, are lower than the existing pressure difference between the two fluids. In the case of the considered displacement (drainage), the invasion is controlled by the throats [5] since the throats are smaller than the pores. The assumption underlying this method is that viscous forces are insignificant in comparison to capillary forces, at least regarding forces controlling the fluid-fluid distribution. The equilibrium distribution of the two fluids within the pore network is determined after each increase of the inlet pressure. When the non-wetting fluid reaches the outlet, the invading fluid volumetric flow-rate is computed from the mass conservation applied to each invaded pore, together with the use of Poiseuille’s equation in each invaded throat. This leads to a linear system for the pressure in each pore of each invaded cluster. Once solved, the invading fluid volumetric flow-rate at the outlet can be determined.
2.2. Results
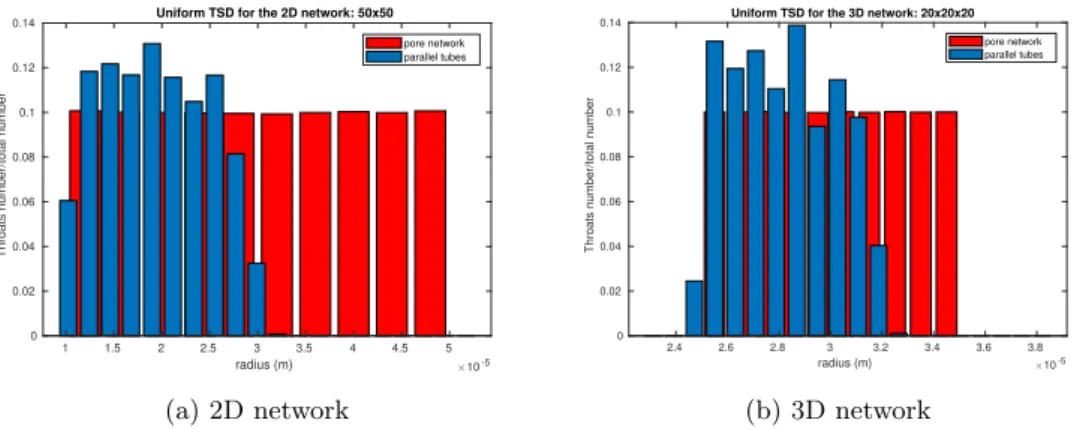
To avoid fluctuations associated with a single realization, the computed volumetric flow-rate and pressures are averaged over several realizations of the network. A test was performed to determine the minimum number of pressure steps required to get results independent from the pressure step. The comparison between the TSD of the network and the one obtained by application of the parallel tubes model as in classical fluid-fluid porometry is shown on the following histograms for both 2D square and 3D cubic networks. The 2D and 3D networks are composed of 50x50 pores and 20x20x20 pores respectively. Uniform and normal distributions were considered.
Uniform TSD for the 2D network: 50x50
1 1.5 2 2.5 3 3.5 4 4.5 5 radius (m) 10-5 0 0.02 0.04 0.06 0.08 0.1 0.12 0.14
Throats number/total number
pore network parallel tubes
(a) 2D network
Uniform TSD for the 3D network: 20x20x20
2.4 2.6 2.8 3 3.2 3.4 3.6 3.8 radius (m) 10-5 0 0.02 0.04 0.06 0.08 0.1 0.12 0.14
Throats number/total number
pore network parallel tubes
(b) 3D network
Figure 1: Comparison between the network uniform TSD and the one ”predicted” by the parallel tubes model. Somewhat similar results (not shown) are obtained for Gaussian distributions
The shape of the TSD obtained from the parallel tubes model is nearly the same as the one imposed in the simulations for either the uniform or the normal distributions and for both 2D and 3D networks. However, the TSD given by the parallel tubes model is not spread over the whole distribution. In addition, the TSD obtained for the 3D network is seen to be more spread over the distribution domain for the uniform and normal distributions in comparison to the 2D network. It can be shown that the reduced spreading of the TSD is directly related to the percolation threshold of the network [6]. The latter can be related to the minimum inlet pressure necessary for the non-wetting fluid to reach the outlet. Below this minimum pressure the volumetric flow-rate is zero and thus the throat size range corresponding to the pressures lower than this minimum breakthrough pressure cannot be obtained from the parallel tubes model.
2.3. Conclusions
Not surprisingly, the results summarized above indicate that the parallel tubes model is a too crude approximation to accurately determine the PSD (or more precisely the TSD) of thin porous media inter-connected microstructures. TSD identification techniques using genetic algorithms combined with pore network simulations are currently under investigation so as to better exploit the results from fluid-fluid porometry.
Acknowledgements
This research was supported by the Project ”PEMFC - SUDOE” - SOE1/P1/E0293 which is co-financed by the European Regional Development Fund in the framework of the Interreg Sudoe programme. References
[1] R. I. Peinador, J. I. Calvo, Characterisation of polymeric UF membranes by liquid-liquid displacement porosimetry, J. Membr. Sci. (2010), vol. 348, 238-244.
[2] K.R. Morison, A comparison of liquid-liquid porosimetry equations for evaluation of pore size distribution, J. Membr. Sci. (2008), vol. 325, 301-310.
[3] V. Joekar-Niasar, S. M. Hassanizadeh, Analysis of Fundamentals of Two-Phase Flow in Porous Media Using Dynamic Pore-Network Models: A Review, J. Crit. Rev. Environ. Sci. Technol. (2012), vol. 42, 1895-1976.
[4] D. Wilkinson, Invasion percolation: a new form of percolation theory, J. Phys. A: Math. Gen. (1983), vol. 16, 3365-3376. [5] R. Chandler, Capillary displacement and percolation in porous media, J. Fluid Mech. (1982), vol. 119, 248-267. [6] D. Stauffer, A. Aharony, Introduction to percolation theory, Taylor & Francis, London, 1992.