HAL Id: tel-02443529
https://pastel.archives-ouvertes.fr/tel-02443529
Submitted on 17 Jan 2020HAL is a multi-disciplinary open access archive for the deposit and dissemination of sci-entific research documents, whether they are pub-lished or not. The documents may come from teaching and research institutions in France or abroad, or from public or private research centers.
L’archive ouverte pluridisciplinaire HAL, est destinée au dépôt et à la diffusion de documents scientifiques de niveau recherche, publiés ou non, émanant des établissements d’enseignement et de recherche français ou étrangers, des laboratoires publics ou privés.
François Collin
To cite this version:
François Collin. The tolerance of wheat (Triticum aestivum L.) to Septoria tritici blotch. Agronomy. Institut agronomique, vétérinaire et forestier de France; University of Nottingham, 2017. English. �NNT : 2017IAVF0028�. �tel-02443529�
T
HESE DE
D
OCTORAT
préparée à
l’Institut des sciences et industries du vivant et de l’environnement (AgroParisTech)
pour obtenir le grade deDocteur de l’Institut agronomique, vétérinaire et forestier de France
Spécialité : sciences agronomiques
École doctorale n°581
Agriculture, alimentation, biologie, environnement et santé (ABIES)
par
François COLLIN
The tolerance of wheat (Triticum aestivum L.)
to Septoria tritici blotch
La tolérance du blé (Triticum aestivum L.) à la septoriose
Directeurs de thèse : Marie-Odile BANCAL, John FOULKES Co-encadrement de la thèse : Pierre BANCAL
Thèse présentée et soutenue à Sutton Bonington (Royaume Uni), le 12 décembre 2017 : Composition du jury :
Dr. Ian BINGHAM, Reader in Crop Physiology, Scotlands Rural College Président, Examinateur Dr. Matthew DICKINSON, Professor of Plant Pathology, University of Nottingham Rapporteur
UMR ÉcoSys (INRA/AgroParisTech) University of Nottingham, Plant and Crop Sciences
Route de la ferme Sutton Bonington Campus
78850 Thiverval-Grignon LeicestershireLE12 5RD
to Septori tritici blotch
La tolérance du blé (Triticum aestivum L.)
à la septoriose
A thesis submitted to:
the University of Nottingham, School of Bioscience (Sutton Bonington, United Kingdom)
and
l’École doctorale Agriculture, Alimentation, Biologie, Environnement et Santé — ABIES, AgroParisTech (Paris, France).
Prepared by François Collin for the dual-award of the degree of Doctor of Philosophy
and
the grade of Docteur de l’Institut agronomique, vétérinaire et forestier de France.
This work would not have been possible without the participation of Arvalis, the University of Nottingham and the UMR ECOSYS (AgroParisTech, INRA). I am proud to have been part of these organisations which carry project, support research and provide an environment for scientific achievement.
Firstly, I am grateful to Marie-Odile and Pierre Bancal and John Foulkes who super-vised the PhD project. They provided effective guidance and support. They have also taught me complementary methods and approaches which, I hope, spread through this study. Besides, they encouraged my participation in conferences which were good oppor-tunities to communicate about my work and to confront with the scientific community. If I obviously have a profound respect for them as scientists, I also appreciate their sympathy, kindness and encouragement which are an inspiration for me. Thank you very much.
My participation in this project would not have been possible if I had not met Jean-Charles Deswarte and David Gouache. They showed a large enthusiasm for my partic-ipation in this project and helped for a smooth and effective transition from my former position to this study. They regularly contributed to the project, bringing ideas and com-plementary standpoint on the project. Beyond the scientific input they provided, they also helped me to take confidence in my work and emphasised the professional relevancy of it.
In addition, many people fed the scientific discussion and helped us during the French steering committees, the ADAS meetings of the tolerance project restitution and other meetings. I am therefore grateful to Neil Paveley, Julie Smith, Femke van den Berg, David Causeur, Frank van den Bosch, Pierre Casadebaig, Bénédicte Quilot-Turion, Mickaël Chelle for their respective contributions.
Moreover, I want to thank Larissa Ondo, Julie Rodrigues, Maxime Marques, Fabrice Duhamel for their implication in the glasshouse experiment. I am thankful for the assis-tance and the good company of Dennis Churchill and James Durnford during my stay for the field experiment in Hereford. I thank Jayalath De Silva who organised effective technical assistance and training in Sutton Bonington as well as Dongfang Li who has been very kind and helpful for the chemical analysis.
They have been supportive, helping colleagues, supporting friends, housemates, tourists (!), I am keen to thank: Marion, Gita, Helena, Maike, Verena, Alfonso, Becca, Kate, Ajit, Shadia, Kamal, Letizia, Iride and Anna.
The Septoria tritici blotch disease (STB, pathogen Zymoseptoria tritici) is the most damaging foliar infection of wheat crops in Europe. Disease management strategies in-clude cultivar resistance, disease escape strategy and fungicides. However, these strate-gies have failed to provide a complete protection of wheat crops. The STB tolerance is a complementary approach which aims to maintain yield in the presence of the symptoms. The tolerance of STB relies on plant physiology and source/sink balance: the sink demand (the grain growth) must be satisfied in spite of reduced source availability (pho-tosynthetic capacity as affected by the STB symptoms on the leaves). The green canopy area, the senescence timing and the grain yield components are interesting potential sources of tolerance that were studied in this project.
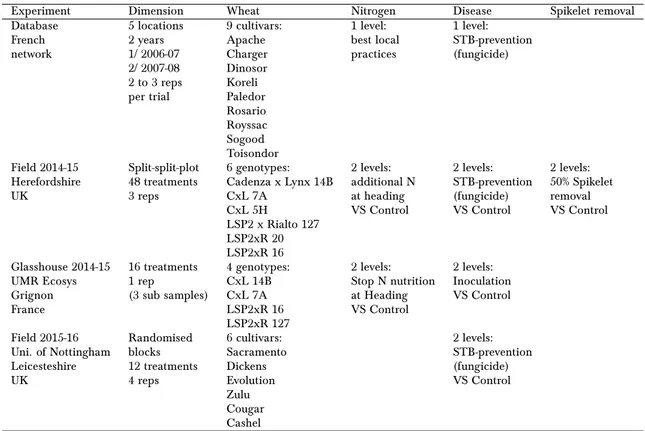
A data-mining study, one glasshouse experiment and two field experiments were car-ried out providing complementary insights on STB tolerance mechanisms. The genotype ×environment interaction effects on tolerance traits were investigated for two seasons × five locations × nine cultivars datasets. The nitrogen nutrition and metabolism of four doubled-haploid (DH) lines contrasting for STB tolerance were examined in a controlled-glasshouse experiment at UMR ECOSYS (INRA,AgroParisTech) Grignon, France. The source/sink balance of six DH lines contrasting for STB tolerance was also examined ac-cording to their responses to a spikelet removal treatment, applied in a field experiment in Hereford, UK. Finally, a field experiment with two fungicide regimes (full disease con-trol and non-target (STB) disease concon-trol) probed the STB tolerance of six modern UK winter wheat cultivars in Leicestershire, UK. The main objective was to verify identified potential STB tolerance traits in commercial cultivars.
Putative STB tolerance traits have been identified such as the early heading date, the low degree of grain-source limitation of healthy crops during the grain filling phase, the vertical canopy distribution favouring a relatively larger flag-leaf. Results showed these traits might be selectable in wheat breeding without a trade-off with the potential yield. Finally, the project also discussed the need for alternative STB tolerance quantification methods, as well as the importance of environmental variations which have to be taken into account to study genetic variation in tolerance, but which could also be used to discriminate tolerant environment.
1 Introduction and Literature Review 1
1.1 Introduction . . . 1
1.2 Literature Review . . . 2
1.2.1 Potential yield . . . 3
1.2.1.1 Overview of the wheat physiology: growth and development 4 The wheat development until anthesis . . . 4
The grain filling phase . . . 6
The source/sink manipulations and grain yield limitation . 6 1.2.1.2 Fate of Nitrogen and Carbon fluxes during the senescence 7 The end of nitrogen uptake . . . 8
Senescence and N remobilisation . . . 10
Senescence and reduction of carbon assimilation . . . 13
1.2.1.3 An equation for potential yield . . . 15
1.2.2 Stress, strain and tolerance of Septoria tritici blotch . . . 17
1.2.2.1 The Septoria tritici blotch: a biotic stress of wheat crops 18 Life cycle of Zymoseptori tritici . . . 19
Plant × pathogen interactions . . . 20
1.2.2.2 Methods for crop control of STB . . . 21
Breeding for resistance . . . 21
Avoidance and sanitary measures . . . 22
Fungicide-based control . . . 23
1.2.2.3 Quantify the tolerance of Septoria tritici blotch . . . 25
1.2.3 Identification of STB tolerance traits . . . 25
1.3 Rationale, objectives and hypotheses . . . 29
References . . . 30
2 Materials and methods 43 2.1 Introduction . . . 43
Introduction . . . 43
2.2 Overview of the study methods . . . 44
2.2.1 Data mining . . . 44
2.2.2 Field experiment 2014-15 . . . 45
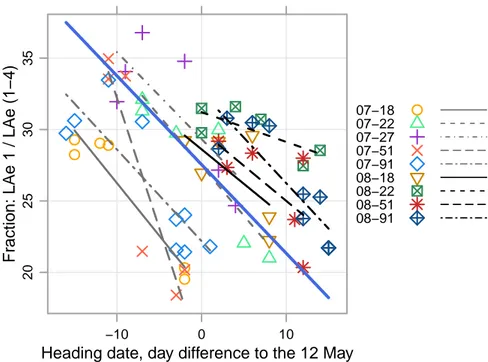
2.2.3 Glasshouse experiment 2014-15 . . . 45
2.2.4 Field experiment 2015-16 . . . 46
2.3 Selection of genotypes or cultivars . . . 46
2.4 Growth analysis . . . 47
2.5 The Healthy Area Duration (HAD) . . . 48
2.5.1 Leaf lamina area and green leaf lamina area . . . 49
3 Genotype and environment effect on senescence and grain weight 53
3.1 Introduction . . . 53
3.2 Materials and methods . . . 57
3.2.1 Dataset, response and explanatory variables . . . 57
3.2.1.1 E, G and G×E . . . 57
3.2.1.2 The response variables: the senescence timing and the Thousand Grain Weight (TGW) . . . 59
3.2.1.3 Explanatory variables . . . 60
3.2.2 Statistical analysis . . . 61
3.2.2.1 Classification of explanatory variables by Random Forest models . . . 61
3.2.2.2 Linear model selection . . . 63
3.2.2.3 Random effects: E, G and G×E . . . 65
3.2.3 External validation. . . 65
3.2.4 Softwares . . . 65
3.3 Results . . . 66
3.3.1 Identifying the main explanatory variables using Random Forest modeling . . . 66
3.3.1.1 Fitting the Random Forest models . . . 66
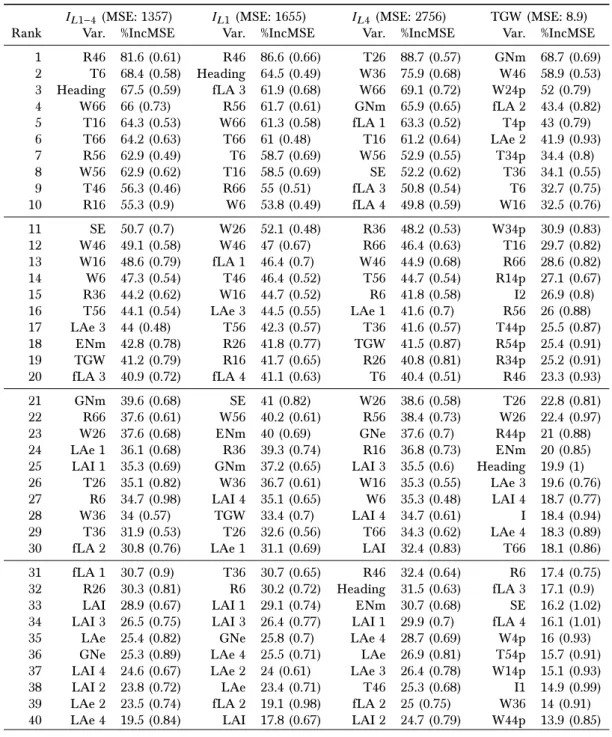
3.3.1.2 Ranking of explanatory variables according to their con-tribution . . . 68
3.3.2 Multiple regression models . . . 70
3.3.3 Identifying the origin of G, E or G×E . . . 74
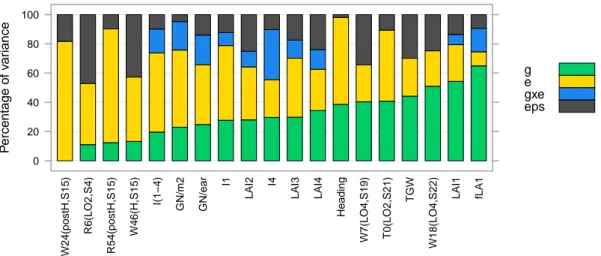
3.3.3.1 Variance component analysis . . . 74
3.3.3.2 Partial regressions . . . 77
3.3.4 External validation . . . 87
3.3.4.1 Validation of the Random Forest models . . . 87
3.3.4.2 Validation of the linear models . . . 88
3.4 Discussion . . . 90
3.4.1 Method . . . 92
3.4.2 Senescence timings . . . 93
3.4.3 The TGW . . . 97
3.4.4 Hypotheses to improve tolerance of STB . . . 97
References . . . 99
4 Field experiment at Hereford, 2014-15 104 Abstract . . . 104
4.1 Introduction . . . 105
4.2 Materials and methods . . . 107
4.2.1 Genotypes screened for tolerance . . . 107
4.2.2 Experimental design and treatments . . . 108
4.2.3 Crop measurements . . . 109
4.2.4 Data analysis . . . 110
4.3 Results . . . 111
4.3.1 The tolerance grade of the genotypes . . . 111
4.4 Discussion . . . 119
4.4.1 Tolerance and yield . . . 119
4.4.2 TGW was co-limited by source and sink . . . 120
4.4.3 Low source limitation is a genotype tolerance trait . . . 120
4.4.4 The grain source? . . . 121
4.4.5 Tolerance estimation in healthy crops . . . 122
4.5 Conclusion . . . 123
4.6 Acknowledgements . . . 123
References . . . 123
5 Glasshouse experiment at Grignon, 2014-15 127 5.1 Introduction . . . 127
5.2 Materials and methods . . . 128
5.2.1 Experimental design . . . 128
5.2.1.1 Genotype materials . . . 128
5.2.1.2 Obtaining a field-like crop in the glasshouse . . . 128
5.2.1.3 Experimental treatments . . . 129
5.2.1.4 Growth analysis . . . 131
5.2.2 Data analysis . . . 133
5.2.2.1 Population settings . . . 133
5.2.2.2 The grain yield . . . 134
5.2.2.3 The Healthy Area Duration (HAD) . . . 134
5.2.2.4 Dry matter weight and Nitrogen amounts . . . 135
5.2.2.5 Tolerance estimation . . . 135
5.2.3 Statistics . . . 136
5.3 Results . . . 137
5.3.1 From source:sink characterisation to tolerance . . . 137
5.3.1.1 Development rate . . . 137
5.3.1.2 The source traits for grain filling . . . 137
5.3.1.3 The grain sink traits . . . 142
5.3.1.4 Relation between the grain yield and HAD . . . 146
5.3.2 Analysis of dry-matter and nitrogen balance behaviour of cultivars 150 5.3.2.1 Dry-matter fluxes . . . 150
5.3.2.2 Nitrogen fluxes . . . 154
5.4 Discussion . . . 158
5.4.1 Obtaining a field-like canopy in the glasshouse. . . 158
5.4.2 Traits associated with the putative tolerance of the genotypes. . . 159
5.4.3 GNe tolerance of the genotypes . . . 161
5.4.4 Nitrogen and tolerance of the genotypes . . . 162
5.5 Conclusion . . . 163
References . . . 164
5.A Appendix . . . 165
6.2.1 Experimental design and treatment . . . 168
6.2.2 Measurements . . . 169
6.2.3 Data analysis . . . 171
6.2.3.1 Senescence kinetics and healthy area duration . . . 171
6.2.3.2 Tolerance/intolerance . . . 172
6.2.3.3 Statistics . . . 173
6.3 Results . . . 174
6.3.1 Development rate . . . 174
6.3.2 The sources for grain filling . . . 175
6.3.2.1 Leaf area characterisation . . . 175
6.3.2.2 The senescence parameters . . . 175
6.3.2.3 The healthy area duration . . . 179
6.3.2.4 Alternative sources: the dry matter remobilisation . . . 179
6.3.3 The grain sink . . . 180
6.3.3.1 Yield and yield losses . . . 180
6.3.3.2 Yield and grain number . . . 181
6.3.3.3 Grain weight . . . 183
6.3.4 Source-sink relationship, HAD and yield . . . 185
6.3.5 Tolerance . . . 187
6.3.5.1 Cultivar tolerance estimation . . . 187
6.3.5.2 Tolerance and healthy crop traits . . . 190
6.4 Discussion . . . 194
6.4.1 Range of potential tolerance traits . . . 194
6.4.2 Insights on the estimation of tolerance . . . 196
6.4.3 Main results on tolerance and tolerance traits . . . 198
6.5 Conclusion . . . 200
References . . . 200
6.A Appendix . . . 202
6.A.1 Healthy trait correlation with tolerance estimates . . . 202
7 Discussion 205 7.1 Highlights of the results . . . 205
7.2 The range of source/sink balance generated . . . 206
7.3 The quantification of tolerance and the scale . . . 208
7.3.1 Limits of the single slope-based estimation of tolerance . . . 208
7.3.2 Improve the tolerance estimation . . . 209
7.3.3 The grain scale relevance . . . 211
7.4 The STB-tolerance traits . . . 212
7.4.1 Comparison of the experimental results . . . 212
7.4.2 Tolerance traits . . . 214
7.4.3 Grain-source availability . . . 218
7.4.4 Interaction between tolerance traits . . . 218
7.5 Environment effect . . . 219
7.6 Tolerance and trade-off . . . 220
7.7 Perspectives . . . 221
8.2.1 Présentation générale du matériel et des méthodes . . . 228
8.2.2 Datamining : effets du génotype et de l’environnement sur la sé-nescence et le poids des grains . . . 231
8.2.3 Champ 2014-15 (C2015) . . . 233 8.2.4 Serre 2014-15 (S2015) . . . 234 8.2.5 Champ 2014-16 (C2016) . . . 235 8.3 Discussion . . . 236 8.4 Conclusion . . . 239 Références . . . 239
Glossary and list of acronyms 246
1.1 Main nitrogen metabolic pathways . . . 9
1.2 Theoretical green blade area kinetic . . . 15
1.3 Theoretical source/sink potential curve . . . 17
1.4 The Septoria tritici blotch symptoms . . . 18
2.1 Post-anthesis green area kinetics: the Gomptertz’s function . . . 50
3.1 Localisation of the expriments . . . 58
3.2 The Gompertz’s function . . . 59
3.3 Relationship between observations and random forest predictions of the senescence timing of at the canopy level . . . 67
3.4 Relationship between observations and random forest predictions of the TGW . . . 68
3.5 Relationship between the fraction of flag leaf and heading date . . . 73
3.6 Variance component analysis . . . 75
3.7 Synthesis of the response variance explain/unexplained by the models . . 76
3.8 TGW: Synthesis of the variances explain/unexplained by the models . . . 76
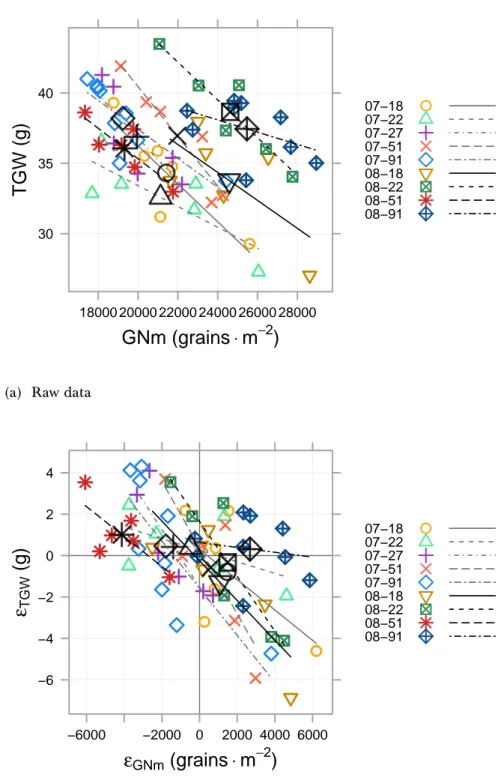
3.9 Relationships between TGW and grain number per m2: raw data and resid-uals of partial regressions . . . 79
3.10 Relationships between I1 and heading date: raw data and residuals of partial regressions . . . 81
3.11 Relation between heading date and I . . . 87
3.12 External validation: observations, predictions and estimations of I . . . . 88
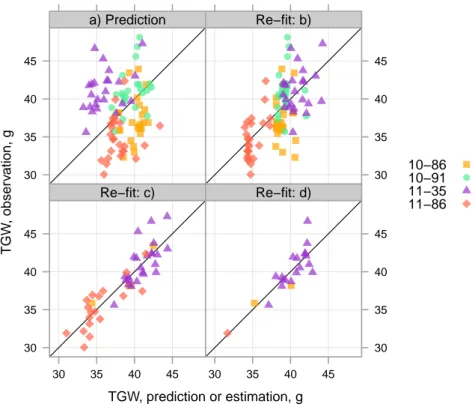
3.13 External validation: observations, predictions and estimations of TGW . 89 4.1 Disease severity . . . 113
4.2 TGW at maturity . . . 115
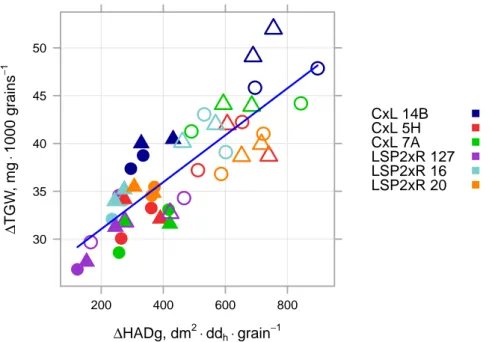
4.3 Relationship between relative increase in grain dry weight and relative increase in assimilate availability from the time of spikelet removal . . . . 117
4.4 TGW versus HADg . . . 118
5.1 Intolerance estimation of the six doubled-haploid lines selected for the field trial based on three previous experiments . . . 129
5.2 Illustration of the phases of the glasshouse experiment . . . 130
5.3 Sampling schedule of greenhouse experiments applied to each genotype . 130 5.4 Daily temperature and global radiation exposition . . . 132
5.5 Kinetics of fraction of Green leaf lamina area . . . 140
5.6 Evolution of the vegetative dry-matter . . . 141
5.7 Grain filling kinetics . . . 145
5.11 Dry matter or Nitrogen balance per shoot . . . 151
5.12 Origin of grain dry-matter per ear-bearing shoot . . . 153
5.13 Nitrogen yield (N grain per shoot) in relation to the true N uptake and the remobilisation . . . 156
5.14 Nitrogen balance of vegetative organs since GS44 per organ . . . 156
5.15 Origin of grain dry-matter and nitrogen per ear-bearing shoot . . . 157
5.16 Comparison of glasshouse TGW, grain yield and HADm with the field observations . . . 160
6.1 TGW from hand-harvested versus combine grain samples . . . 171
6.2 Zadoks’s growth stage assessment . . . 174
6.3 Evolution of post-heading green leaf lamina area. . . 177
6.4 Relative senescence and disease evolution since heading stage. . . 178
6.5 Average grain yield per treatment . . . 181
6.6 Linear relationship between grain yield and grain number . . . 184
6.7 Source/sink relation at square metre, shoot and grain scale. . . 186
6.8 Grain yield per m2regarding the HADm (HAD per m2), per cultivar and per block . . . 187
6.9 Tolerance per m2or per grain . . . 189
6.10 Correlation of healthy traits with average of normalized tolerance values (Ts) and with tolerance values (Tm1, Tg1, Tm2, Tg2) . . . 191
7.1 Source/sink balance comparison between experiments . . . 207
2.1 Summary of the experiments and studies . . . 44
3.1 Relative importance of 40 most important variables for each leaf layer to explain the senescence timings or the grain weight . . . 69
3.2 Partial regression: individual E and G intercept and slopes from the rela-tionships between partial residuals of the inflexion point of canopy senes-cence and the explaining variables . . . 83
3.3 Partial regression: individual E and G intercept and slopes from the rela-tionships between partial residuals of the inflexion point of flag leaf senes-cence and the explaining variables . . . 84
3.4 Partial regression: individual E and G intercept and slopes from the rela-tionships between partial residuals of the inflexion point of leaf 4 senes-cence and the explaining variables . . . 85
3.5 Partial regressions: individual slopes corresponding to partial correlation between the grain weight and explaining variables . . . 86
4.1 Estimation of the genotype tolerance . . . 112
4.2 Analysis of variance of grain source traits . . . 114
4.3 Correlation between tolerance and grain tolerance and grain source or grain sink traits . . . 119
5.1 Analysis of variance of the grain source trait responses . . . 138
5.2 Values for grain source traits . . . 138
5.3 Analysis of variance of the grain yield component responses . . . 143
5.4 Values for grain sink traits . . . 143
5.5 Tolerance estimations . . . 148
5.6 Analysis of variance: nitrogen balance at the ear-bearing shoot scale . . . 154
5.7 Composition of the stock solution (i) . . . 165
5.8 Composition of the stock solutions (ii) . . . 165
5.9 N P K balance of the nutrient solutions . . . 166
6.1 Inputs applied in the Field 2015-16 experiment . . . 170
6.2 Analysis of variance of different grain source traits . . . 176
6.3 Grain source traits observations . . . 176
6.4 Analysis of variance of Dry Matter fluxes . . . 180
6.5 Analysis of variance of different grain sink traits . . . 182
6.6 Grain sink traits observations . . . 182
6.7 Pearson’s correlation coefficient between source and with sink traits esti-mated on the treated and untreated plots . . . 185
6.8 Tolerance estimations . . . 188
6.12 Healthy trait correlations with tolerance estimations . . . 202 7.1 Tolerance values across experiments . . . 214 7.2 Summary of the correlations between tolerance and genotype traits . . . 215
Introduction and Literature Review
1.1
Introduction
Wheat (Triticum aestivum L.) is genetically complex (hexaploid genome AABBDD). It is the result of a selection/hybridisation process, initiated in the Fertile Crescent, which in-volves the fusion of the complete genomes of three different species. It started 500,000 years ago by the hybridisation between the diploid wild wheat Triticum urtatu (genome AA) and an unidentified Aegilops sp (genome BB) resulting in the wild tetraploid wheat Triti-cum turgidum (genome AABB). The latter was domesticated 10,000 years ago, and is the ancestor, among others, of the durum wheat (T. turgidum durum). A second hybridisation happened 9,000 years ago between T. turgidum and Aegilops tauschii (genome DD) result-ing in the ancestor of the current most widely grown bread wheat: the hexaploid wheat T. aestivum L. (Shewry,2009).
The worldwide wheat crops (95% being the hexaploid wheat, Shewry 2009) rank amongst the most important for cereal production, after maize and rice: 745 million tonnes produced in 2013 FAO (2015). Wheat is largely used in food production but is also a key ingredient in animal feed. The wheat quality, mainly based on protein content, determines the end use: the best quality is used in the food industry for making breads and biscuits. The worldwide demand is increasing to support a growing population, rais-ing concerns about the ability to meet the demand in the next decades (Godfray 2014; quantified demand increase per annum, see Hall and Richards 2013). The demand in-crease is also an inin-crease of the consumption per capita (Curtis and Halford, 2014). In China, the population has doubled between 1962 and 2013, the wheat consumption has increased sixfold, explained by an increase in meat consumption (wheat feeds the ani-mals) (Curtis and Halford, 2014; FAO, 2015). The increasing production of bioethanol also increases the pressure on the wheat demand (Curtis and Halford,2014;FAO, 2015) in addition with the loss of growing land to urbanisation (FAO,2015).
pro-ducing countries (per capita) were European FAO (2015). In 2014, Europe produced 249 million tonnes. France, Germany and the United Kingdom represent more than 50% of the European Union wheat production (respectively, in million tonnes: 40.0, 27.8 and 16.6,FAOSTAT 2017). The high yield observed in these countries is supported by impor-tant inputs (fertiliser and pesticides).
Septoria tritici blotch (STB, Zymoseptoria tritici) is responsible for important grain yield loss of wheat crops in Europe (Burke and Dunne,2006;Fones and Gurr,2015). Geno-type resistances to the disease are sparse and subject to circumvention by the pathogen. Likewise, the fungicide-based strategies are marked by a sharp increase in pathogen resis-tance. In Northern France, Quinone outside Inhibitors (QoI, strobilurines, azoles) were the principal STB-inhibiting molecules. According toCheval et al.(2017), 83% of Z. tritici isolates collected from naturally infected leaves were resistant to QoI in 2005, almost 100% since 2009. QoI resistance was detected as early as 2001 in the UK (Fraaije et al.,2003). At the same time, economic, environmental and sociological contexts demand the reduced use of inputs on wheat crops in Europe. Given these pressures and genotype resistances or fungicide adaptation, tolerance (i.e. maintaining the crop yield in the presence of expressed disease (Ney et al., 2013)) is a relevant approach to protect the yield in presence of probably more frequent and severe STB symptoms.
This thesis presents the results of a PhD study targeting tolerance of STB in wheat crops. Based on ecophysiological approaches and working on wheat crops, the aim was to understand the plant mechanisms which affect STB tolerance. The final purpose was to propose strategic wheat crop traits as targets to improve tolerance of STB. This thesis manuscript is composed of a literature review. The state of the art of STB tolerance knowledge was drawn to: define the concept, explain the physiological basis, illustrate the interest of tolerance. Of course, this state of the art also identifies the knowledge gap and justifies the scientific targets which need to be investigated. Then, four chapters describe the study conducted. Finally a discussion is proposed to emphasize the important new facts, to access the limits of the present project and to show the subsequent perspectives.
1.2
Literature Review
Wheat (Triticum aestivum L.) is a monocarpic species. As such, its life cycle follows two main phases. The first period, from sowing to anthesis, achieves the vegetative growth while the second is associated with the reproductive growth. The two periods overlap a little, as rapid ear growth occurs from the beginning of booting to anthesis. Around anthesis, the size of the vegetative organs of the plants is set. The leaves, roots and the whole canopy architecture will not change significantly and the plant functions are then mainly oriented toward the grain filling. Since most of the significant damage caused by
Septoria tritici blotch (STB) is usually linked to the symptoms on upper leaf layers during the grain filling period — wheat as a monocarpic species and late stage disease — the tolerance of STB is a question which can be addressed primarily during the post-anthesis period. Therefore, the literature review focuses mainly on the post-anthesis period.
The tolerance of STB is the study of the crop performance reduction regarding a biological stress. The bibliography proposes a review of the following questions:
1. The potential grain yield is the relevant crop performance here and is explained in a first section. During the grain filling period, the nitrogen and carbon metabolism evolve along with the progressive senescence of the photosynthetic area. The geno-type and environmental variability in healthy crops is reviewed, the quantification of the crop grain yield performance is also addressed.
2. The tolerance and resistance are two distinct properties. A clear distinction is based on the definition of the stress and the strain on crops. The STB is the biological stress in question here and is therefore extensively described. The questions that tolerance of STB quantification raise are also addressed.
3. The tolerance can be improved. Studies demonstrated potential mechanisms and genotype traits which are based on reviews or experiments. The different strategies proposed are explained in this section.
4. The potential traits and mechanisms which can be involved in tolerance can be simulated. Are there models that can be used to address the question of tolerance of STB?
The literature review is concluded by the rationale of the thesis project. The scientific gaps are identified, and hypotheses on tolerance are developed here. They are addressed by four studies which were run during this PhD project.
1.2.1 Potential yield
The tolerance of wheat is a relative property, quantifying a yield loss. The potential yield is therefore explained in the current section as the reference yield, in the absence of disease. The potential yield is generally the highest wheat grain yield attainable by a crop (Fischer,2007). From a breeding standpoint, studies have investigated from a source/sink approach the causes of the yield limitation. In this ecophysiological approach, the source designates the organs for which the main function is the export of assimilate (e.g. the mature leaves export carbon or nitrogen) while the sink designates the organs for which the main function is the import of assimilate (e.g. the organs which provide storage capac-ity to support the growth). In this perspective in relation to grain growth, wheat can be described through the development of the source, the demand from the sink, respectively
the vegetative organs of the wheat shoot and the grains (Section1.2.1.1). The source/sink relation involves transfer from source to sink, mostly carbon and nitrogen. These fluxes can be described as antagonist: as the carbon is mostly associated with anabolic func-tions while the nitrogen fluxes are the results of catabolic funcfunc-tions. The senescence is the visual evidence of these antagonist relationships, its impacts on the attainable yield are therefore described (Section1.2.1.2). Taking a step back, the source/sink balance has been studied on multiple genotypes, in most of the wheat-growing regions, during many years and using variable crop management and source/sink manipulation strategies. The-oretically, the collection and accumulation of the source/sink data in conjunction with statistical methods may therefore define the population of possible source/sink balance and consequently may define the limit of the relationship. This limit defining the yield potential through site×year×genotype is also reviewed (Section1.2.1.3).
1.2.1.1 Overview of the wheat physiology: growth and development
The wheat grain sink is described by the numerical components: ear number per square metre, grain number per ear and potential grain weight. This description is con-venient but does not take into account the interactions between components and give sufficient insight in sink development stage organisation (Slafer et al., 2014). The de-termination of the different yield components is therefore explained hereafter within the physiological cycle description. The distinction was made between pre- and post-anthesis phases as the tolerance of STB is mainly associated with post-anthesis expression of STB.
• The wheat development until anthesis
The wheat developmental stages are visually characterised by four main phases. De-velopment starts with the seed germination and the deDe-velopment and growth of the first leaves as the leaf lamina are unfolded. It is followed by the development of tillers — growth stage 20 (GS20, Zadoks et al. 1974) — which are the ramifications of the main shoot. Later, the stem elongates, the upper internodes extend and grow, the ear grows and finally pushes through the flag-leaf sheath until complete emergence. All the tillers do not develop ears, some abort, which determines the final number of ears per square metre. Finally, the flowering starts and is followed by the grain filling phase. The vege-tative growth phase from a single seed results in a plant composed of several ear-bearing shoots at anthesis. The term "fertile shoot" refers to a single ear-bearing shoot from a wheat plant. The shoots of a single plant compete for the resources (e.g. solar radiation, water, nutrient) but there is no assimilate flux (although there is a N flux) from a shoot to another and they can therefore be considered as independent.
Winter wheat needs a period of cold temperatures before triggering the reproductive phase of development. In temperate climates, wheat can therefore withstand the cold
win-ter temperatures for an extended period of time as the apical meristem remains insulated below ground. Spring wheat does not require vernalisation to trigger reproductive devel-opment and can therefore be cultivated either in spring sowings in the regions where the winter is too cold (Siberia, Canada) or in autumns sowings in regions with warm winters where vernalisation is not possible (e.g. Mexico, India).
Each shoot is composed of successive phytomers (functional unit of a plant). The pe-duncle and ear sit above the phytomers. Each phytomer exposed to the light is composed of a node, an axillary bud, an internode and a leaf (sheath and lamina). The internode extends only for the upper phytomers and only the upper part of the internode is visi-ble as the lower part is wrapped inside the leaf sheath. The phytomers (and respective organs) are usually numbered downward by agronomists, the phytomer 1 being the top phytomer, below the peduncle. The ear is the reproductive organ composed of a central rachis (stem-like structure) opposing two rows of spikelets. Each spikelet is composed of two bracts (the glumes) surrounding the florets (2-4 per spikelet). Each floret is enclosed between a lower and upper bract (lemma+awn and palea). The rachis, glumes, lemma and palea form the chaff.
The ear formation starts early during the plant development. Indeed, before the stem extension, the floral transition of the apex, which has until then initiated vegetative phytomers, occurs. The apex, which is then located at approximately 1 cm above the ground surface within the stem, initiates the spikelets of the ear. The ear develops and grows during the stem extension and eventually emerges from the flag-leaf sheath. Several factors, endogenous or external, during the ear development determine the final number of fertile/aborted florets, the production of pollen, the grain set and consequently the grain number per ear. Nutrition status and assimilate availability during the ear formation alter the grain number. For instance, at the shoot scale, during stem extension, the stem growth rate is maximum and competition for carbohydrate assimilate between stem growth and ear growth could explain floret death (Kirby, 1988). At the plant scale, the ears compete for resource availability, there is a balance between ear number and grain number per ear which affects the grain number per square metre. Environmental factors may also be considered. For instance, meiosis during the boot stage (when the ear is still enclosed in the first leaf sheath) is disturbed by low radiation inducing male sterility (Fischer and Stockman, 1980; Demotes-Mainard et al., 1995, 1996) reducing the pollen production (more about the relationship between temperature and wheat development, see ???). More generally, excluding environmental "accidents", the plasticity of the grain number per square metre may be an heritable trait of wheat genotypes, acting as a "coarse tuning parameter" of the grain wheat yield as proposed by Slafer et al. (2014): high resource availability promoting high grain density per ear (e.g. because of an exceptional environment, or explained by a low inter-shoot competition because of low ear density).
Finally, at anthesis the fertilisation of the ovule occurs: the wheat florets are cleis-togamic which results in a largely predominant autogamy —Rieben et al. (2011) quan-tified 3% of the wheat seeds resulted from cross pollination in a field experiment. Given the wheat development programme, at the end of anthesis the number of ears per square metre and the number of grains per ear are already set. Besides, the vegetative biomass is then close to maximal as, later, the reproductive organ will be the main sink.
• The grain filling phase
After anthesis, the grain is the main sink of wheat shoots. During grain filling, the grain itself undergoes successive physiological processes. It first operates morphological changes, then initiates the dry matter accumulation and finally achieves dessication.
At the grain level, anthesis is followed by an intense multiplication of the endosperm cells, without substantial evolution of the grain dry weight, but a gain in water content (Shewry et al.,2012). The number of endosperm cells is directly linked to the potential of the grain for starch and protein deposition (Jenner et al.,1991). Therefore the endosperm cell division influences the potential grain size. This phase is also designated as the slow grain growth phase, during approximately 250 degree-days after anthesis. The rapid grain filling phase comes next. Most of the starch and protein is deposited during this phase. The starch represents 60-70% of the mature grain weight and is mainly provided by the current photosynthesis during that phase, but is also translocated from soluble carbohy-drate reserves which accumulate in the stem. The proteins represent 8-15% of the mature grain weight, most of the nitrogen has been taken up before anthesis and remobilised during the senescence process which occurs during grain filling. The grain dry weight increases nearly linearly with thermal time during the rapid grain filling phase, and the relative water content decreases. Below 45% grain moisture content, the dry matter is stabilised, the grain has reached physiological maturity and further water content is lost following passive dessication.
If the grain number, set before anthesis, may be described as a "coarse tuning param-eter" of the grain yield,Slafer et al.(2014) also highlighted the plasticity of the individual grain weight. They consider the grain weight plasticity is a heritable trait that can be perceived, in comparison to the grain number plasticity, as a "fine tuning parameter" of the grain yield. This is consistent with general representation of the yield being primarily dependent on the grain number, and secondarily on the individual grain weight.
• The source/sink manipulations and grain yield limitation
To study the source/sink balance is to investigate the relationship between the organs whose main function is the export (the source) with the organs whose main function is the import (the sink) of assimilate. More generally, it describes the functions which support
growth and development of the wheat shoots. After anthesis, the main sink is the grain, while the source is composed of the vegetative organs. A critical question of interest in wheat physiology is to understand what limits the grain yield. Do the vegetative organs supply enough assimilate to fill the grain? Do the grain have the capacity to store all the available assimilate? Answers to these questions indicate the direction for wheat yield potential improvement for instance in the breeding strategy.
An application of this approach led to reduced wheat growth investment in the straw and leaves to increase grain growth in the semi-dwarf genotypes, which partition more assimilate to ears, increasing the grain number per unit area and the harvest index (ratio of the grain yield dry matter to the above-ground dry matter) (Austin et al., 1980) and also reducing lodging risk. This success is referred to as the "Green Revolution" (Evenson and Gollin,2003). This major physiological change was not associated with a substantial increase of the biomass production but rather a better partitioning of the assimilate to-ward the grain (Slafer and Andrade,1991). The sharp decrease in source/sink ratio led to a more balanced situation between the potential for C assimilation by the source and sink capacity. Slafer and Andrade(1991) concluded there is a need to increase the grain num-ber (increase the sink) and simultaneously the source potential for further improvement of the grain yield. In Spain,Sanchez-Garcia et al.(2013) studied the grain yield improve-ment during the 20th century on a collection of 26 cultivars. They confirmed the increase in the harvest index during the 1950s, and a further improvement of the HI associated with the introduction of the semi-dwarf germplasm during the 1970s. The source/sink approach can therefore help to identify the possible levers to improve the wheat yield.
Source/sink manipulations after grain setting (i.e. shading, defoliation, ear trimming, etc) have been used to understand the source/sink balance effect on grain growth and identify ways to increase the yield of wheat (Serrago et al.,2013;Slafer and Savin,1994b;
Ma et al., 1996) or barley (Cartelle et al., 2006) or soybean (Egli and Bruening, 2001), either by manipulating the source or the sink potential. The results of these studies mostly agree: the grain yields of wheat crops in Europe are mostly sink limited or co-limited under favourable conditions the grain growth is limited by sink in the early grain filling and by the source in later grain filling phase (Acreche and Slafer,2009;Slafer and Savin,
1994b; Cartelle et al., 2006). Consequently, the increased source availability increases only slightly the grain growth, if it does. In this perspective, the potential attainable grain yield limited by the sink size, is expected to be reached in absence of disease in European conditions.
1.2.1.2 Fate of Nitrogen and Carbon fluxes during the senescence
After water, nitrogen is the most limiting factor of wheat crop growth (Vitousek,1994;
(Passioura,2002). Nitrogen is the main element of proteins and a substantial component of the biomass. Besides, more than 70% of proteins of wheat crops are linked to photo-synthesis. Up to 75% of the reduced N in cereal leaves is located in the mesophyll cells, mainly as Ribulose-Bisphosphate-Carboxylase-Oxygenase (Rubisco), and is involved in photosynthetic processes (Evans, 1989). So nitrogen plays also a central role in carbon assimilation, the fate of carbon and nitrogen fluxes are closely linked, and their interaction is closely linked to the grain yield (Zhang et al.,2014).
In the previous section, the post-anthesis physiology description focuses on the grain development and growth, through the deposition of carbohydrates and proteins. However, the canopy is the main source of carbon and nitrogen for grain filling. The senescence of the canopy is the visual evidence of major modification of the fluxes within the shoot happening during grain filling:
• The end of nitrogen uptake; • The net remobilisation of nitrogen; • The reduction of carbon assimilation. • The end of nitrogen uptake
Nitrogen comes from the soil complex and nitrogen uptake by the plant relies on environmental characteristics (soil type, water content, climate, etc) and capacity of the species (Masclaux-Daubresse et al., 2010). Ammonium NH4+ and nitrate NO
3– are the main forms of usable nitrogen compounds by plants. Nonetheless, wheat preferentially ab-sorbs nitrates. Physicochemical reactions depending on edaphic and weather conditions lead to N loss by volatilisation or leaching (Recous et al.,1997). Moreover, microorgan-isms are responsible for nitrogen immobilisation. Lastly, plants compete for nitrogen. In response, wheat crops are able to uptake high amount of nitrogen in a short time span that will be used later. This two-step metabolism is emphasized because beyond genetic im-provement through plant breeding to improve nitrogen uptake (root architecture: depth, root hair density and localisation, etc), agronomists work on nitrogen fertilisation man-agement to boost nitrogen nutrition, deciding the most appropriate timing and split of fertilisation as well as applied fertiliser amount (Spiertz and Devos 1983; Borghi et al. 1997inAranjuelo et al. 2013). Nitrogen Efficiency cannot satisfactorily be assessed only by the N-Use Efficiency (NUE) which quantifies the grain dry matter yield increase for an amount of N available, from the soil and/or N fertiliser. NUE is rather decomposed into two terms. The first, being the N-Uptake Efficiency (NUpE), which is the nitrogen uptake per unit of nitrogen available. The second is the N-Utilisation Efficiency (NUtE) which is the grain dry matter production per unit of nitrogen uptake. From a physiologist’s stand-point, this decomposition is relevant as it deals with two distinct processes involved in nitrogen use: uptake and then utilisation linked to carbon assimilation.
Figure 1.1: Main nitrogen metabolic pathways (Masclaux-Daubresse et al.,2008).
Nitrogen-uptake efficiency relies on root architecture traits but also the cells proper-ties and biochemical mechanisms for absorption (Cormier et al., 2016). Absorption of nitrogen occurs at the absorbent root hair level. It involves two transport systems: a low affinity transport system and a high affinity transport system respectively coded by NRT1 and NRT2 genes, and respectively enabled in case of high or low soil nitrogen availability according to a trade-off between affinity transport and energetic cost. Ammonium ab-sorption relies on different transporters coded by AMT (Ammonium transporter) genes (Masclaux-Daubresse et al., 2010). Assimilation of nitrogen in organic matter can be described in four steps (Fig. 1.1, young leaf ). First, the reduction of nitrate into nitrite requiring nitrate reductase occurs in the cytosol and is then followed by a reduction into ammonium by nitrite reductase in the plastids. Ammonium is fixed to Glutamate initially by glutamine synthethase to form the amino acid glutamine which, in turn, reacts with the 2-oxoglutarate catalysed by the glutamate synthase (Masclaux-Daubresse et al.,2010). The resulting glutamate molecules join the sap and are driven to the sinks.
Before anthesis, the uptake and assimilation of nitrogen influences source/sink bal-ance in many ways. For instbal-ance, it modifies plant architecture. Indeed, an increase in nitrogen absorption causes an increase of the leaf lamina area so that before senescence the variability in specific leaf nitrogen (nitrogen per unit leaf area) is largely buffered. In addition, agronomic practices are important. Indeed, if increasing the nitrogen fertilisa-tion generally improves the growth rate, an excessive input can also be damaging. For instance, an excessively dense canopy because of nitrogen not only is favourable to crop infection, but also increases the susceptibility to water stresses as evapotranspiration is enhanced by a large leaf area. It can even cause yield losses because of haying-off (Hall
et al.,2014): the vigorous vegetative growth enhanced by the large N fertilisation increase the canopy area and therefore increases water consumption beyond environmental avail-ability. Nitrogen not only had direct effects on sources, during ear growth pre-anthesis the ear N concentration might positively interact with floret fertility and the grain number (Sinclair and Jamieson, 2006). In addition, the lodging risk increases with a high shoot density at high N inputs.
The supply of nitrogen relies on the volume of soil explored by the growing roots. However, after anthesis the net root growth ceases (Foulkes et al., 2009) and as the ni-trogen availability for the plant decreases the nini-trogen uptake is decreased. Aranjuelo et al. (2013) reported that low nitrogen availability during the post-anthesis period in-duced early nitrogen remobilisation (bread wheat, cv. Califa). Although the post-anthesis nitrogen uptake is not the main source of nitrogen for nitrogen grain filling, it remains as substantial as 1 kg · ha−1·day−1 (Gooding et al.,2005).
In European farming practices, approximately a third of the nitrogen found in grain has been incorporated during the post-anthesis period, the complementary N coming from remobilisation of already incorporated nitrogen (Bancal et al.,2008). BesidesBancal et al. (2008) found that variability in grain N uptake at harvest was better correlated to variation of post-anthesis nitrogen uptake than to remobilized nitrogen (cv. Soissons in four experiments). Thus, despite remobilized nitrogen being the main source of grain nitrogen, it does not explain all variation of grain nitrogen content (Barbottin et al.,
2005; Bancal et al., 2008). This is also highlighted by the correlation between grain protein content and nitrate reductase activity (which catalyses nitrate reduction) during the post-anthesis period (Kichey et al.,2007). Finally, this can be confirmed by agronomic practices as Hébrard (1999) observed an association between late N fertilisation and increase grain protein content.
• Senescence and N remobilisation
The majority (60% to 85%) of nitrogen grain sink demand after anthesis is fulfilled by the remobilisation of nitrogen accumulated in stem and leaves prior to anthesis (Kichey et al.,2007). Nitrogen remobilisation is linked to senescence.
Far from being a simple and disorganized cell death, senescence is an evolutionary strategy which improves growth-limiting nutrient economy by remobilisation for organ growth (Dawson et al., 2008). In Arabidospsisi sp. two strategies can be observed: early senescence and high reproductive effort in opposition to late senescence and low repro-ductive effort (Wingler et al., 2006). Within monocarpic species, and especially for the wheat, sequential senescence is first observed for juvenile shoots: upper leaf growth is counterweighted by lower and older leaf senescence. Shading effect and modification of light quality might be a signal for senescence onset of lower and older leaves. Canopy
senescence happens after heading, then senescence and ongoing N remobilisation con-tribute to the grain growth. Leaf senescence is visually characterised by the chlorophyll degradation but may happen earlier and relies firstly on biochemical signals leading to transdifferentiation of cells. Indeed, senescence is not a cell decay, it is a modification of cell functions that, in annual crops such as wheat, is linked to nutrient remobilisation (Gregersen et al.,2013). Leaf function shifts from photosynthesis to remobilisation; from mainly anabolic to mainly catabolic functions. Chloroplasts are no longer maintained and active biochemical reactions result in metabolite export. At first, senescence can be reversed and the yellowing leaf can become green again, until a certain limit when rever-sion is no longer possible, and the leaf actually dies (Gregersen et al.,2013). Senescence timing is of major interest to wheat grain production.
The relation between surrounding environmental factors and genetic-dependent re-sponses describes the high effect of Genotype × Environment interaction (G×E). Genes accountable for senescence and mechanisms have been identified. Endogenous factors such as transcription factors NAC and WRKY are involved in sugar signalling (Wingler et al., 2006) and Senescence Associated Gene activation. Phytohormones such as ab-scissic acid, jasmonic acid and cytokinins are also associated with senescence regulation. Finally, the nutritional state and the source/sink balance also influence the life time of leaves. These factors are influenced by the surrounding environment which makes senes-cence a highly plastic trait (Wingler et al.,2006). Shading (Weaver and Amasino,2001), light intensity (Noodén et al.,1996), light quality (Rousseaux et al.,1996; Causin et al.,
2006) and water or nutrient availability (Ono et al.,1996;Thomas and de Villiers, 1996;
Crafts-Brandner et al., 1998; Ding et al., 2005) modify the senescence pattern. For in-stance, the relocation of N content of lower leaves to the top leaves within dense canopies confers competing advantage of tobacco wild typeBoonman et al.(2006). In Arabidopsis, the individual shading of a leaf accelerated its senescence (Weaver and Amasino, 2001). However the shading induced several alteration of the micro leaf environment and can be decomposed in a reduction of the light intensity (part of the light is intercepted) and modification of its quality according to the leaf-pigment properties. And indeed, the light quality affect the senescence as blue light exposition treatment applied on wheat plants was associated with delayed senescence, probably explained by a maintained catalase activity within the leaf (Causin et al., 2006). Rousseaux et al. (1996) observed that the decrease in Red/Far-red light composition ratio enhanced the senescence of lower leaves of sunflower (Helianthus annuus L.). The senescence of Arabidopsis thaliana plants was found mainly promoted by the light intensity rather than the photoperiod (Noodén et al.,1996). The accumulation of carbohydrate were also associated with earlier senescence of hydrid maize (Crafts-Brandner et al., 1984); in a field winter-wheat experiment a steam-girdled treatment applied of the flag leaf also initiated rapid senescence supposedly caused by
the accumulation of assimilates (Fröhlich and Feller, 1991). In addition to abiotic fac-tors, biotic factors can provoke senescence. However, if abiotic stresses are considered as funnelled into a common senescence pathway (Guo and Gan, 2012), it is not so clear for biotic stresses. From a source/sink perspective, the STB is an additional sink. Indeed, as for the plant, nitrogen is a key element for pathogen development. For instance, an increased availability of nitrogen in the leaves can raise the incidence of the STB as for other late-season diseases (Ben Slimane,2010).
Remobilized nitrogen is provided by protein hydrolysis which funnels into an amino acid / oligo peptides flux in the sap toward the sink (Feller and Fischer,1994; Masclaux-Daubresse et al., 2010). In the ear, nitrogen is converted into metabolic and structural proteins or in storage form. Metabolic and structural proteins are accumulated earlier in the cycle than storage forms, and their source/sink characterisation likely differs (Pask,
2009). At the plant level, it is possible that determinism of N metabolism therefore shifts during grain filling. Gaju et al. (2014) used Nitrogen Remobilisation Efficiency (propor-tion of N in the plant components at anthesis remobilized to the grain at harvest; NRE) to quantify the potential for remobilisation, which varies between genotypes (Cox et al.,
1985;Vansanford and MacKown, 1987; Kichey et al., 2007;Gaju et al., 2011,2014). Al-though, NRE varies to a higher extent between plant organs, possibly according to the properties of protein in the various tissues. Indeed, Pask et al. (2012) suggested that nitrogen in wheat plants is found in three main forms: i) structural (supporting tissues and vascular system, mostly in the stem, low remobilisation efficiency), ii) photosynthetic (mostly in the leaves where Rubisco comprises about 70% of leaf protein (Parry et al.,
2001) high remobilisation efficiency because of well organised degradation) and iii) re-serve (i.e. not photosynthetic, not structural, buffering N grain source/sink balance). Pask et al.(2012) estimated the N leaf lamina remobilisation efficiency was up to 76%; in com-parison, although the internodes represent half of remobilized nitrogen and most of the N reserve pool, NRE was only 48%. Pask et al.(2012) assumed these proteins are necessary for transport and mechanical functions.
The net nitrogen remobilisation increases when nitrogen uptake decreases in cereals (Aranjuelo et al.,2013), while the rate of nitrogen grain filling remains constant. Barneix
(2007) proposed a model in which N uptake and remobilisation are excluding one another. More generally the literature commonly describes N uptake and N remobilisation as two successive steps which is a clear simplification as at the plant level the young active organs are present together with old senescing ones. Moreover, plant N uptake may end several weeks after N is declining in every plant vegetative organ indicating remobilisation for these plant organs. A clear characterisation of interactions between net mobilisation and uptake could be addressed using sequential labelling and fine dissections which to our knowledge is not yet published.
At the plant level, senescence can be delayed: post anthesis fertilisation commonly results in extended plant life. In addition, stay-green genotypes show extended green leaf life (sorghum, Borrell and Hammer 2000; rice, Fu and Lee 2008; maize, Echarte et al. 2008; Martin et al. 2005; Ding et al. 2005; Rajcan and Tollenaar 1999; durum wheat,
Spano et al. 2003; wheat,Chen et al. 2010; Derkx et al. 2012). According to the genetic modifications, stay-green effect is sometimes referred as "cosmetic": the degradation of chlorophyll is impeded, the leaf stays green, but the carbon fixation has been stopped (Thomas and Howarth,2000). In the case of functional stay-green, a strong association with nitrogen metabolism — or photosynthesis parameters which depend on nitrogen metabolism — is often indicated. Stay-green genotypes have been associated with: higher leaf nitrogen concentration at anthesis in sorghum (Borrell and Hammer,2000) and wheat (flag leaf, Derkx et al. 2012), higher N absorption and storage in the shoot in maize (Martin et al., 2005), maintained post-silking N uptake in maize (Rajcan and Tollenaar,
1999), higher N uptake in wheat (Derkx et al., 2012), delayed and slower degradation rate of photosystem II in rice (Fu and Lee,2008) (i.e. N remobilisation), maintained leaf carbon exchange rate in maize (Echarte et al.,2008) or photosynthetic capacity in maize (Ding et al.,2005) and durum wheat (Spano et al.,2003), lower Reactive Oxygen Species (ROS, especially H2O2) peak values in wheat (Chen et al., 2010). The functional stay-green is associated with an increase in grain yield generally limited to stress conditions such as drought (Borrell and Hammer,2000) or nitrogen deficiency (Derkx et al.,2012); possibly because of sink limitation in non stressed conditions (Derkx et al.,2012). Efficient stay-green could also improve the yield when exposed to biotic stresses (pathosystem Spring wheat × spot blotch, Bipolaris sorokiniana,Joshi et al. 2007).
• Senescence and reduction of carbon assimilation
In leaf laminas, 70% of the protein is linked to photosynthetic functions: carbon and nitrogen fate are closely linked. During the grain filling phase, photosynthesis is the main source of carbon. Consequently, maintained photosynthesis during grain filling is expected to increase the photoassimilate availability in an extended grain-filling phase. Unlike carbon, nitrogen is mainly remobilized and late senescence decreases by dilution the nitrogen concentration of the grain (Gregersen, 2011), that is a quality criterion of wheat production, and a trade-off is generally understood between the grain yield and the protein concentration of the grain.
Independently from nitrogen, the photosynthesis potential relies on genotype traits describing the canopy architecture determining light capture or biochemical pathways involved in photosynthesis. The photosynthesis efficiency first relies on the light inter-ception. The Leaf Area Index (LAI) represents the ratio of leaf lamina area per unit of soil area. For a wheat crop maximal light interception is reached for LAI around 3 to 4
(Gouache et al.,2014), leaf shading then limiting the increase of light interception. How-ever, the LAI does not give information about the lamina leaf profile. The light extinction coefficient k describes the extent to which radiation is transmitted to the lower leaf lay-ers (Eq.1.1). A large extinction coefficient implies a high fraction of light interception by the upper leaf layers and low light level lower down the canopy (Bingham and Topp,
2009). Extinction coefficient can be manipulated through architecture traits including leaf inclination (Angus et al. 1972inBingham et al. 2009). Then, genetic variation exists for radiation-use efficiency (above-ground dry matter per unit radiation interception): the intercepted amount of light can be more or less efficiently used for carbon assimilation, and grain filling.
F= 1 − exp−k ·L AI (1.1)
With: F, the intercepted fraction of light; LAI, the Leaf Area Index; k, the light extinction coefficient.
During grain filling, the upper leaf layers are the main sources of carbon assimilation. The contribution of the two top leaf layers is estimated at 50% of carbon grain filling while ear photosynthesis could also be a non-negligible source of C during grain filling (Tambussi et al.,2007). Nonetheless, quantifications did not reach a consensus. Based on carbon isotope and six Mexican CIMMYT spring wheat genotypes in a field experiment,
Sanchez-Bragado et al.(2014) estimated the relative contribution to grain filling: flag leaf contribution ranged between 8-18% while the ear photosynthesis represented in average 70%. In comparison,Aranjuelo et al.(2011) worked with durum wheat (cv. Regallo) and concluded with its labelled carbon field experiment in spain that the ear photosynthesis does not contribute substantially during the beginning of the post-anthesis phase. Photo-synthesis of non-lamina organs obviously leads to tolerance to leaf attack by pathogens. So, the efficiency of the photosynthesis relies on architecture traits, photosynthetic bio-chemical potential, as well as source/sink balance.
The reduction of carbon assimilation can be compensated by the remobilisation of pre-anthesis stored carbon. Pre-anthesis carbon is stored preferentially in internodes and translocation contributes to grain filling. However, the pre-anthesis stored carbon may be preferentially used for respiration than grain filling (Aranjuelo et al.,2013).Ruuska et al.
(2006) identified large genetic variation of the water-soluble carbohydrate (WSC) accu-mulation in the stem (112 to 213 mg · g−1) associated with large broad-sense heritability (H = 0.90±0.12).
time ( °Cdanthesis )
Green Lamina Area
0 5 10 15 20 25 0 200 400 600 800 HAD
Figure 1.2: Theoretical green blade area kinetic. Since heading date, green area kinetic follows a sigmoid pattern, the area under the curve quantifies the available green area during grain filling period and so the volume of source. Given the relation, a first approximation of the Healthy Area Duration (HAD) can be obtained through multiplication of the Leaf Area Index (LAI) and the onset of senescence.
The attainable yield is therefore the result of this evolution along with the grain filling of these antagonist fluxes: reduction of nitrogen uptake, increasing of nitrogen remobil-isation and reduction of carbon assimilation. The potential yield appears as a trade-off between remobilisation flux and maintenance of the photosynthetic potential.
1.2.1.3 An equation for potential yield
The potential yield is defined in this project as the maximum attainable grain sink weight for a given source extent. The potential carbon assimilation is linked to the po-tential photosynthesis associated with large availability of green leaf lamina area during the grain filling period.
The remaining green area of the leaf lamina can be assessed at different times from anthesis to maturity. The kinetic provides an estimation of the complete evolution of the green area during grain filling and its integration from anthesis to maturity (Healthy Area Duration, HAD; Fig.1.2) informs about the green lamina area available during the grain filling period. The relevance of HAD is confirmed by the radiation-use efficiency which is relatively conservative, although limited RUE genetic variation was observed in winter wheat (Shearman et al., 2005). The HAD is an appropriate physiological estimation of
the grain source availability.
The calculation of the HAD still raises methodological questions. First of all, the HAD calculation is based on a non-linear kinetic, i.e. the evolution of green leaf lamina area from heading to maturity follows a sigmoid which includes a relatively sharp sudden decrease. The methods to estimate the area under the curve influence the HAD estima-tion. The less complex method is the trapezoidal estimation, a non-parametric method. For each time-step, green area evolution is supposed linear, the area under the curve is therefore trapezoidal and can be simply computed. The successive time-step trapeze are cumulated from heading stage to maturity. Parametric methods can be used, relying on the definition of an equation. The equation can vary, but the parameters of the equation are fitted to the observed data through converging algorithm. The quality of the HAD estimation depends mainly on the frequency of the observations, knowing that the rapid senescence phase typically lasts from 100 to 350 degree-days in the UK conditions (Gaju et al., 2011). Not only the estimation methods, but the HAD can also vary according the scale of calculation. The HAD is possibly estimated for each leaf layer or for the cumulated top leaf layers (canopy); the HAD results from individual shoot observation, but can be expressed per single grain or at the crop scale (per square metre).
Gouache et al. (2014) proposed a statistical definition of the potential grain yield regarding the grain source availability, the principle is explained hereafter. A yield obser-vation coupled with the HAD is an indicator of the crop performance: how much yield per unit of HAD can be achieved. Using a large sample of observed yield/HAD building on many genotypes × sites × seasons, it is possible to estimate the range of attainable yields for any range of HAD observed, the highest attainable yield being the potential yield. Instead of a discrete definition,Gouache et al.(2014) proposed to fit the boundary line which links the potential yields over the whole range of observed HAD. Because the light interception saturates with the increase in leaf area, it is also expected that the re-lationship between the potential yield and the HAD reaches an asymptote: once all the light has been intercepted, an increase in HAD is not expected to be associated with a significant yield gain. It is generally admitted that 90% of the light is intercepted for LAI ranging 3 to 4. Therefore, the potential yield curve was defined by a saturating equation (theoretical representation, Fig.1.3). Mathematically, the positive marginal yield gain de-creases with the HAD increase. Physiologically, the grain source limitation dede-creases with the HAD increase: the yield gain is largely responsive to HAD increase for low values of HAD; the yield gain does not respond to HAD increase for large values of HAD.
The potential yield described by the equation may be considered as a physiological limit observed in any cultivated situation. Consequently, the absence of disease does not guarantee that the crop will achieve its potential yield. The deviation below the curve can be explained by an inadequate combination of environment × genotype × agronomic
HAD, degree−days⋅m−2 Y ield, 100% DM, t ⋅ h a − 1 0 5 10 0 500 1000 1500 2000 2500
Figure 1.3: Theoretical source/sink potential curve. Couples of grain yield/HAD were simu-lated (n = 150, each blue dot). The HAD is estimated from anthesis to maturity. The quan-tile regression was used to fit a boundary line, defining the potential yield over the range of simulated HAD (τ = 0.98, the equation is an asymptotic regression defined as follow: y= 13.8(±1.2) × (1 − exp(−exp(−6.8(±0.2)) · x)). The potential curve shows that the grain yield gain decreases with the grain source limitation.
practices, or more directly from uneven potential between genotypes or even between environments.
1.2.2 Stress, strain and tolerance of Septoria tritici blotch
The preceding section described the yield components, the associated major fluxes along with the monocarpic senescence, and finally proposed a definition of the potential yield regarding the source availability. It was stated that, because of environment or genotype potential, the yield observed in healthy crops often remains below its potential considering the associated HAD. In addition, the pressure caused by a disease or an abiotic stress lowers the attainable yield. This pressure can be decomposed into the stress and the strain: the stress leading to a specific strain exerted on the crop (Levitt,1972). The stress is defined as any environmental factor (e.g. a drought, nutrient deficiency, airborne spores concentration) with the capacity to elicit from the plants a harmful chemical or physical change. The change is the strain (e.g. reduction of cell turgor, reduction of nitrogen content, disease symptoms).
of the plant protection strategies. In the domain of crop protection and working at the level of the genotype, in order to avoid crop losses, the most direct strategy is to avoid the stress by avoidance or escape strategies. This can be achieved, for instance, by modifying the architecture of the plant or imposing modification of the growth and development rate. If the stress can not be avoided, then two options can be developed. The first is to reduce the strain, the symptoms in the case of biotic stress, this is the resistance strategy. The second solution is to tolerate the strain which is precisely the definition of tolerance studied within the project: the ability of a plant to maintain performance in the presence of expressed disease (Ney et al.,2013).
The PhD project focuses on the tolerance of wheat to the STB, as a biotic stress. Therefore, in this section the essential information about STB is provided. Then, the quantification methods of tolerance of STB are proposed. Finally, previous studies pro-viding evidence and hypotheses for the identification of genotype tolerance traits. 1.2.2.1 The Septoria tritici blotch: a biotic stress of wheat crops
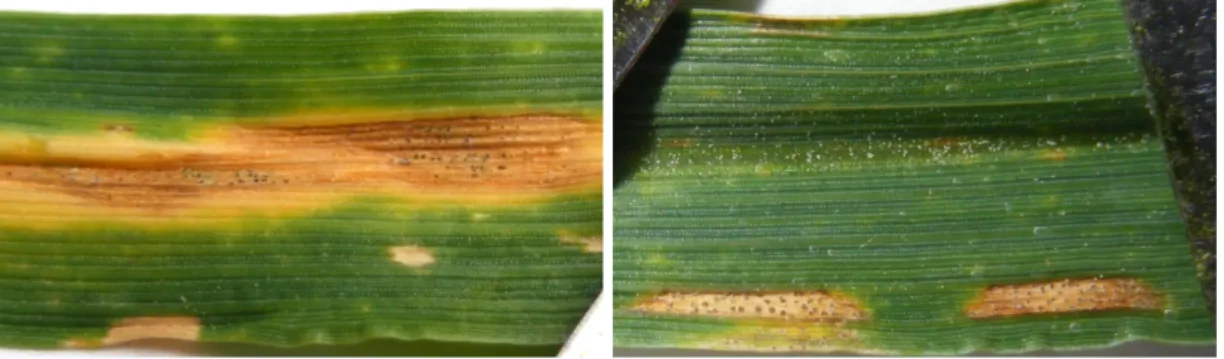
The Septoria tritici blotch (STB) is a leaf disease of wheat (Eyal et al.,1987), charac-terised by large necrotic area dotted by black pycnidia emerging from the leaf stomatae (further description of the symptoms, Fig.1.4). It is caused by the Ascomycetes Zymosep-toria tritici (Desm.), also formerly known as Mycosphaerella graminicola (Fückel).
Figure 1.4: The Septoria tritici blotch symptoms. The STB forms necrotic area on the leaves, rectangular or elliptic brown blotch, surrounded by yellowed area, dotted with dark spots. The necrotic area can also be circumvented, well delimited and lighter, where black spots also develop. The black spots are pycnidia, they contain the spores propagating the disease by rain splash effect. The prevalence of STB was relatively low prior to the 1960s-70s (Eyal et al., 1987) in Western Europe (Torriani et al., 2015). Since then, the breeding strategies increased the potential yield of wheat varieties and also increasing STB incidence appeared. The introduction of early maturing and semi-dwarf varieties (Eyal et al., 1987) and priority given to yield increase (Torriani et al., 2015) was inadvertently associated with higher STB yield loss. This was illustrated in Syngenta trials reported by Torriani et al.(2015) as a strong negative association of varietal resistance with yield potential that may explain the increase in yield susceptibility to STB.