HAL Id: inserm-02275996
https://www.hal.inserm.fr/inserm-02275996
Submitted on 2 Sep 2019
HAL is a multi-disciplinary open access
archive for the deposit and dissemination of
sci-entific research documents, whether they are
pub-lished or not. The documents may come from
teaching and research institutions in France or
abroad, or from public or private research centers.
L’archive ouverte pluridisciplinaire HAL, est
destinée au dépôt et à la diffusion de documents
scientifiques de niveau recherche, publiés ou non,
émanant des établissements d’enseignement et de
recherche français ou étrangers, des laboratoires
publics ou privés.
insights for PET/CT scheduling
Magno Oliveira, Charline Lasnon, Catherine Nganoa, Anne-Claire Gac,
Gandhi Damaj, Nicolas Aide
To cite this version:
Magno Oliveira, Charline Lasnon, Catherine Nganoa, Anne-Claire Gac, Gandhi Damaj, et al..
Com-prehensive analysis of the influence of G-CSF on the biodistribution of 18F-FDG in lymphoma
patients: insights for PET/CT scheduling. EJNMMI Research, SpringerOpen, 2019, 9 (1), pp.79.
�10.1186/s13550-019-0546-1�. �inserm-02275996�
O R I G I N A L R E S E A R C H
Open Access
Comprehensive analysis of the influence of
G-CSF on the biodistribution of
18
F-FDG in
lymphoma patients: insights for PET/CT
scheduling
Magno Oliveira
1†, Charline Lasnon
2,3†, Catherine Nganoa
1, Anne-Claire Gac
4, Gandhi Damaj
4and Nicolas Aide
1,3*Abstract
Aims: (1) To perform a comprehensive analysis of the time elapsed between the last G-CSF injection and the PET/ CT examination on the biodistribution of18F-FDG, with emphasis on liver, spleen, and bone marrow uptake, and (2) to investigate whether an inversion of the liver to spleen ratio affects the Deauville scoring.
Materials and methods: Retrospectively included were 74 consecutive diffuse large B cell lymphoma (DLBCL) patients referred for baseline and interim examinations and receiving immunochemotherapy with various G-CSF regimens. A comprehensive evaluation considering baseline metabolic active tumour volume (MATV), factors affecting liver uptake, the type of G-CSF, and the time elapsed between chemotherapy/G-CSF and interim PET/CTs was performed. Results: Mean (± SD) percentage variations between baseline and interim PET/CTs (i-PET/CT) for bone marrow
(%Variation_BONE), liver (%Variation_LIVER) and spleen (%Variation_SPLEEN) were equal to 32.0 ± 46.9%, 16.1 ± 42.8%, and
10.6 ± 51.1 %, respectively. %Variation_LIVERand %Variation_SPLEENwere higher in patients using lenograstim, but this was
linked to lower uptakes at baseline and was therefore likely not due to G-CSF itself. The mean delay between G-CSF injection and i-PET/CT acquisition was not an independent explanatory variable for %Variation_BONE, %Variation_LIVER, and
%Variation_SPLEEN. On the contrary, %Variation_BONEand %Variation_SPLEENwere negatively correlated to the time-lapse
between the end of chemotherapy and i-PET/CT:ρ = − 0.342 (p = 0.010) and ρ = − 0.529 (p < 0.0001), respectively. Patients with a time-lapse since the last injection of chemotherapy < 17 days displayed higher bone and spleen SUVmaxEARL.
%Variation_LIVERwas positively correlated to baseline MATV:ρ = 0.243 (p = 0.039). Patients displaying a high baseline
MATV≥ 177 cc had significantly lower liver SUVmaxEARLat baseline. This difference was no longer observed at i-PET/CT,
after tumours had shrunk.
Conclusions: Neither the type of G-CSF used nor the time elapsed between its last injection and i-PET/CT examination independently influences bone, hepatic, or splenic uptakes at i-PET/CT. The major determinant for the occurrence of a bone or spleen hypermetabolism on i-PET/CT is the time elapsed between the chemotherapy and the examination, which should be maintained above 15 days. Inversion of the liver to spleen ratio appeared to be due to increased spleen hypermetabolism on i-PET/CT, making unlikely an impact on the Deauville scoring.
Keywords: Lymphoma, PET/CT,18F-FDG, G-CSF, Lenogastrim, Filgastrim, Pegfilgastrim, Sink effect, Deauville score
© The Author(s). 2019 Open Access This article is distributed under the terms of the Creative Commons Attribution 4.0 International License (http://creativecommons.org/licenses/by/4.0/), which permits unrestricted use, distribution, and reproduction in any medium, provided you give appropriate credit to the original author(s) and the source, provide a link to the Creative Commons license, and indicate if changes were made.
* Correspondence:aide-n@chu-caen.fr
†Magno Oliveira and Charline Lasnon contributed equally to this work. 1Nuclear Medicine Department, CHU de Caen, Caen, France 3INSERM 1199 ANTICIPE, Normandy University, Caen, France
Full list of author information is available at the end of the article Oliveiraet al. EJNMMI Research (2019) 9:79
Background
Amongst the factors thought to alter the 18F-FDG
bio-distribution in cancer patients receiving chemotherapy are granulocyte colony-stimulating factors (G-CSFs), which are used to reduce the incidence of neutropenia [1, 2]. The use of G-CSF close to the18F-FDG PET/CT examination affects the 18F-FDG biodistribution, by
sig-nificantly increasing the 18F-FDG uptake in the bone
marrow and in the spleen [3, 4]. The proportion of
Hodgkin’s lymphoma and non-Hodgkin’s lymphoma patients receiving G-CSF is high, as the chemotherapy regimens used tend to induce leucopenia. Several drugs are available (pegfilgrastim, filgrastim, and lenograstim), requiring 1 to 5 daily subcutaneous injections on aver-age, starting 2 days after the end of chemotherapy.
G-CSFs act on the monocyte-macrophage haemato-poietic cell lineage to stimulate progenitor proliferation, differentiation, and functional activation of the mature haematopoietic cells. Due to their renal clearance, filgrastim and lenogastrim are short-acting G-CSF and require daily injections. Pegfilgrastim has the same mechanism of action as filgrastim, but is pegylated and therefore has a reduced renal clearance, compared with that of filgrastim, prolonging the serum half-life of the drug in vivo and requiring a single injection.
The 2014 EANM guidelines for PET/CT tumour
im-aging [5, 6] and the ASCO recommendations for PET/
CT imaging in lymphoma [7] recommend a time-lapse
of 10 days between chemotherapy and PET/CT imaging. It is therefore a common practice to schedule interim PET/CT (i-PET/CT) and end-of-treatment PET/CT (EoT-PET/CT) not too close to the last G-CSF injection. This is however not always feasible in busy PET/CT cen-tres and also because a chemotherapy regimen may be postponed for various reasons including insufficient blood count recovery. Consequently, some patients may be imaged shortly after their last chemotherapy and G-CSF injections, harbouring an increased bone marrow and spleen uptake. This results in an inversion of the liver to spleen ratio that could alter the post-treatment evaluation using the Deauville score (DS) [8]. Also af-fecting18F-FDG biodistribution and potentially the DS is tracer sequestration in bone marrow, known as the sink effect. This phenomenon has been reported to reduce tracer availability in healthy tissues in patients with bulky neuroendocrine tumours [9]. In the case of lymph-oma patients, this could affect the liver uptake and/or the residual tumour uptake.
The aims of the present study that focused on a homogeneous population of diffuse large B cell lymph-oma patients scanned for interim evaluation after immune-chemotherapy were (1) to perform a compre-hensive analysis of the time elapsed between the last G-CSF injection and the PET/CT examination on the
biodistribution of 18F-FDG , with emphasis on liver,
spleen, and bone marrow uptake, and (2) to investigate whether an inversion of the liver to spleen ratio affects the Deauville scoring.
Materials and methods
Patient recruitment
This study retrospectively included consecutive patients referred to our PET/CT unit for baseline and interim examinations (after 4 cycles of chemotherapy), diagnosed with DLBCL between December 2014 and December 2017. EoT-PET/CTs were not included, as these scans are usually performed several weeks after completion of treatment, when effects of G-CSF tend to be negligible. All selected patients had received R-CHOP (rituximab, cyclophosphamide, doxorubicin, vincristine, prednisone) or R-ACVBP (rituximab, doxorubicin, cyclophospha-mide, vindesine, bleomycin, prednisone) and G-CSF. For each patient, age, gender, Ann Arbor staging, baseline bone, spleen or liver involvement, Deauville scoring at interim PET/CT, the number of injections of G-CSF and date of the last one, the type of G-CSF, and the date of the last injection of chemotherapy were recorded from the patients’ medical files. Criteria of exclusion were chemotherapy other than R-CHOP or R-ACVBP, history of splenectomy, interim examinations not performed after 4 cycles, and no use of G-CSF.
Approval to collect data for our study was validated by the national committee for data privacy, the National Commission on Information Technology and Liberty (CNIL), with registration no. 2204611 v 0, and patients’ consent to use anonymised data for research purposes was sought on an opt-out basis.
PET/CT acquisition and reconstruction parameters
PET/CT examinations were performed as per the EANM guidelines for PET/CT tumour imaging [5,6].
Quantitative data presented in this study are EARL-compliant. Patients fasted at least 6 h before intravenous
injection of 18F-FDG and were scanned on a Biograph
TrueV system (Siemens Heathineers) from the skull base to the mid-thighs. A free-breathing CT acquisition (60 mAs, 130 kVp, pitch 1, and 6 × 2 mm collimation) was followed by a PET/CT acquisition with time per bed pos-ition of 160 and 220 s for normal weight (BMI≤ 25 kg/m2) and overweight patients (BMI > 25 kg/m2), respectively.
PET/CT studies were planned to be performed 60 ± 5 min post-injection. Extraction of data from the PET/CT DICOM headers showed the following information: mean injected activity ± SD was 4 ± 0.1 MBq/kg. Mean delay between injection and acquisition ± SD was 59.3 ± 5.2 min on baseline and 4 ± 0.2 MBq/kg and 60.3 ± 5.0 min on interim TEP, respectively.
Raw data were reconstructed with point spread func-tion (PSF) modeling (HD; TrueX, Siemens Heathineers), with 3 iterations and 21 subsets and no filtering. Matrix size was 168 × 168 resulting in voxels of 4.07 × 4.07 × 4 mm.
PET/CT analysis
All PET/CT examinations were reviewed on Syngo.via Soft-ware (Siemens Medical Solution). A 6.3-mm Gaussian filter, determined as per the EARL accreditation programme, was applied using the EQ.PET software [10,11]. For each PET/ CT examination, maximum standardized uptake values (SUVmax) were measured as follows:
– For liver and spleen, an automatic 3-cm-diameter volume of interest (VOI) was placed in the right liver lobe, avoiding liver or spleen lesions in the case of tumour involvement. A manually set VOI fitting the size of the spleen was used in cases where spleen was smaller than the 3 cm VOI.
– For bone marrow assessment, a VOI of 2 cm was placed on the sacral promontory, avoiding sacral foramens.
Liver mean Hounsfield units (HU) were measured to seek hepatic steatosis [12]. Baseline metabolic active tumour volume (MATV) was measured for each patient using a 41% isocontour method as per the EANM guide-lines. In the case of multiple lesions, MATVs of all le-sions were summed.
Statistical analysis
Quantitative data are presented as mean ± standard de-viation (SD). Baseline and interim PET/CT technical PET/CT characteristics (injected activity, glycaemia, delay), as well as patient’s BMI and liver densities, were compared using the non- parametric Wilcoxon test for paired samples. To seek a difference between
%Vari-ation_BONE, %Variation_LIVER, or %Variation_SPLEEN
amongst the three types of G-CSF, the Kruskal-Wallis test was used. Spearman’s correlations were performed
to seek a link between %Variation_BONE, %Variation_
LIVER, or %Variation_SPLEEN and BMI percentage
vari-ation (%Varivari-ation_BMI), glycaemia percentage variation
(%Variation_Glycaemia), and baseline MATV as well as
the time elapsed between the end of chemotherapy or the last G-CSF injection and interim PET/CT acquisi-tion. Spearman’s correlation was also used to search for a correlation linking the time-lapse between chemo-therapy or G-CSF last injection and interim PET/CT.
To seek a difference between SUVmaxEARL amongst
different groups of patients, the non-parametric Mann-Whitney or Kruskal-Wallis tests were used as appropri-ate. When needed, complementary multivariate analysis
was performed using ANCOVA. With regard to the in-version of the liver to spleen ratio, differences in the time-lapse between the end of chemotherapy or the last G-CSF injection and interim PET/CT in patients with this pattern versus those without were tested using the Mann-Whitney test. Moreover, difference in the repar-tition of G-CSF type used between these two groups of patients was tested using Fischer’s exact test.
Results
Population and PET/CT characteristics
Population characteristics can be seen in Table 1, and
PET/CT characteristics in Table2. On paired comparison, the injected activities for baseline and interim PET/CTs were not significantly different; neither was the time-lapse between injection and acquisition and liver densities. Mean BMI and glycaemia were significantly different be-tween baseline and interim PET/CT acquisition (Table2,
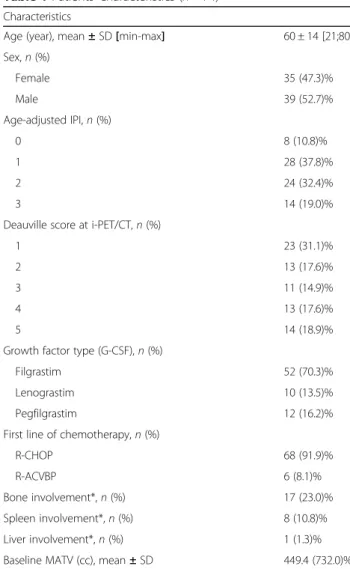
Table 1 Patients’ characteristics (n = 74) Characteristics
Age (year), mean ± SD [min-max] 60 ± 14 [21;80] Sex,n (%) Female 35 (47.3)% Male 39 (52.7)% Age-adjusted IPI,n (%) 0 8 (10.8)% 1 28 (37.8)% 2 24 (32.4)% 3 14 (19.0)%
Deauville score at i-PET/CT,n (%)
1 23 (31.1)%
2 13 (17.6)%
3 11 (14.9)%
4 13 (17.6)%
5 14 (18.9)%
Growth factor type (G-CSF),n (%)
Filgrastim 52 (70.3)%
Lenograstim 10 (13.5)%
Pegfilgrastim 12 (16.2)%
First line of chemotherapy,n (%)
R-CHOP 68 (91.9)%
R-ACVBP 6 (8.1)%
Bone involvement*,n (%) 17 (23.0)% Spleen involvement*,n (%) 8 (10.8)% Liver involvement*,n (%) 1 (1.3)% Baseline MATV (cc), mean ± SD 449.4 (732.0)%
IPI International Prognostic Index, i-PET/CT interim PET/CT, MATV metabolic active tumour volume
*Based on PET/CT analysis
p < 0.0001 and p = 0.044, respectively). The mean bone uptake %variation between baseline and interim PET/CTs (%Variation_BONE) was equal to 32.0 ± 46.9% (n = 57), the
mean liver uptake %variation (%Variation_LIVER) was
equal to 16.1 ± 42.8% (n = 73), and the spleen uptake %variation (%Variation_SPLEEN) was equal to 10.6 ± 51.1%
(n = 66). None of them were influenced by the %Vari-ation_BMI: ρ = 0.210 (p = 0.117) for %Variation_BONE, ρ =
− 0.071 (p = 0.548) for %Variation_LIVER, and ρ = 0.151
(p = 0.227) for %Variation_SPLEEN. None of them were
in-fluenced by the %Variation_Glycaemia: ρ = − 0.039 (p =
0.772) for %Variation_BONE, ρ = 0.138 (p = 0.244) for
%Variation_LIVER, and ρ = 0.012 (p = 0.921) for
%Vari-ation_SPLEEN. The mean time-lapse between the end of
chemotherapy and i-PET/CT for the whole series of pa-tients (n = 74) was equal to 16 ± 5 days (median = 17 days), and the mean time-lapse between G-CSF injection and i-PET/CT was equal to 8 ± 5 days (median = 8 days). There was a significant correlation between these two variables (ρ = 0.629, p < 0.0001).
Bone %variations between baseline and interim PET/CTs
This analysis was performed on the 57 patients with no bone involvement at baseline and interim PET/CT examinations.
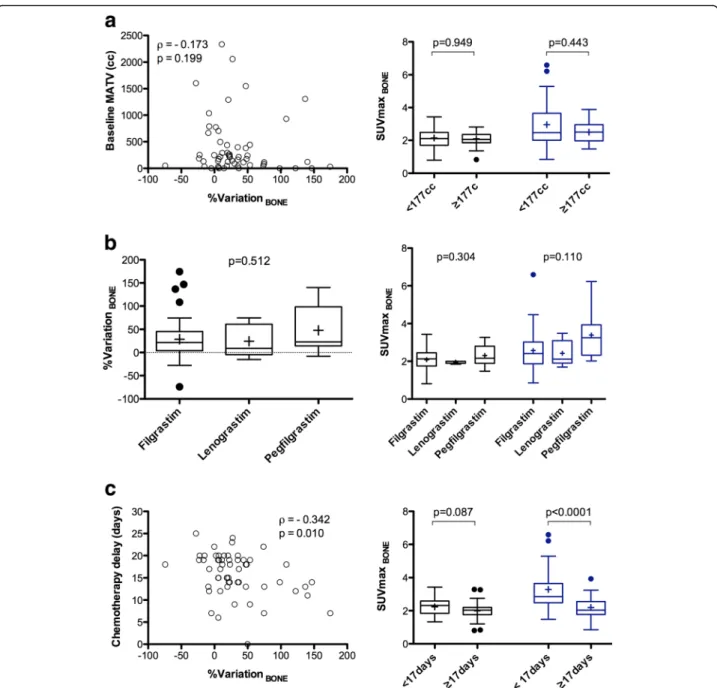
%Variation_BONE between baseline and interim was
not correlated to the baseline MATV (p = 0.199, Fig.1a). Moreover, there was no statistically significant difference in bone %variations between progressive disease patients (n = 5) and non-progressive patients: 45.2 ± 74.8% versus 30.8 ± 44.3%,p = 0.924. %Variation_BONEwas not
signifi-cantly different depending on which type of G-CSF was used (p = 0.512, Fig.1b). %Variation_BONEwas negatively
correlated to the time elapsed between the end of chemotherapy and i-PET/CT acquisition but not corre-lated to the mean delay between G-CSF injection and
interim PET/CT acquisition: ρ = − 0.342 (p = 0.010) and
ρ = − 0.208 (p = 0.12) (Fig. 1c). At interim PET/CT,
patients with a time-lapse between the end of chemo-therapy and i-PET/CT acquisition < 17 days (represent-ing the median value of the data) displayed higher bone
SUVmaxEARL than the other patients (p < 0.0001). Of
note, there were no significant differences in bone
SUV-maxEARL at baseline between these two groups of
pa-tients (p = 0.087).
Representative images of patients with a short (< 17 days) or long time-lapse (≥ 17 days) between the end of chemotherapy and i-PET/CT acquisition scan can be seen on Figs.2and3, respectively.
Liver %variations between baseline and interim PET/CTs
This analysis was performed on the 73 patients with no liver involvement at baseline and interim PET/CT examinations.
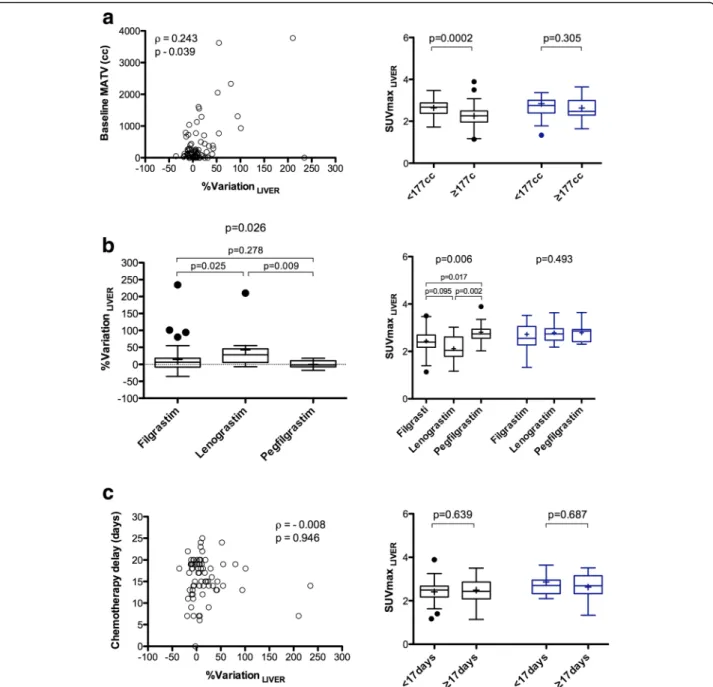
%Variation_LIVER between baseline and interim was
positively correlated to the baseline MATV (ρ = 0.243,
p = 0.039, Fig. 4a). Moreover, %Variation_LIVER was
lower in progressive disease patients (n = 5): − 8.7 ± 11.1% versus 17.9 ± 43.7%,p = 0.013. Patients displaying
a high baseline MATV ≥ 177 cc (representing the
median of the data) had significantly lower liver SUV-maxEARLat baseline (p = 0.0002). This difference was no
longer observed at interim PET/CT (p = 0.305).
%Vari-ation_LIVER was significantly different depending on
which type of G-CSF was used (p = 0.026). %Variation_
LIVERwas higher when using lenograstim as compared to
filgrastim or pegfilgrastim, with a mean %variation of 42.6 ± 62.0%, 14.6 ± 41.4%, and 0.2 ± 10.8%, respectively.
Baseline liver SUVmaxEARL were significantly lower for
patients who received lenograstim, whereas there was no
significant difference at interim PET/CT (Fig. 4b).
%Variation_LIVER was not correlated to the time elapsed
between the end of chemotherapy and i-PET/CT acqui-sition (p = 0.946, Fig.4c) nor to the mean delay between G-CSF injection and interim PET/CT acquisition (p = 0.870).
On multivariate analysis accounting for baseline MATV and the type of GCSF used, baseline MATV was the only independent explanatory variable for %Vari-ation_LIVER(p < 0.0001).
Spleen %variations between baseline and interim PET/CTs
This analysis was performed on the 66 patients with no spleen involvement at baseline and interim PET/CT
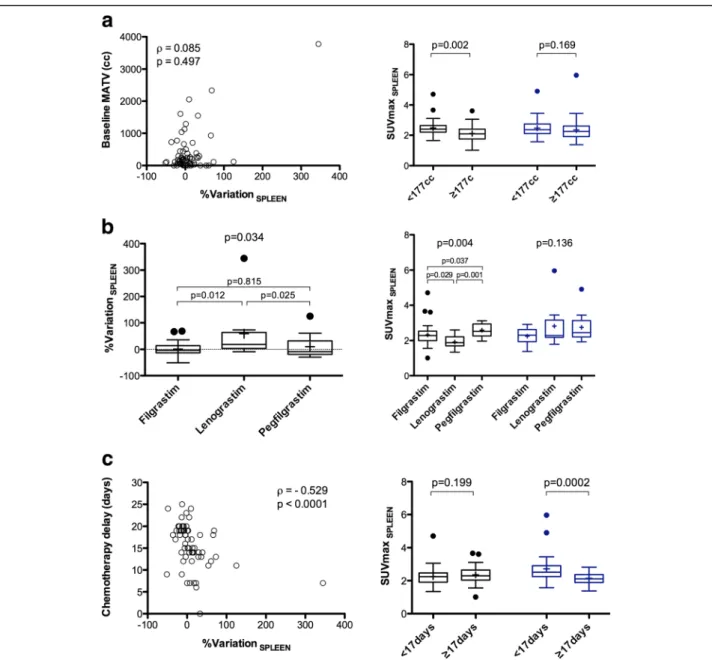
examinations. %Variation_SPLEEN between baseline and
interim was not correlated to the baseline MATV (ρ = 0.085, p = 0.497, Fig. 5a). There was no statistically significant difference in %Variation_SPLEENbetween
pro-gressive disease patients (n = 5) and non-propro-gressive
patients: − 5.6 ± 17.6% versus 11.9 ± 52.8%, p = 0.45.
%Variation_SPLEEN was significantly different depending
on which type of G-CSF was used (p = 0.034).
%Vari-ation_SPLEEN was higher when using lenograstim as
compared to filgrastim or pegfilgrastim, with a mean %variation of 58.9 ± 110.3%, 1.0 ± 24.1%, and 10.3 ±
44.8%, respectively (Fig. 5b). Baseline spleen
SUVmax-EARL were significantly lower for patients who received
Lenograstim, whereas there was no significant difference
at interim PET/CT. %Variation_SPLEEN was negatively
Table 2 PET/CT characteristics
Characteristics (mean ± SD) Baseline PET/CT Interim PET/CT p value Injected dose (MBq/kg) 4.0 ± 0.2 3.9 ± 0.4 0.132 Post-injection time (min) 59.2 ± 5.1 59.7 ± 4.9 0.602 BMI (kg/m2) 26.6 ± 5.6 25.7 ± 5.5 < 0.0001 Glycaemia (g/L) 1.00 ± 0.15 1.05 ± 0.19 0.044 Liver density (HU) 49.4 ± 10.1 48.8 ± 12.5 0.721
correlated to the time elapsed between the end of chemotherapy and i-PET/CT acquisition (ρ = − 0.529, p < 0.0001, Fig.5c) as well as to the mean time-lapse be-tween G-CSF injection and interim PET/CT acquisition (ρ = − 0.343, p = 0.005). At interim PET/CT, patients with a time-lapse between the end of chemotherapy and i-PET/CT acquisition < 17 days (representing the median
value of the data) displayed higher spleen SUVmaxEARL
than the other patients (p = 0.0002). Of note, there were
no significant differences in spleen SUVmaxEARL at
baseline between these two groups of patients (p = 0.199). Representative images of patients with a short (< 17 days) or long time-lapse (≥ 17 days) between the end of chemotherapy and i-PET/CT acquisition scan can be seen on Figs.2and3, respectively.
On multivariate analysis accounting the type of GCSF used, the time elapsed between the end of chemotherapy and i-PET/CT acquisition, and the mean time-lapse be-tween G-CSF injection and interim PET/CT acquisition, the use of lenograstim and the time-lapse between the
Fig. 1 Percentage variation (right panels) or absolute value (left panels) for bone marrow uptake between baseline and interim PET/CT, depending on the metabolic active tumour volume (MATV) on baseline scan (a), the type of G-CSF (b), and the time-lapse between the last injection of chemotherapy and the PET/CT examination (c)
end of chemotherapy and i-PET/CT acquisition were
in-dependent explanatory variables for %Variation_SPLEEN
withp value 0.007 and 0.033, respectively.
Occurrence of inversion of the hepatosplenic ratio
This analysis was performed on the 65 patients with no spleen or liver involvement at baseline and interim PET/ CT examinations.
Inversion of the hepatosplenic ratio occurred in 17 pa-tients (26.1%). Papa-tients with an inversion of the liver-to-spleen ratio had lower time-lapse between the end of chemotherapy and i-PET/CT acquisition as compared to
others: 11 ± 5 days versus 18 ± 4 days, respectively
(p < 0.0001). There was no significant difference in the type of G-CSF used between patients displaying an in-version of the liver-to-spleen ratio and those who did not (p = 0.218).
Discussion
G-CSF are recommended after the two main chemother-apy regimens used to treat DLBCL, namely R-CHOP and R-ACVB, and have been reported to induce in-creased uptake in the spleen and in the bone marrow [3], the latter also being affected by normal regeneration following chemotherapy. Previous studies reported
ef-fects of G-CSF on the biodistribution of 18F-FDG at a
time when only one type of G-CSF was available (pegfil-grastrim [3]), and did not account for the time elapsed between both the chemotherapy and the last injection of G-CSF and that PET/CT scan. Indeed, while the physio-pathological basis of G-CSF makes obvious the link be-tween this treatment and the observed increased uptake in the spleen [13], increased bone marrow uptake could be due to either G-CSF and/or bone marrow
regener-ation. Sequestration of 18F-FDG within the skeleton
Fig. 2 Fifty-two-year-old male patients imaged at baseline (a, b) and after 4 cycles of R-ACVBP (c, d). Interim PET/CT was performed 7 days and 6 days following the last injection of chemotherapy and G-CSF, respectively. The injected G-CSF was lenograstim, at a dosage of 34MUI daily for a 4-day period. In this case, low hepatic18F-FDG
uptake can be observed at baseline because of a tracer sequestration in the bulky mass. This pattern resolves after the tumour had shrunk on interim PET/CT, but because of a short time-lapse between the last chemotherapy injection and interim PET/CT, an increased bone marrow and splenic uptakes are observed
Fig. 3 A 47-year-old female patient imaged at baseline (a, b) and after 4 cycles of R-ACVP (c, d). Interim PET/CT was performed 17 days and 12 days following the last injection of chemotherapy and G-CSF, respectively. The injected G-CSF was lenogastrim, at a dosage of 34MUI daily for a 5-day period. Thanks to a time-lapse between the last chemotherapy injection and interim PET/CT, no significant increased bone marrow or splenic uptake are observed
could alter residual tumour uptake and therefore the Deauville scoring. Given the observed variability in the type and duration of G-CSF treatment, a better knowledge of the phenomenon responsible for an altered bone mar-row and spleen biodistribution and the duration of these patterns would be useful for a better scheduling of pa-tients’ scans in the busy PET/CT unit. It would also help in deciding whether a PET/CT scan has to be postponed when a patient shows up early after the last injection of G-CSF.
In our study, lenograstim was associated with a higher percentage of variation in liver and spleen between base-line and interim PET/CT. However, the variation in the liver and spleen was linked to a lower uptake in the two organs at baseline, likely due to tumour sequestration in bulky tumour masses, and was therefore not due to the G-CSF itself. This hypothesis is supported by the fact
that we found that %Variation_LIVER was lower in
pro-gressing patients compared to the non-propro-gressing patients.
Fig. 4 Percentage variation (right panels) or absolute value (left panels) for liver uptake between baseline and interim PET/CT, depending on the metabolic active tumour volume (MATV) on baseline scan (a), the type of G-CSF (b), and the time-lapse between the last injection of
chemotherapy and the PET/CT examination (c)
The time elapsed between the last injection of G-CSF and the interim PET/CT examination appeared less de-cisive than the time-lapse between the end of chemother-apy and the i-PET/CT examination, even if a strong correlation was observed. Indeed, no association between the variation in bone marrow, liver, and spleen and the time-lapse between the last injection of G-CSF and the in-terim PET/CT examination was found on multivariate analysis. On the other hand, a delay inferior to 17 days be-tween the end of chemotherapy and the i-PET/CT exam-ination led to increased bone and spleen uptakes on interim PET/CT images. These findings have practical consequences when planning PET/CT examinations; as
an a priori knowledge of the type and dose of G-CSF, as well as patients’ compliance to injections is difficult to ap-prehend, scheduling PET/CT scans at least 15 days after the last injection of chemotherapy may be recom-mended. Of note, guidelines for PET/CT imaging in lymphoma patients recommend a 10-day delay after
chemotherapy [7], which appears insufficient based on
our data. Indeed, our results show that a time-lapse of 15 days could allow to eliminate the majority (9/12,
75%, Fig. 1c) of patients displaying a percentage of
variation in the bone uptake greater than 50%, while taking the 10-day time-lapse would identify only a few of these patients (3/12, 25%, Fig. 1c).
Fig. 5 Percentage variation (right panels) or absolute value (left panels) for spleen uptake between baseline and interim PET/CT, depending on the metabolic active tumour volume (MATV) on baseline scan (a), the type of G-CSF (b) and the time-lapse between the last injection of chemotherapy and the PET/CT examination (c)
Of note, despite its longer half-life compared to filgas-trim and lenogasfilgas-trim due to its PEGylated nature, we did not observe larger variations in bone marrow and spleen uptake in the group of patients having received pegfilgastrim. In the study from Jacene et al. [3] involv-ing breast cancer patients receivinvolv-ing docetaxel plus pegfil-gastrim, the time-lapse between the last injection of chemotherapy and PET/CT scan was 7 ± 0.7 days, and the time-lapse between the last injection of GCSF and PET/CT scan was 6 ± 0.7 days, compared to 16 ± 5 and 8 ± 5 days in our study, respectively. We feel likely that the greater increase in bone marrow and spleen they
observed1 compared to our data (%Variation_BONE and
%Variation_SPLEEN equal to 244.6 ± 127.3% and 171.3 ±
60.6% versus 32.0 ± 46.9% and 10.6 ± 51.1, respectively) is related to a shorter time-lapse post-chemotherapy.
On multivariable analysis, percentage variation in the liver was only influenced by the baseline MATV via the well-known sink effect that led to low liver uptake at baseline, this phenomenon being reversible after chemo-therapy, when bulky tumour masses had shrunk, as shown in Fig. 4. Interestingly, hepatosplenic ratio inver-sion, which is only associated with a shorter time-lapse between the end of chemotherapy and the i-PET/CT acquisition, is therefore only due to an increase in spleen
uptake. Lower 18F-FDG hepatic uptake in lymphoma
patients due to a tumour sink effect has already been suspected by Wu et al. [14]. Another confounding factor potentially decreasing liver metabolism is liver steatosis [12]. However, in the present series, steatotic liver was only observed in 14 patients (18.9%) and liver densities were not different between baseline and interim PET/
CT examinations, meaning that %Variation_LIVER is
certainly not biased by steatosis. Therefore, overall, in-version of the hepatosplenic ratio is unlikely to have any influence on the Deauville score determination. How-ever, the Deauville scoring could still be influenced by a sink effect [9] due to tracer sequestration in the bone marrow; Teoh et al. predicted the tumour uptake to be reduced by a maximum of 11.5 % in the case of
G-CSF-induced hypermetabolism in the bone marrow [15].
Based on all these findings together, maintaining the time-lapse between the chemotherapy and the PET/CT examination greater than 15 days appears to be a simple
way of avoiding disturbance in 18F-FDG biodistribution
and detrimental effect on the Deauville scoring in in-terim PET/CT.
Conclusion
Neither the type of G-CSF used nor the time elapsed be-tween its last injection and interim PET/CT examination independently influences bone, hepatic, or splenic
uptakes. The liver uptake is not influenced by any of these factors, and therefore, the occurrence of a hepatos-plenic ratio inversion is only due to spleen hypermetabo-lism, making unlikely an impact on the Deauville scoring. The major determinant for the occurrence of a bone or spleen hypermetabolism on interim PET/CT is the time-lapse between the chemotherapy and the PET/ CT examination, which should be maintained greater than 15 days.
Abbreviations
%Variation_BMI:Percentage variation between baseline and interim PET/CTs
for BMI; %Variation_BONE: Percentage variation between baseline and interim
PET/CTs for bone marrow; %Variation_Glycaemia: Percentage variation between
baseline and interim PET/CTs for glycaemia; %Variation_LIVER: Percentage
variation between baseline and interim PET/CTs for liver;
%Variation_SPLEEN: Percentage variation between baseline and interim PET/
CTs for spleen;18F-FDG: 18F-Fluorodeoxyglucose; BMI: Body Mass Index; DLBCL: Diffuse large B cell lymphoma; DS: Deauville scoring; Eot-PET/CT: End-of-treatment PET/CT; G-CSF: Granulocyte colony-stimulating factor;
HU: Hounsfield unit; i-PET/CT: Interim PET/CT; MATV: Metabolic active tumour volume; PET/CT: Positron emission tomography/computed tomography; VOI: Volume of interest
Acknowledgements
Ms. Helen Lapasset is thanked for the English editing. Authors’ contributions
NA designed the study and wrote the manuscript. MO performed the PET/ CT images analysis and helped to write the manuscript. CN collected the clinical data and helped to design the study. ACG collected the clinical data. CL performed the statistical analysis, wrote the article, and built the figures and tables. GD collected the clinical data. All authors read and approved the final version of the manuscript.
Authors’ information Not applicable Funding
The authors declare that they had no funding. Availability of data and materials
The datasets used and/or analysed during the current study are available from the corresponding author upon request.
Ethics approval and consent to participate
All procedures performed in studies involving human participants were in accordance with the ethical standards of the institutional and/or national research committee and with the 1964 Helsinki Declaration and its later amendments or comparable ethical standards.
Approval to collect data for our study was validated by the national committee for data privacy, the National Commission on Information Technology and Liberty (CNIL), with registration no. 2204611 v 0, and patients’ consent to use anonymised data for research purposes was sought on an opt-out basis.
Consent for publication Not applicable Competing interests
The authors declare that they have no competing interests. Author details
1
Nuclear Medicine Department, CHU de Caen, Caen, France.2Nuclear Medicine Department, Centre François Baclesse, Caen, France.3INSERM 1199
ANTICIPE, Normandy University, Caen, France.4Haemalology Institute, CHU
de Caen and Centre François Baclesse, Caen, France.
1Data computed from Table2of reference [3].
Received: 12 March 2019 Accepted: 25 July 2019
References
1. Lieschke GJ, Burgess AW. Granulocyte colony-stimulating factor and granulocyte-macrophage colony-stimulating factor (1). N Engl J Med. 1992; 327:28–35.https://doi.org/10.1056/nejm199207023270106.
2. Lieschke GJ, Burgess AW. Granulocyte colony-stimulating factor and granulocyte-macrophage colony-stimulating factor (2). N Engl J Med. 1992; 327:99–106.https://doi.org/10.1056/nejm199207093270207.
3. Jacene HA, Ishimori T, Engles JM, Leboulleux S, Stearns V, Wahl RL. Effects of pegfilgrastim on normal biodistribution of 18F-FDG: preclinical and clinical studies. J Nucl Med. 2006;47:950–6.
4. Sugawara Y, Zasadny KR, Kison PV, Baker LH, Wahl RL. Splenic fluorodeoxyglucose uptake increased by granulocyte colony-stimulating factor therapy: PET imaging results. J Nucl Med. 1999;40:1456–62. 5. Boellaard R, Delgado-Bolton R, Oyen WJ, Giammarile F, Tatsch K, Eschner W,
et al. FDG PET/CT: EANM procedure guidelines for tumour imaging: version 2.0. Eur J Nucl Med Mol Imaging. 2015;42:328–54.https://doi.org/10.1007/ s00259-014-2961-x.
6. Boellaard R, O'Doherty MJ, Weber WA, Mottaghy FM, Lonsdale MN, Stroobants SG, et al. FDG PET and PET/CT: EANM procedure guidelines for tumour PET imaging: version 1.0. Eur J Nucl Med Mol Imaging. 2010;37:181– 200.https://doi.org/10.1007/s00259-009-1297-4.
7. Juweid ME, Stroobants S, Hoekstra OS, Mottaghy FM, Dietlein M, Guermazi A, et al. Use of positron emission tomography for response assessment of lymphoma: consensus of the Imaging Subcommittee of International Harmonization Project in Lymphoma. J Clin Oncol. 2007;25:571–8.https:// doi.org/10.1200/JCO.2006.08.2305.
8. Barrington SF, Kluge R. FDG PET for therapy monitoring in Hodgkin and non-Hodgkin lymphomas. Eur J Nucl Med Mol Imaging. 2017;44:97–110.
https://doi.org/10.1007/s00259-017-3690-8.
9. Beauregard JM, Hofman MS, Kong G, Hicks RJ. The tumour sink effect on the biodistribution of 68Ga-DOTA-octreotate: implications for peptide receptor radionuclide therapy. Eur J Nucl Med Mol Imaging. 2012;39:50–6.
https://doi.org/10.1007/s00259-011-1937-3.
10. Aide N, Lasnon C, Veit-Haibach P, Sera T, Sattler B, Boellaard R. EANM/EARL harmonization strategies in PET quantification: from daily practice to multicentre oncological studies. Eur J Nucl Med Mol Imaging. 2017;44:17– 31.https://doi.org/10.1007/s00259-017-3740-2.
11. Lasnon C, Salomon T, Desmonts C, Do P, Oulkhouir Y, Madelaine J, et al. Generating harmonized SUV within the EANM EARL accreditation program: software approach versus EARL-compliant reconstruction. Ann Nucl Med. 2017;31:125–34.https://doi.org/10.1007/s12149-016-1135-2.
12. Salomon T, Nganoa C, Gac AC, Fruchart C, Damaj G, Aide N, et al. Assessment of alteration in liver (18)F-FDG uptake due to steatosis in lymphoma patients and its impact on the Deauville score. Eur J Nucl Med Mol Imaging. 2018;45:941–50.https://doi.org/10.1007/s00259-017-3914-y. 13. Tsoi WC, To KF, Feng CS. Splenic hematopoiesis after granulocyte-colony
stimulating factor therapy in a lupus patient. Am J Hematol. 1996;53:283–4.
https://doi.org/10.1002/(sici)1096-8652(199612)53:4<283::Aid-ajh19>3.0.Co;2-d. 14. Wu X, Bhattarai A, Korkola P, Pertovaara H, Eskola H, Kellokumpu-Lehtinen
PL. The association between liver and tumor [18F]FDG uptake in patients with diffuse large B cell lymphoma during chemotherapy. Mol Imaging Biol. 2017.https://doi.org/10.1007/s11307-017-1044-3.
15. Teo BK, Badiee S, Hadi M, Lam T, Johnson L, Seo Y, et al. Correcting tumour SUV for enhanced bone marrow uptake: retrospective 18F-FDG PET/CT studies. Nucl Med commun. 2008;29:359–66.https://doi.org/10.1097/MNM. 0b013e3282f44f99.
Publisher’s Note
Springer Nature remains neutral with regard to jurisdictional claims in published maps and institutional affiliations.