Cluster Analysis of Urban Water Supply and Demand:
Toward Large-Scale Comparative Sustainability Planning
The MIT Faculty has made this article openly available.
Please share
how this access benefits you. Your story matters.
Citation
Noiva, Karen et al., "Cluster analysis of urban water supply and
demand: Toward large-scale comparative sustainability planning."
Sustainable Cities and Society 27 (November 2016): 484-96 doi.
10.1016/j.scs.2016.06.003 ©2016 Authors
As Published
https://dx.doi.org/10.1016/J.SCS.2016.06.003
Publisher
Elsevier BV
Version
Final published version
Citable link
https://hdl.handle.net/1721.1/128741
Terms of Use
Creative Commons Attribution-NonCommercial-NoDerivs License
ContentslistsavailableatScienceDirect
Sustainable
Cities
and
Society
j o u r n a l ho me p a g e :w w w . e l s e v i e r . c o m / l o c a t e / s c s
Cluster
analysis
of
urban
water
supply
and
demand:
Toward
large-scale
comparative
sustainability
planning
Karen
Noiva
∗,
John
E.
Fernández,
James
L.
Wescoat
Jr.
DepartmentofArchitecture,MassachusettsInstituteofTechnology,77MassachusettsAve,Cambridge,MA02139,USA
a
r
t
i
c
l
e
i
n
f
o
Articlehistory:
Received29January2016
Receivedinrevisedform2June2016 Accepted4June2016
Availableonline7June2016 Keywords:
Clusteranalysis Comparativemethods Sustainableurbanwatersystems Waterbudget
Wateruse
a
b
s
t
r
a
c
t
Thesustainabilityofurbanwatersystemsisoftencomparedinsmallnumbersofcasesselectedasmuch fortheirfamiliarityasfortheirsimilaritiesanddifferences.Fewstudiesexaminelargeurbandatasets toconductcomparisonsthatidentifyunexpectedsimilaritiesanddifferencesamongurbanwater sys-temsandproblems.Thisresearchanalyzedadatasetof142citiesthatincludesannualpercapitawater use(m3/yr/cap)andpopulation.Itaddeda0.5◦gridannualwaterbudgetvalue(P-PET/yr)asanindex ofhydroclimaticwatersupply.Withtheseindicesofurbanwatersupplyanddemand,weconducted ahierarchicalclusteranalysistoidentifyrelativesimilaritiesamong,anddistancesbetween,the142 cases.Whilesomeexpectedgroupingsofclimaticallysimilarcitieswereidentified,unexpectedclusters werealsoidentified,e.g.,citiesthatusewateratgreaterratesthanlocalclimaticwaterbudgets pro-vide.Thosecitiesmustseekwaterfromgreaterdistancesandgreaterdepths.Theyfacegreaterwater andwastewatertreatmentcosts.Tobecomemoresustainabletheymustincreasewateruseefficiency, demandmanagement,reuse,andrecycling.Thesignificanceofthepopulationvariablesuggeststhat addingotherexplanatorysocio-economicvariables,aswellasmoreprecisewatersystemindices,are logicalnextstepsforcomparativeanalysisofurbanwatersustainability.
©2016TheAuthors.PublishedbyElsevierLtd.ThisisanopenaccessarticleundertheCCBY-NC-ND license(http://creativecommons.org/licenses/by-nc-nd/4.0/).
1. Introductionandconceptualframework
Comparativeurban water researchis importantfor drawing generalizationsaboutsustainabilityandforadaptinglessonsfrom one set of cities for consideration in others. The current sta-tusof comparativeurbanwaterresearchis limited(Mollinga& Gondhalekar,2014;Wescoat,2014).Many studiesexamine sin-glecasestudies(e.g.,Gandy,2014).Someselectcasesthatreflect theauthors’expertise(Novotny,Ahern,&Brown,2010;Wörlen etal.,2016).Othersgroupcasestudiesunderpredefinedheadings, e.g.,arid,tropical,low-income,megacities,etc.(Fletcher&Deletic, 2008).Moststriveforgeneralizablemodelsandmethodsbut with-outanalyzingalargenumberofcases(Mollinga&Gondhalekar, 2014).Asaresult,comparisonsandtheconclusionsthatcanbe drawnfromthemtendtobelimitedandqualitative(Mollinga& Gondhalekar,2014;Wescoat,2009;Wescoat,2014).Thisstudylays afoundationforcomparativeresearchonurbanwater sustainabil-ityusingclusteranalysismethods.
Thesustainabilityframeworkemployedhereinvolvestwo sim-plemassbalancevariablesforurbanwatersystems.Thefirstisan
∗ Correspondingauthor.
E-mailaddresses:knoiva@mit.edu,knoiva@gmail.com(K.Noiva).
annualclimaticwaterbudgetforeachurbanarea,whichsubtracts potentialevaporationfromprecipitation(elaboratedinthe meth-odssectionbelow)(Willmott,Rowe,&Mintz,1985).Waterbalance analysisestimatesclimaticwater supply(P) anddemand(PET). Somecitieshaveanannualwaterbalancesurplusthatcanbestored ormanagedasrunoff,whileothershaveclimaticwaterdeficitsthat mustbemanagedthroughrainwaterharvesting, wateruse effi-ciency,recycling,reuseand,barringthosemethods,longdistance waterimports(Plappally&Lienhard,2012;Plappally&Lienhard, 2013).Thesecondmetricisgrossannualwaterusepercapitain eachcity.Thesetwovariablesprovideannualestimatesofclimatic watersupplyandgrosspercapitawaterdemand.Whileonewould expectsomecorrelationbetweensupplyanddemand,citieshave historicallysupplementedlocalwatersupplieswithlongdistance watertransfers,aquiferdepletion,andinsomecasesdesalination (McDonald,Weber, Padowski,Flörke,&Schneider,2014).These variablesareweaklycorrelatedandaretreatedhereasindependent variablestoclassifythesustainabilityofurbanwaterpatterns.
The water balance approach may be compared with other sustainabilityheuristicssuchaswater footprint analysis,which examinesdifferenttypesandamountsofwateruseina system (HoekstraandChapagain,2007;Hoff,Döll,Fader,Gerten,&Hauser, 2014).Herewe adaptthefootprintideainanurbanWaterUse and ClimateIndex (WUCIin m2/cap)(See Section 2).Thistype
http://dx.doi.org/10.1016/j.scs.2016.06.003
2210-6707/©2016TheAuthors.PublishedbyElsevierLtd.ThisisanopenaccessarticleundertheCCBY-NC-NDlicense(http://creativecommons.org/licenses/by-nc-nd/4. 0/).
of accountingis taken furtherin studies of virtualwater trade and sustainable supply chain analysis (e.g., Daniels, Lenzen, & Kenway,2011;Ercin,Aldaya,&Hoekstra,2011;Hoffetal.,2014; Konar,Dalin,Hanasaki,Rinaldo,&Rodriguez-Iturbe,2012;Suweis, Konar,Dalin,Hanasaki,&Rinaldo,2011).Explanatorysustainability heuristicssuchastheIPATequation(I=P*A*T)relate environmen-talimpacts(e.g.resourceuse)(I)topopulationsize(P),affluence (A),andtechnology(T)(Rosa,York,&Dietz,2004).TheIPAT equa-tiontakesmultipleforms.OnepopularversionisI=P*F,whereFis impactpercapita(Chertow,2001).WhileIPATispresentedasan equation,itismoreofaheuristicofdrivingandameliorating fac-tors(Chertow,2001).Greateremphasisonexplanatoryanalysisof watersupplyanddemandpatternsisneededineachapproach,but afirststeptowardthataimisidentifyingandcharacterizingurban waterpatterns,whichcanthenenablesystematicsubsamplingand comparison.
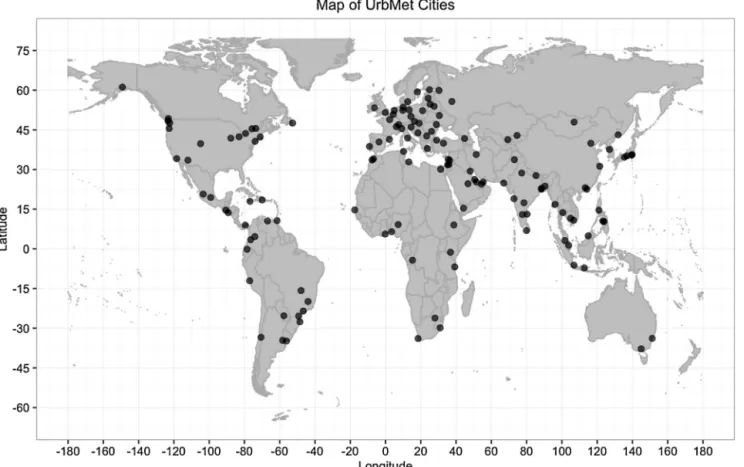
Applicationofstatisticaldata-miningtechniquessuchascluster analysistourbansocio-economicclassificationiswell-established (Astel,Tsakovski,Barbieri,&Simeonov,2007;Bettencourt,2013; Kim,1997; Batty,Axhausen,Giannotti,Pozdnoukhov,&Bazzani, 2012; MacCannell,1957; Kennedy, 2011). Applicationto water issueswithincitiesisamorerecentdevelopment(Yuetal.,2013; Diao,Farmani, Fu,Astaraie-Imani,&Ward,2014), as is classifi-cation of urban water systems within a particular country(Yu &Chen,2010;Rahill-Marier &Lall,2013;Rao&Srinivas,2008a, Chapter 3; Rao &Srinivas, 2008b,Chapter 3).In reviewing the waterresourcesliterature,Mollingaand Gondhalekarsuggested anapproachforassessing‘small-N’and‘medium-N’casestudies (Mollinga&Gondhalekar,2014).Forexample,clusteringhasbeen appliedtotheproblemofforecasting short-termwaterdemand withinasinglecityormunicipalwatersystem,whichfallsunderthe categoryofasmall-Nanalysis(Garg,2007;Candelieri&Archetti, 2014;Wu,Lv,Dong,Wang,&Xu,2012).Otherclusteringstudies fallintothemedium-Ncategoryofcomparativeanalysis,including onethatincludesak-meansclusteringofcitiesbasedonwater foot-print,energyconsumption,andmunicipalwastewithintheUnited Kingdom(Khamis,2012).AstudybyMayeretal.usedcluster anal-ysistoclassifywatershedsintheGreatLakesbasinaccordingto socialandenvironmentalattributes(Mayer,Winkler,&Fry,2014). Andalarge-NstudybytheColumbiaUniversityWaterCenterused hierarchicalclusteringtoanalyzeutilityratesintheUnitedStates withregardstofinancialsustainability(Rahill-Marier&Lall,2013). Thispaperusesclusteringalgorithmstoanalyzewatersupply anddemandfor142citiesaroundtheworldtodevelopan interna-tionalclassificationofurbanwatersustainabilitysituations.Ituses theMITUrbanMetabolismdatabase(Fig.1),whichwascreated todevelopanurbansustainabilitytypologybasedonfour predic-torvariables(population,populationdensity,affluence[GDPper capita],andclimate[Köppenclassification]); andeightresponse variables(percapitaconsumptionofconstructionminerals, indus-trialminerals,biomass,water,totalenergy,totalmaterials,fossil fuels, and electricity) (Saldivar-Sali, 2010; Ferrão & Fernández, 2013,Chapter 4).Our analysisuses the same set of cities and expandsthelarge-Nanalysisofurbanwaterissuesaselaboratedin thenextsection.
2. Dataandmethods
TheUrbanMetabolismdatasetincludes142citiesdistributed acrossmajorcontinentsandclimates.Wefocusedparsimoniously ontwovariablesintheUrbMetdatabase,addedawaterbudget variable,andthenusedthemtoconstructaWaterUseandClimate Index(WUCI).Thesevariableswere:
1.Percapita water consumption (CONS), toassess thescale of urbanwateruse.
2.Population(POP),toassessthepotentialsignificanceofcitysize. 3.Netannualclimaticwaterbudget(DIFF),toassesshydroclimatic
watersupplies.
4.WaterUseandClimateIndex(WUCI),toprovideameasureof urbanwaterusepercapitaindexedtoannualprecipitation.
Themain watervariableintheUrbMetdatasetis percapita wateruseincubicmetersperyear(m3/cap/year)(Table1).This valuewasdrawninmostcasesfromtheWorldBank-supported International Benchmarking Network (IBNET)supplemented by city-specificdatawhennotavailableinIBNET(Saldivar-Sali,2010; IBNET,2015).ThedefinitionofpercapitawateruseinIBNETis grossannualwaterproduction bya utilitydividedbythe num-berofpeopleintheservicearea.Percapitawateruserangedfrom 14m3/cap/year(Yangon)to355m3/cap/year (Cairo).Wedidnot disaggregatepercapitauseintoresidentialandcommercial sub-sectors,thoughthatwouldbeavaluableextensionofthisresearch. Climaticwaterbalanceanalysiswasemployedtoestimategross annual water supplies, usingthe University of Delaware’s 0.5◦ gridWebWIMP1tool(Willmottetal.,1985).TheannualDifference
(DIFF)betweenPrecipitationandPotentialEvapotranspiration,in meters peryear (m/yr),for each of the 142cities wasscraped fromthedatabase.The 0.5◦ resolution wascoarse,butdeemed appropriateforindexingthewaterbalanceofmajorurbanareas, whichgenerallyoccupyanddrawuponlargercatchmentareas out-side theiradministrativeboundaries. Citiesinthedatabasehad DIFFvaluesrangingfrom−1.446m/yr(AbuDhabi)to+3.833m/yr (Anchorage).
City population data (POP) from the UrbMet database was includedtoassessthepotentialdifferencethatcitysizemakesfor classifyingpatternsofurbanwatersupplyanddemand.Population sizerangesfrom270,000(BandarSeriBegawan)to14.34million (Shanghai).Thesepopulationestimatesfromtheearly2000sare conservativelybasedoncityboundariesvis-à-vislarger metropoli-tanregions.
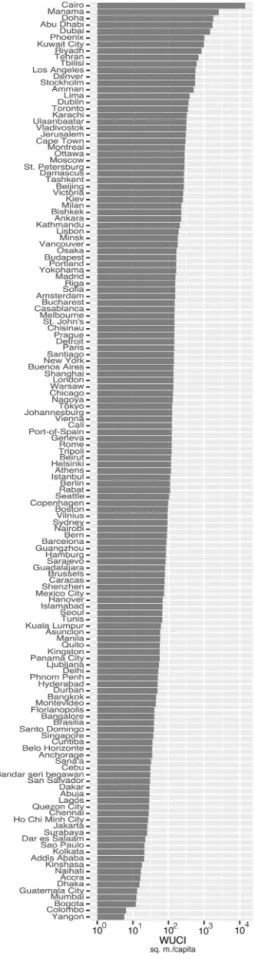
The aforementioned WebWIMP tool also provided average annualprecipitationdata(PREC)inmetersperyearforeachcity. PREC2wasusedtocalculateWaterUseandClimateIndex(WUCI),
whichhadunitsofm2/capita: WUCI =CONS/PREC
WUCIwasnotincludedasametricintheclusteranalysis,butwas usedinvisualizingtheresults.
Severalmethodswereusedtovisualizeindividualurbanwater variables andrelationshipsamongthem.Priortoclustering,we exploredthedatausingqq-normalplots,histograms,and scatter-plots.Wefirstplotteddataforeachmetriconabarchartwherethe citiesaresortedaccordingtotheirvalueforthatmetric(Fig.2a–c). Fig.2aandbhaveasimilardistributionofpositivevalues,witha longertailofsmallercitiesinFig.2aandamoreevenprogression ofwaterconsumptionvaluesinFig.2b.Incontrast,Fig.2cincludes negativeaswellasescalatingpositivevaluesfornetannualwater balance(Fig.3).
Priortoclustering,thesevariables weretransformedusinga base-10logarithmictransformation(log10),whichreduced skew-nessandimprovedthesymmetryoftheirdistribution(Fig.4aand
1WebWIMPisshortforthe“Web-based,Water-Budget,Interactive,Modeling
Program”andisavailablethroughtheUniversityofDelawareat:http://climate. geog.udel.edu/∼wimp/.
2PRECwasusedinsteadofDIFFincalculatingWUCI,sinceDIFFhadvaluesclose
tozeroandthereforecouldnotbeusedinthedenominator.However,PRECwas highlycorrelatedtoDIFF.
Fig.1.Worldmapofthe142citiesintheUrbMetdatabase.
Table1
DescriptivestatisticsforCONS,DIFF,POP,andWUCIfortheUrbMetdatabase.
Metric Unit QuartileBreak
0% 25% 50% 75% 100% Mean St.Dev.
CONS m3/cap/year 14.0 57.3 86.5 148.5 355.0 110.8 75.2
DIFF m./year −1.446 −0.241 0.089 0.447 3.833 0.124 0.752
POP millions 0.0273 0.647 1.649 3.764 14.350 2.883 3.182
WUCI m2/cap 5.717 49.04 117.9 189.1 14200.0 303.7 1223.0
b).Aconstant,a,wasaddedtoDIFFpriortothetransformsuchthat a=1−DIFFmin(whereDIFFminwastheminimumvalueofDIFF).
Whileitmightbeexpectedtofindcorrelationbetweenthesize ofthe populationorwater consumption and local water avail-ability(i.e.,DIFF),thecorrelationwasfoundtobelow.Asseenin Table2,thervalueforlog10(CONS)vs.log10(DIFF+a)wasfound tobe0.02withasignificancelevelofp=0.8373,whilethervalue for log10(POP) vs. log10(DIFF+a) wasfound tobe 0.01 with a p=0.9261.Inotherwords,thelog10transformsofCONSandDIFF werefoundtobeindependent,aswerethelog10transformsof DIFFandPOP.Asmallnegativecorrelationofr=−0.12wasfound betweenlog10(CONS) vs. log10(POP),but the significance level wasonly0.1684.Inotherwords,thesethreevariablesseemtobe independentofeachother,justifyinganexploratorydata-mining approachtothedata.
2.1. Clusteranalysismethods
Clusteranalysisis usedin exploratorydataminingtogroup objects in a dataset in such a way that those within a group aremoresimilartoeach otherthantoobjectsin othergroups. Commonclusteringapproachesincludehierarchicalclustering, k-meansclustering, and model-based clustering. For purposes of
exploringthesedata,hierarchicalclusteringwaschosen.Weused t-DistributedStochastic Neighbor Embeddingto reduce dimen-sionalityinthedataforvisualizationandclustering(vanderMaaten &Hinton,2008).Afterthelog10transformationeachmetricwas scaledtounity.Adistancematrixwasthencalculatedusingthedist functionfromthestatslibraryinRandtheEuclideandistance for-mulainwhich||a−b||2=SQRT(SUM(ai−bi)2).ThebasicEuclidean distanceformulawasusedastherewerenotheoreticalreasonsto preferamorecomplexformula,andotherformulasdidnotproduce substantiallydifferentormoreinterestingresults.These visualiza-tionmethodsarebrieflydescribedbelowanddisplayedasFigs.6–8 intheresultssection.
2.1.1. t-DistributedStochasticNeighborEmbeddingin scatterplots
The t-SNE method for reducing dimensionality enhances visualization in scatterplots by iterativelyassigning each high-dimensionalobject to a point in a two-dimensional space.The pointsareassignedsuchthatneighborsaremoresimilartoeach otherthantodistantobjects.Inatwo-dimensionalvariablespace, thehumaneyecantosomeextentdistinguishclusteredgroups of observations fromone another. As dimensionalityincreases, thetaskbecomessubstantiallymoredifficultandlessintuitive.In
Fig.2. Population(millions),percapitawaterconsumption(cu.m./cap/year),andannualdifference(calculatedasthedifference(DIFF)betweenprecipitationandpotential evapotranspirationinm/year).
reducingdimensionality,thet-SNEapproachenablesobservations tobevisualizedinawaythatismoreintuitivetothehumaneye.
Thedistancematrixproducedbydistwasusedasthe dissimilar-itymatrixgivenastheargumenttot-SNE(t-DistributedStochastic NeighborEmbedding).t-SNEproducedtwo vectorscontainingthe
coordinatesembeddingeach citywithinthet-SNEspace.These vectorswerethen scaledtounityandaseconddistancematrix wasconstructedfromthesedata.Thisseconddistancematrixwas thenpassedasanargumenttothehierarchicalclusteringalgorithm hclust,whichtakesanagglomerativeapproachtohierarchical
clus-Fig.3. Wateruseandclimateindexinm2/capita(WUCI=CONS/PREC).
Table2
Pearson’scorrelationcoefficientandsignificanceofbase-10logarithmic transfor-mationsofaverageannualpercapitawaterconsumption(CONS),averageannual difference(DIFF),andpopulation(POP).
Metric log10(CONS) log10(DIFF+a) log10(POP) log10(CONS) 1.00 0.02,p=0.8373 −0.12,p=0.1684
log10(DIFF+a) 1.00 0.01,p=0.9261
log10(POP) 1.00
tering. Each observation starts in its own cluster, and pairs of clustersarejoinedateachiterativestep.Ateachiterativestep,the
hclustgroupsarecomparedbasedonalinkagecriterion.Several commonlinkagecriteriaexist.WeusedWard’sminimumvariance method,whichminimizesthesquaredEuclideandistance.This cri-terionledtoadecreaseinvariancefortheclusterbeingmerged:at eachstep,thepairofclustersmergedisbasedontheoptimalvalue oftheerrorsumofsquares(dij=d({Xi},{Xj})=||Xi−Xj||2).
2.1.2. Dendrograms
Theresultsofhierarchicalclusteringwerealsovisualizedusinga tree-likestructureknownasadendrogram,whichrepresents rela-tionshipsofsimilarityamongsttheobservations.Thedendrogram ofclusterresultsshowsthestep-wisepairingofexisting subclus-ters.Eachbranchiscalleda“clade”andeachterminalnodeisa “leaf”.Thehorizontaldistanceofeachbranchindicatesameasure ofthedistancebetweenclades.Thedendrogramis“cut”toadesired heightornumberofclusterstodeterminethemembershipofeach leaf(i.e.,city).
2.1.3. Violinplots/boxplots
Theclusterresultswerealsoplottedasviolinplotswithboxplots superimposedoverthem.Theviolinplotisessentiallyaboxplot witharotatedkerneldensityplottedinsteadofabox.The box-plot(orbox-and-whiskerplot)depictsthemedianvalueofeach clusterasabandwithinthebox.Thetopandbottomofeachbox (the“hinges”)representthefirstandthirdquartiles.Boxplotsmay include“whiskers”—verticallinesextendingfromthetopsand bot-tomsoftheboxes.Thelengthofthewhiskersisdeterminedbythe inter-quartilerange(IQR),whereIQR=Q3−Q1:i.e.,thedifference betweenthethirdandfirstquartiles.Thewhiskersextendfrom eachhingetothevaluethatiswithin1.5*IQRofthehinge.Any valuebeyondthewhiskersisanoutlierandisplottedasapoint.
3. Clusteranalysisresults
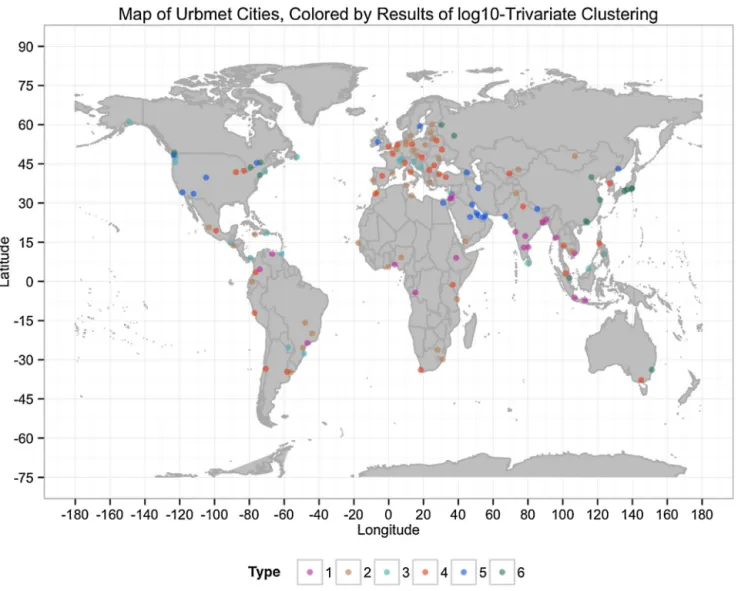
Theclusteranalysisyieldedinterestingresultsatseverallevels ofdivisionandgrouping.Weexaminedtheresultsfromtwotoeight clusters,andfoundthatsixclustersyieldedthemostvariedyetstill legibledifferenceswitheachofthefourvisualizationmethods.The typologygeneratedbythesixclustersispresentedanddiscussed here.TheworldmapinFig.5displayshowthesetypesappear spa-tially.Ithassomeclearpatterns,suchasEastAsian,SouthAsian, CentralAfricancities,andothermixed/gradientpatternsinEurope andNorthAmerica.However,ithastoomuchcomplexityto char-acterizefromvisualinspectionalone.
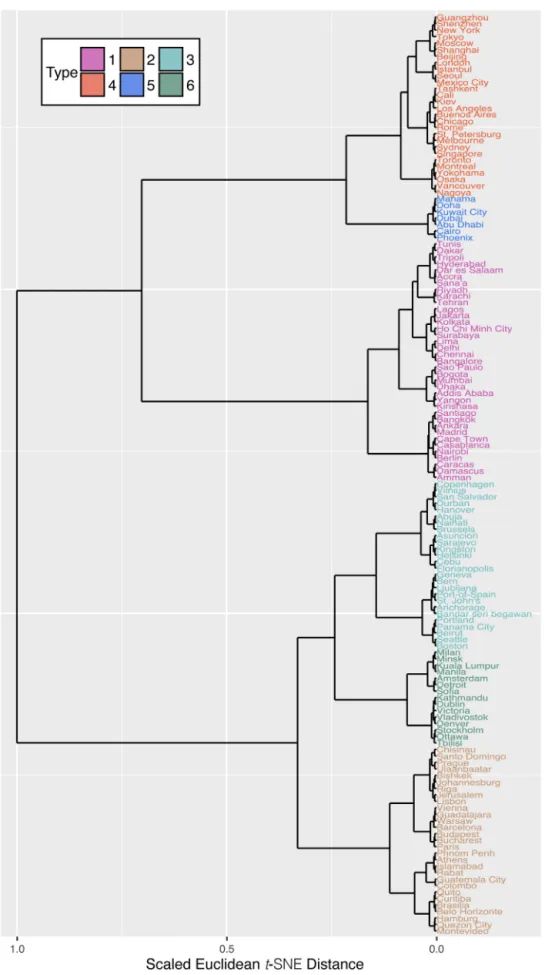
ThedendrograminFig.6depictsthepositionsofthe142cities acrossthefullrangeofclusters(i.e.,from1to142);citiesare col-oredbytheselectedsixcluster-typology.ThescatterplotinFig.7 depictsthecitiesinthetwo-dimensionalspaceproducedusing t-SNE,whichconveysmoreclearlytherelativesimilaritybetween citiesandclusters.
However,thesixclustersare mostreadilyinterpretedusing theviolinboxplotsshowninFig.8.Thesegraphicvisualizations madeitpossibletodiscernthesixurbanclustersinqualitativeand quantitativeterms.Table3usedthesefigurestodefinethegeneral
Fig.4. Histogramsforaverageannualpercapitawaterconsumption(CONS)(Fig.4a);andaverageannualdifference(DIFF)+a(aconstant)transformedbyabase-10logarithm (Fig.4b).
Fig.6. Dendrogramofclusterresults,withcitiescoloredbyclustermembership.
characteristicsofeachclusterandlistseveralrepresentativecities. Wenowrecasttheseresultsasaworkingtypologyofurbanwater sustainabilitysituations.Thedescriptionofeach “type”usesthe
terms“low”,“medium”,and“high”inquantitativeaswellas quali-tativeterms,astheyarebasedonthequartilebreaksandthresholds betweenclusters.
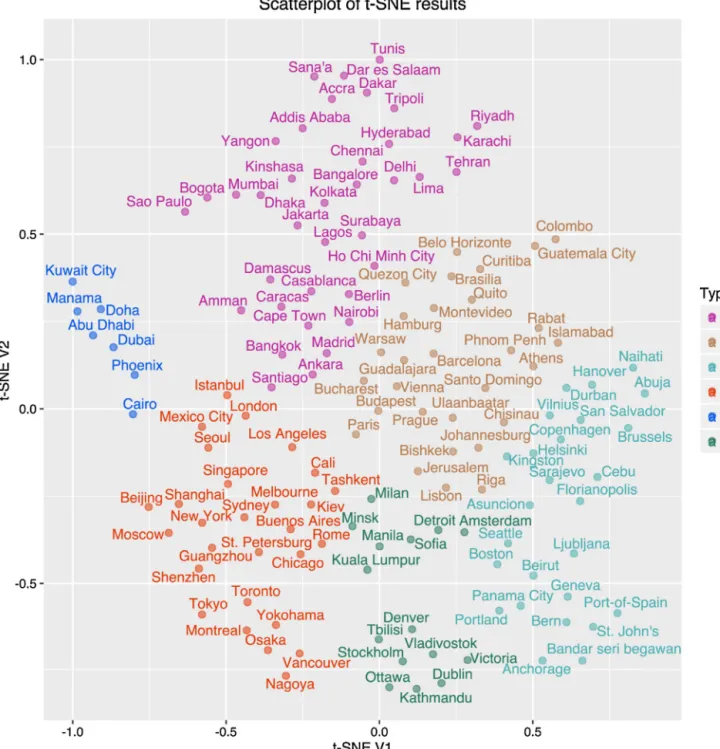
Fig.7. Scatterplotofcities,plottedinthetwo-dimensionalspaceproducedbyt-SNE.
3.1. Type1:largecitieswithverylowpercapitawater consumption
These cities representa range of climateand supply condi-tions, buttheirnetwater balancesare predominantlynegative. ThemedianvalueofPOPforType1citiesliesinthe3rdquartile. Type1citiesfallpredominantlybelowthemedianvalueforCONS, withamedianvalueof45.0m3/cap/year,whichiswithinthefirst quartile.3ThemedianvalueforDIFFforType1alsolieswithinthe
1stquartile,andtheboxforType1onDIFFlieswithinthe1stand 2ndquartiles.Inotherwords,Type1citiestendtohavenegative valuesforDIFF.Tosummarize,Type1citiestendtohavelarge
pop-3TheWHOrecommendsaround100L/cap/dayperperson(36.5m3/cap/year).
ulations,lownatural wateravailability,andverylow percapita waterconsumption,whichraisesconcernsabouttheir sustainabil-ityinhydroclimaticandsocio-economicterms.Type1citiesare mostdissimilarfromcitiesofType3and6,whicharesmallerand wetter.TheyshowsomeoverlapwithType2andType4cities.
3.2. Type2:medium-sizedcitieswithmedium-lowwater consumptionandanetwaterbalanceofaroundzero
Type2citieshavevaluesforPOPthatfallpredominantlyinthe 2ndquartile,withamedianvalueof1.188million;Type2cities tendtobemedium-lowtomedium-sized.Thesecitieshave the second-lowestmedianvalueforCONS,afterthoseofType1.Type 2citiesalsohavelowtomoderatewaterbalancesthat(DIFF).In summary,Type2citiestendtobemid-sizecitieswithanetwater
Fig.8. Violin-andbox-plotsforPOP,CONS,DIFF,andWUCI.
Table3
DescriptiveattributesofeachurbanwatersystemType.Thedesignations‘high’,‘medium’,and‘low’aremadewithreferencetothestatisticalquartiles(shownontheviolin plotsindashedlines)andtothethresholdsbetweentypes.
Type DIFF CONS POP WUCI RepresentativeCities
1 Rangefromlowtohighbut predominantlyverylowto low(negative).
Verylow Rangefrom
medium-lowtovery large
Rangefromlowto medium,but predominantlylow
Casablanca,Jakarta, Kinshasa,Lagos,Mumbai
2 Medium-low/Medium Medium-low Medium-sized Rangefromlowto
medium,but predominantlylow
Barcelona,Hamburg, Prague,Ulaanbaatar, Vienna
3 Rangefrommediumto high(positive)
Medium Generallysmaller Rangefromlowto
medium,but predominantlylow
Bern,Boston,Copenhagen, Geneva,Hanover 4 Rangefromlowtohigh;
predominantlymedium andpositive
Rangefrommedium-hightohigh Rangefrom medium-hightohigh; predominantlyhigh
Rangefromlowto medium,but predominantly medium
London,Montreal,New York,Singapore,Sydney
5 Verylow Veryhigh Rangefromverysmall
toverylarge
Rangefromlowto medium,but predominantly medium
Cairo,Doha,Dubai,Kuwait City,Phoenix
6 Medium;generallypositive Veryhigh Lowtomedium-low High Amsterdam,Denver,Kuala Lumpur,Milan,Stockholm
balanceclosetozero(i.e.,moderatewaterresources)and medium-lowwateruse,whicharecharacteristicsthatmaybesustainable. 3.3. Type3:smallcitieswithmediumlevelsofwater
consumptionandpositivenetwaterbalances
Thesecitiestendtobesmallrelativetotheothercitiesinthe dataset;theirmedianvalueisthelowestofanyofthesixcitytypes at494,700.NearlyallType3citiesfallwithinthe1stquartilefor POP.TheyhaveamedianvalueforCONSof84m3/cap/day.Type3
citieshavethehighestmedianvalueforDIFFofanyoftheother types,at0.417m/year,andmostType3citieshavevaluesforDIFF inthe3rdand4thquartiles.Inotherwords,Type3citiestendtobe small,withrelativelyhighnaturallyavailablewaterresourcesand mediumlevelsofwaterconsumption.Thesecitieshavethelowest WaterUseandConservationIndex(WUCI),andmightthereforebe deemedthemostsustainableintermsofuse(thoughnotinterms ofriskwhichisnotconsideredinthisanalysis).Type3citiesshow similaritieswithType2andType6;andtheyaremostdissimilar fromTypes1,4,and5.
3.4. Type4:verylargecitieswithhighpercapitawater consumptionandapositivenetwaterbalance
Type4citieshavelargepopulationswithamedianvalueof4.45 million.Type4citiesalsohavehighpercapitawateruse(CONS, withamedianvalueof154.5m3/cap/year,whichfallsinthe4th
quartile).AlmostallType4citiesareinthe3rdand4thquartiles forCONSandDIFF.Theyareverylargecitieswithlargenatural watersuppliesandhighdemand,andtheythushavethepotential tobesustainable.
3.5. Type5:citiesofvariedsizewithveryhighpercapitawater consumptionlocatedinhighlyaridenvironments
Thesecitieshavethesecond-highestmedianvalueforCONS,at 209.0m3/cap/year;almostallofthesecitieshaveCONSthatfalls
withinthe4thquartile.However,Type5hasthelowestDIFFofany ofthetypes,withamedianvalueof−1.36m/yearandamaximum valueof−0.916m/year.ThePOPofType5citiesrangesfromthe smallesttothelargest:from32,400to6.759million.Tosummarize, Type5citieshaveawiderangeofpopulationsize,andtheyare characterizedbyhighwateruseandverylowwaterbudgets.This patternraisesseriousconcernsabouttheirsustainability.
3.6. Type6:medium-sizedcitieswithveryhighpercapitawater consumptionandlowpositivewaterbalance
Thesecitiestendtobemedium-sizedcities,withhighpercapita waterconsumptionandlow,positivewaterbalances.Theyareone ofthemostrapidlygrowingformsofurbanizationindeveloping countries,andthispatternraisesconcernsabouttheir sustainabil-ity.Type6citiesaremostsimilartoType1,Type2,andType3cities. TheyaremostdissimilarfromType1andType5cities,especially intermsofDIFF.
4. Discussion
4.1. Discussionoftypes
4.1.1. Thelargecities:verylowvs.highCONS(Types1&4)
Thelargestcities,withfewexceptions,appear inType1and Type4.ThemaindistinctionbetweenType1andType4isthatType 1citieshaveverylowCONSwhileType4citieshavehighCONS.As wouldbeexpected,Type1citieshaveaWUCIthatismuchlower thanthatofType4cities.However,Type1citiestendtohavealow
DIFF,andthismeansthattheWUCIofType1citiesismoresimilar tothatofType2andType3citiesthanitwouldbeotherwise.
Thehighpercapitawater consumption exhibitedbyType4 citiessuggeststhatthesecitiescurrentlyhavesufficientwater sup-plyandurbanwaterinfrastructure.Type4citiesalsotendtobe locatedinareaswithhighernaturalwateravailabilitythanseveral othercitytypes,suchasType1.However,becausethe popula-tionofType4citiestendstobesolargeandconsumptionisso high,thesecitieslikelyfacemanychallengesinsecuringsufficient watersupplynowandinthefuture.Thisisindeedwhatwefind. Evencitieswithabundantnaturalresources,suchasSingaporeand NewYork,haverecentlymadesubstantialinvestmentsin promot-ingwaterconservationandininnovativewaterinfrastructure(e.g., desalinationandreclamation).
BothType1andType4citiesarelikelytohavechallengesin obtainingsufficientwaterresourcesfortheirlargeurban popula-tions.However,differencesexistbetweenthesetwotypes.Many Type1 cities arelocated indeveloping countries and undergo-ingrapidurbanization.Theirwaterresourceschallengesmaybe heightenedbylownaturalwateravailability,rapidurbanization, andlowaccesstofinancialresources.Thelowwaterconsumption inthesecitiesmayalsobeassociatedwithrelativelylowlevelsof infrastructure.EventhoughType1citiescurrentlyconsumeless waterthanType4cities,itwouldnotnecessarilybeappropriateto saytheyare“moresustainable”thanType4cities.IfType4cities areabletomanageresourceswithintheirwatershedareas prop-erly,theymaybeassustainablerelativetotheirwatersupplyas Type1cities.AsType1citiescontinuetogrowanddevelop,sotoo willthesizeoftheircatchmentareas;Type1citiesmayeventually becomeType4cities.
Type1citieshavetheopportunitytoimplementnewtypesof technologiesand pioneeringwater managementpractices, such asmoredecentralized,neighborhoodlevelwater treatmentand reuse,ratherthantryingtocopythedevelopmentofwatersupplies inType4cities.ThiswouldbeanexcellentopportunityforType1 citiestocollaboratewithType4citiesforknowledgeexchange. 4.1.2. Thesmall,wetcities(Type3)
Type3citiesarecharacterizedbylowpopulationsthathave low-tomedium-levelsofpercapitawaterconsumptionand medium-tohigh-naturalwatersupply.Thesecitiesarelikelytohavethe fewestissueswithsustainablewatersupplyofanyofthetypes. WatersupplystressesmaybelessacuteforType3cities.However, inspiteofrelativelylowCONSandabundantwaterresources,many ofthecitiesinType3stillfacechallengeswithsustainableurban watermanagement.Thesemayincludechangesinwaterquality duetourbanization,aginginfrastructure,andflooding.
4.1.3. Themedium-sizedcities:mediumvs.highCONS(Types2& 6)
Withafewexceptions,medium-sizedcities(thoseinthe2nd and3rdquartilesofPOP)tendtofallintoTypes2and6.Type6 citieshavehighernaturallyavailablewaterresources.Another dis-tinctionbetweenthetwotypesisthatType6citieshaveveryhigh CONS,whichraisesconcernsabouttheirsustainability,whilethose ofType2havemedium-lowCONS.
4.1.4. Thearidcities:lowDIFF(Type5)
Type5citieswerelocatedinhighlyaridenvironments:these cities had negative values of DIFF, which means that there is muchlessrainfallthanpotentialevapotranspiration.Yet surpris-inglythesecitieswerealsodistinguishedbytheirhighlevelsof waterconsumption(CONS).Thesecitiesarethereforelikelytorely extensivelyonwatertransfersorwaterimportsforwatersupply, eitherasriversorcanals(e.g.,CairoandPhoenix),conversionof saltwatertofreshwater(e.g.,DubaiandAbuDhabi),andminingof
fossilaquifers.Transportingwateroverlargedistances, desalina-tion,andreclamationareallassociatedwithrelativelylargecosts and issues of financialsustainability and management capacity (Plappally&Lienhard,2012;Plappally&Lienhard,2013).Thewater resourcesforcitiesinType5areparticularlyvulnerableto eco-nomicshocks,energyshortages,andpoliticalchanges(sincethey maybeobtainingwaterfromoutsidetheirjurisdiction).Cost recov-eryandconservationmayhelpType5citiesincreasetheresilience oftheirurbanwatersystemstoclimatechangeandexternal pres-suresonwatersupplies.
4.2. Discussionofthresholds
ThethresholdsforDIFFsuggestthatcitiesinregionswith nat-urallyabundantwaterresourcesmaybefundamentallydifferent fromthoseinmorearidcontexts.Types3,4,and6predominantly havevaluesforDIFFgreaterthanzero,whichsuggeststhat,allother thingsbeingequal,thesecitiesmayhaverelativelymoreeaseat obtainingwaterresourcesthantheothertypes.
ThethresholdsforPOPraiseintriguingquestions.Arethere sig-nificantdifferencesinprovidingurbanwaterresourcesforcities largerthan1million?Types1and4tendtobethelargestcitiesin thedatabase,butthesetwotypesdifferinCONSandDIFF.Cities ofType1haveverylowCONSandlowDIFF,whilethoseofType4 havehighCONSandapositiveDIFF.Thissuggeststhatcitysizeis notdeterministicallyrelatedtoclimateorconsumption.
4.3. Discussionofoutliersandoverlaps
Itisimportanttorememberthatthesetypesarebasedonthe statisticalclusteringofcontinuousvariables.Citieswithinatypeare mostlikelytobemoresimilartoeachotherthantoothercities,and distinctfromothertypesinsomestatisticallysignificantway.The differenttypesofcitiesidentifiedintheclusteringwererelatively distinctononeortwovariablesbutmayhaveotherwiseoverlapped withanothertypeonanother.Becauseofthis,citieswith differ-entmembershipmayhavesimilarmetricsandthereforefacesome commonsustainabilitychallenges.Forinstance,CairoandParisare membersofType5andType2,respectively,andduetotheir rela-tivesizesarelikelytosharesimilarchallengeswithcitiesofType1 andType4,respectively.
TheseoverlapsanddistinctionscanbeunderstoodfromFig.7, thescatterplotofthet-SNEresults,inwhichthecitiesthatfallclose tooneanotheraremostsimilar,whilethosethatarefurtherapart aremostdissimilar.Twocitiesthatlieinatransitionzonebetween adjacenttypesmaybehavedifferenttypologicalmembershipbut bestatisticallysimilartoeach other. Withinthe variablespace showninFig.7,itisalsopossibletovisuallyidentifysub-groupings. AsubgroupingofDenver,Tbilisi,Vladivostock,Victoria,Stockholm, Dublin,Ottowa,andKathmanducanalsobeidentifiedinthe den-drogram.Withinthissubgroupingtherearenon-intuitivepairings intheterminalleafnodes,suchasKathmanduwithDublinand VladivostockwithDenver,whichmayidentifyunexpected simi-larities.
4.4. Discussionofintuitiveandunexpectedresults
Someof these results are surprising while others are more expected.Forinstance,itisnotmuchofasurprisethatcitiesinvery aridclimatesweregroupedtogether.However,priorto applica-tionoftheclusteringalgorithmthiswasnotaforegoneconclusion, andtheresultsdistinguishedsignificantdifferencesinwater con-sumptionofaridcities.Thishighlightstheabilityoftheapproach toyieldmeaningfulresults.Itisperhapsalsonotmuchofa sur-prisethatthelargestcitiesweregroupedtogether,astheywerein Type1andinType4.Atthesametime,somemayfindit
surpris-ingtoseeLondon,LosAngeles,Singapore,Sydney,andNewYork togetherinaclusterinlightoftheirclimaticdifferences.However, examinationofcontemporarywaterissuesinthesecitiessupports thisgrouping.Allofthesecitieshavereachedasizewherewater isimportedfromlongdistancesanddesalinationhasbeenatleast consideredifnotimplemented;allofthesecitieshaveissueswith waterqualityandstormwaterrunoff.Watersustainabilityplans forthesecitiesmaythusbeexpectedtohavesomesimilarities. It mightalsohave beenexpectedthat large, rapidlyurbanizing citiesindevelopingcountrieswouldbegroupedtogether,asthey wereinType1.Forinstance,itmighthavebeenpossibletoidentify SãoPauloandMumbaiashavingsimilarchallengesinmeetingthe demandsoftheirburgeoningpopulations,butwearenotawareof previousresearchthathascomparedtheseurbanwatersystems.It isnotablethatthismeaningfulpairing,andothers,wereidentified througharelativelysimplecombinationofmetrics,withrelatively widelyavailabledata,usingaveryscalablemethod.
Theresultsalsoidentifiedmoresurprisinginternational group-ings.ConsiderthesubgroupingofHanover,Durban,Copenhagen, Vilnius,andSanSalvadorinType3.Whileitisperhapsless sur-prisingthat Copenhagen,Hanover,and Vilniusare similar,it is surprisingtoincludeDurbanandevenmoresoSanSalvadorwith those three.Yetupon examiningthescatterplots ofthese mid-rangevaluesonmostvariables,itmakessensewhythesecities were clustered. The identification of such sub-groups demon-stratestheutilityofapplyingquantitativedata-miningalgorithms touncoversignificantandintriguingpatternsofcitiesaroundthe world.
5. Conclusionsandfuturework
Ourresultsprovideaninitialanswertothequestion—how sim-ilarandhowdifferentarecitiesintermsoftheirwaterresource supplyand usagepatterns?One ofthemainaimsof thisstudy wastousesimplemetricsforwatersupplyanddemandto iden-tifygroupsofsimilaranddifferentcities.Usingstatisticalclustering identifiedsixmeaningfulclustersofurbanwatersustainability con-ditions.Werecasttheseclustersasatypology,andindicatedhow ourresultscanbeusedforstratifiedsamplingofsmallernumbers ofcasesformorefine-grainedcontextualandcomparative inter-nationalwaterresearch.
Ourworkalsoprovidesacontextforassessingwater manage-mentchallengesand policyalternativesina meaningfulway.It identifiedbothexpectedandsurprisingpairingsandgroupingsof citiesthatcanbeexploredthroughfurthercomparativeanalysis insmall-Normedium-Nstudies.Forinstance,thetypology identi-fiedunanticipatedsimilarities,mostnotablyamongcasesofcities thatconsumedfarmorethantheirlocalsupply,evenwhenthose suppliesvariedfromaridtohumid.
Our results primarily demonstrate the utility of statistical clusteringof a small number of metricsto supportmeaningful internationalcomparisonofcities.Therelevanceofthistypology toagenda-settingandpolicy-makingforsustainabilitydependson theassertionthatcitiesaremorelikelytosharesimilar sustain-abilitychallengeswithothercitiesthathavesimilarsupplyand demandmetrics.Whilewebelievethatcitieswithinatype,or adja-centtoeachotherinFig.7,aremorelikelytosharesimilarissuesin urbanwaterresourcemanagement,therelativeproximityor dis-similarityoftwocitiesalonecannotdeterminewhetherthemost pressingwaterresourceandmanagementchallengesthesecities faceare,infact,similar.Furtherworkthatlinkssmall-N,medium-N, andlarge-Nscalesofcomparativeanalysismustbedonetouncover morenuancedpredictiverelationshipsbetweenwatersupplyand demandmetricsandsustainabilityissues.
Thethresholdsinourresultsprovideabasisforposingquestions withtestablehypotheses.ThethresholdsforPOP,CONS,andDIFF areintriguing,butwhethertheyareinfactmeaningfulrequires furtherstudy.Forinstance,thelevelsforthesethresholdsor typo-logicalmembershipofparticularcitiesmaychangeifthedatabase ofcitiesisexpandedoriftheclusteringisrepeatedonthesameset ofcitiesatadifferentpointintime.Hopefully,astimeprogresses wemightseetheemergenceofnewtypes,suchasthatoflarge, affluentcitieswithlowwateruse.
Anextstep in thisanalysis wouldbetoexamine the sensi-tivityoftheclusteringtotheunderlyingdataset.Thereareother opportunitiesfornextstepsintheanalysis.High-priority exten-sionsofthisanalysisareexpandingthesetofcitiesandintegrating additionalmetrics,suchasawater qualityvariable,partitioning waterconsumptionintomunicipalandindustrialcomponents,and addingmetricsassociated withmore socio-economicaspectsof watermanagement,includingGDPorhouseholdincome. Includ-ingdataonthefinancial,energy,material,andlanduseintensity ofurbanwatersupplycouldprovideinsightintotheurban water-land-energynexus.Thedatasetcouldalsobeaugmentedbythe inclusionofperformanceindicatorssuchasleakageratesandcost recoveryratesincludedindatabases suchasIBNET. Thiswould allowforamorerefinedapproachtoidentifyingtypesofwater sys-temsandtargetareastoenhancethesustainabilityofurbanwater management.
Anotherattractivestepwouldbetoincludespatialand tem-poralvariationsintheunderlyingdata.Forinstance,theclimate metric couldbedisaggregated toamonthly waterbudget.This wouldallowfordistinctionstobemadeamongcitieswithlarge intra-annualvariationintheirwaterbudgets,sincethisvariation canhaveimportantimplicationsforwaterstorage,management, andreuse.Expandingthedatasettoincludemultipleyearsofdata forcitiesmightallowforidentificationoftypesbasedonvariability andtrends—forinstance,citiesthathaveincreasingordecreasing percapitawateruse(CONS).
Insummary,weappliedstatisticaldata-miningtechniquesto develop aninitialurbanwater typology basedoncity size,per capitawater consumption, and netannual water balance.This typologyisanimportantfirststepincharacterizingurbanwater supply and demand patterns around theworld and will facili-tatetransferofknowledgeandmeaningfulcasestudyresearchto furtherourunderstandingofsustainableurbanwaterresources management. We demonstrated that statistical clustering is a useful method for developing a quantitative basis for small-N and large-N comparative urban water management case study research.Thetypology presentedhereis asignificant contribu-tiontothiseffort,butitisonlyastart.Itwillbenefitfromfuture casestudyresearch,standardizationofdata,expansionofmetrics toconsidertemporalandspatialvariation,disaggregationofwater consumptionandnetannualwaterbalancedata,andtheinclusion ofmorecities.
Acknowledgements
Thisresearchwasmadepossiblewithgenerousfundingfrom the Rambøll Foundation and Liveable Cities Lab for a research projectonEnhancing Blue-GreenInfrastructureand Social Per-formanceinHighDensityUrbanEnvironments(2014–2016).We thankRicharddeNeufville,anonymousreviewers,andtheeditors forhelpfulfeedback.
AppendixA. Supplementarydata
Supplementarydataassociatedwiththisarticlecanbefound,in theonlineversion,athttp://dx.doi.org/10.1016/j.scs.2016.06.003.
References
Astel,A.,Tsakovski,S.,Barbieri,P.,&Simeonov,V.(2007).Comparisonof self-organizingmapsclassificationapproachwithclusterandprincipal componentsanalysisforlargeenvironmentaldatasets.WaterResearch,41(19), 4566–4578.
Batty,M.,Axhausen,K.W.,Giannotti,F.,Pozdnoukhov,A.,Bazzani,A.,Wachowicz, M.,etal.(2012).Smartcitiesofthefuture.TheEuropeanPhysicalJournal: SpecialTopics,214(1),481–518.
Bettencourt,L.(2013).Theoriginsofscalingincities.Science,340(6139), 1438–1441.
Candelieri,A.,&Archetti,F.(2014).Identifyingtypicalurbanwaterdemand patternsforareliableshort-termforecasting—theICeWaterprojectapproach, 16thConferenceonWaterDistributionSystemAnalysis.ProcediaEngineering, 89,1004–1012.
Chertow,M.R.(2001).TheIPATequationanditsvariants.JournalofIndustrial Ecology,4(4),13–29.
Daniels,P.L.,Lenzen,M.,&Kenway,S.J.(2011).Theinsandoutsofwateruse—a reviewofmulti-regioninput-outputanalysisandwaterfootprintsforregional sustainabilityanalysisandpolicy.EconomicSystemsResearch,23(4),353–370.
Diao,K.,Farmani,R.,Fu,G.,Astaraie-Imani,M.,Ward,S.,&Butler,D.(2014).
Clusteringanalysisofwaterdistributionsystems:identifyingcritical componentsandcommunityimpacts.WaterScience&Technology,70(11), 1764–1773.
Ercin,A.E.,Aldaya,M.M.,&Hoekstra,A.Y.(2011).Corporatewaterfootprint accountingandimpactassessment:thecaseofthewaterfootprintofa sugar-containingcarbonatedbeverage.WaterResourcesManagement,24, 721–741.
Ferrão,P.,&Fernández,J.(2013).Urbantypologies:prospectsandindicators.In SustainableUrbanMetabolism.Cambridge,MA:TheMITPress(Chapter7)
Fletcher,T.,&Deletic,A.(Eds.).(2008).Datarequirementsforintegratedurbanwater management:urbanwaterseries-UNESCO-IHP(Vol.1).Paris,France:CRCPress.
Gandy,M.(2014).Thefabricofspace:water,modernity,andtheurbanimagination. Cambridge,MA:TheMITPress.
Garg,V.(2007).Forecastingthewaterdemandusingregressionandclusteranalysis forSaltLakeCity.Mastersthesis.UtahStateUniversity.
Hoekstra,A.Y.,&Chapagain,A.K.(2007).Waterfootprintsofnations:wateruseby peopleasafunctionoftheirconsumptionpattern.WaterResources
Management,21(1),35–48.
Hoff,H.,Döll,P.,Fader,M.,Gerten,D.,Hauser,S.,&Siebert,S.(2014).Water footprintsofcitiesöindicatorsforsustainableconsumptionandproduction. HydrologyandEarthSystemSciences,18,213–226.
IBNET.(2015).IB-NETDatabase.https://database.ib-net.org/Accessed28.01.16 Kennedy,E.H.(2011).Reclaimingconsumption:sustainability,socialnetworks,and
urbancontext.Doctoraldissertation.RuralSociology,UniversityofAlberta.
Khamis,A.(2012).Developingatypologyofurbanresourceconsumption.In1st CivilandEnvironmentalEngineeringStudentConference.
Kim,J.-S.(1997).ThedifferentiationofSouthKoreancities:amultivariateanalysis. Master’sthesis.DepartmentofGeography,TheUniversityofCalgary.
Konar,M.,Dalin,C.,Hanasaki,N.,Rinaldo,A.,&Rodriguez-Iturbe,I.(2012).
Temporaldynamicsofblueandgreenvirtualwatertradenetworks.Water ResourcesResearch,48,W07509.
MacCannell,E.H.(1957).Anapplicationofurbantypologybyclusteranalysistothe ecologyoftenAmericancities.Doctoraldissertation.UniversityofWashington.
Mayer,A.,Winkler,R.,&Fry,L.(2014).Classificationofwatershedsintointegrated socialandbiophysicalindicatorswithclusteringanalysis.EcologicalIndicators, 45,340–349.
McDonald,R.I.,Weber,K.,Padowski,J.,Flörke,M.,Schneider,C.,Green,P.A.,etal. (2014).Wateronanurbanplanet:urbanizationandthereachofurbanwater infrastructure.GlobalEnvironmentalChange,27(2014),96–105.
Mollinga,P.,&Gondhalekar,D.(2014).Findingstructureindiversity:astepwise small-N/medium-Nqualitativecomparativeanalysisapproachforwater resourcesmanagementresearch.WaterAlternatives,7(1),178–198.
Novotny,V.,Ahern,J.,&Brown,P.(2010).Watercentricsustainablecommunities: planning,retrofittingandbuildingthenexturbanenvironment.NewYork,NY: Wiley.
Plappally,A.K.,&Lienhard,J.H.(2012).Energyrequirementsforwaterproduction, treatment,enduse,reclamation,anddisposal.RenewableandSustainable EnergyReviews,16,4818–4848.
Plappally,A.K.,&Lienhard,J.H.(2013).Costsforwatersupply,treatment,end-use andreclamation.DesalinationandWaterTreatment,41(1–3),200–232.
Rahill-Marier,B.,&Lall,U.(2013).America’swater:anexploratoryanalysisof municipalwatersurveydata.Whitepaper.NewYork:ColumbiaWaterCenter, EarthInstitute,ColumbiaUniversity.http://water.columbia.edu/2013/10/16/ americas-water-an-exploratory-analysis-of-municipal-water-survey-data/
Accessed14.12.15
Rao,A.R.,&Srinivas,V.V.(2008a).Regionalizationbyhybridclusteranalysis.In RegionalizationofWatersheds.pp.17–55.Dordrecht,Netherlands:Springer (Chapter2).
Rao,A.R.,&Srinivas,V.V.(2008b).Regionalizationbyfuzzyclusteranalysis.In RegionalizationofWatersheds.pp.57–111.Dordrecht,Netherlands:Springer (Chapter3).
Rosa,E.A.,York,R.,&Dietz,T.(2004).Trackingtheanthropogenicdriversof ecologicalimpact.Ambio,33(8),509–512.
Saldivar-Sali,A.N.D.(2010).Aglobaltypologyofcities:classificationtreeanalysisof urbanresourceconsumption.Master’sthesis.DepartmentofArchitecture,MIT.
Suweis,S.,Konar,M.,Dalin,C.,Hanasaki,N.,Rinaldo,A.,&Rodriguez-Iturbe,I. (2011).Structureandcontrolsoftheglobalvirtualwatertradenetwork. GeophysicalResearchLetters,38,L10403.
vanderMaaten,L.J.P.,&Hinton,G.E.(2008).Visualizinghigh-dimensionaldata usingt-SNE.JournalofMachineLearningResearch,9,2579–2605.
Wörlen,M.,Wanschura,B.,Dreiseitl,H.,Noiva,K.,Wescoat,J.,&Moldaschl,M. (Eds.).(2016).Enhancingblue-greeninfrastructureandsocialperformancein highdensityurbanenvironments:summarydocument.Uberlingen,Germany: RambollLiveableCitiesLab.
Wescoat,J.L.(2009).Comparativeinternationalwaterresearch.Journalof ContemporaryWaterResearch&Education,142,61–66.
Wescoat,J.L.(2014).Searchingforcomparativeinternationalwaterresearch: urbanandruralwaterconservationresearchinIndiaandtheUnitedStates. WaterAlternatives,7(1),199–219.
Willmott,C.J.,Rowe,C.M.,&Mintz,Y.(1985).Climatologyoftheterrestrial seasonalwatercycle?InternationalJournalofClimatology,5(6),589–606.
Wu,S.,Lv,M.,Dong,S.,Wang,J.,&Xu,H.(2012).Classificationcalculationonwater consumptionofurbanwatersupplynetworkbasedonclustering.In2012 WorldAutomatonCongress(pp.1–4).
Yu,N.,&Chen,R.(2010).Researchonthedevelopmentofurbaninfrastructurein Chinabasedonclusteranalysis.In2010InternationalConferenceon ManagementandServiceScience(pp.1–5).PublishedbyIEEE.
Yu,Y.,etal.(2013).ClusteranalysisforcharacterizationofrainfallsandCSO behavioursinanurbandrainageareaofTokyo.WaterScience&Technology, 68(3),544–551.