HAL Id: hal-01813283
https://hal.inria.fr/hal-01813283
Submitted on 12 Jun 2018
HAL is a multi-disciplinary open access
archive for the deposit and dissemination of
sci-entific research documents, whether they are
pub-lished or not. The documents may come from
L’archive ouverte pluridisciplinaire HAL, est
destinée au dépôt et à la diffusion de documents
scientifiques de niveau recherche, publiés ou non,
émanant des établissements d’enseignement et de
What if we use the ”What if” Approach for
Eco-Feedback? Designing an Electricity Consumption
Analysis for Layman Users
Jérémy Wambecke, Georges-Pierre Bonneau, Renaud Blanch, Romain Vergne
To cite this version:
Jérémy Wambecke, Georges-Pierre Bonneau, Renaud Blanch, Romain Vergne. What if we use the
”What if” Approach for Eco-Feedback? Designing an Electricity Consumption Analysis for Layman
Users. EnvirVis 2018 - Workshop on Visualisation in Environmental Sciences, Jun 2018, Brno, Czech
Republic. pp.1-8, �10.2312/envirvis.20181140�. �hal-01813283�
Workshop on Visualisation in Environmental Sciences (EnvirVis) (2018) R. Bujack and K. Rink and D. Zeckzer (Editors)
What if we use the "What if" Approach for Eco-Feedback?
Designing an Electricity Consumption Analysis for Layman Users
J. Wambecke1,2, G. P. Bonneau1, R. Blanch2, R. Vergne1
1Univ. Grenoble Alpes, CNRS, Inria, Grenoble INP, LJK, 38000 Grenoble, France 2Univ. Grenoble Alpes, LIG, F-38000 Grenoble France
Abstract
Many households share the objective of reducing electricity consumption for either economic or ecological motivations. Eco-feedback technologies support this objective by providing users with a visualization of their consumption. However as pointed out by several studies, users encounter difficulties in finding concrete actions to reduce their consumption. To overcome this limitation, we introduce in this paper Activelec, a system based on the visualization and interaction with user’s behavior rather than raw consumption data. The user’s behavior is modeled as the set of actions modifying the state of appliances over time. A key novelty of our solution is its focus on theWhat if approach applied to eco-feedback. Users can analyze and experiment scenarios by selecting and modifying their usage of electrical appliances over time and visualize the impact on the consumption. We conduct two user studies that evaluate the usability of Activelec and the relevance of theWhat if approach for electricity consumption. Our results show that users understand the interaction paradigm and can easily find relevant modifications in their usage of appliances. Moreover participants judge these changes of behavior would require little effort to be adopted. Therefore our work opens new perspectives on using theWhat if approach in the context of eco-feedback technology.
Keywords: (ACM 2012 CCS) Visualization systems and tools, Visualization design and evaluation methods, Empirical studies in visualization
1. Introduction
Reducing energy consumption is a major concern for many house-holds. They either want to lower their energy costs and/or are mo-tivated by environmental concerns such as the limitation of CO2
emission. In this paper we focus on domestic electricity, which is an important share of household energy consumption. Thanks to the development of sensors such as smart plugs, households can easily access and record their electricity consumption over time. Eco-feedback technologies show a visualization of their consump-tion to users with the aim of decreasing it. In this domain many so-lutions have been designed, either commercial systems or research prototypes. One of the main limitations of eco-feedback tools lies in the difficulty for users to find concrete actions to save energy. Several systems tackle this issue by providing context to the visu-alization and/or ways to interact with the data [CRJ12,ELK∗13]. However, interactivity is often limited and does not help users to find relevant modifications in the usage of appliances. As an ex-ample few systems provide the ability to visualize and manipulate usages of appliances along with raw consumption data.
In this paper we introduce Activelec, a visualization system that allows users to analyze and interact with their electricity consump-tion data. The design raconsump-tionale takes into account previous findings and limitations of eco-feedback technologies, since the design is
known to strongly influence users’ ability to save energy [PFL∗10]. The novelty of Activelec is the introduction of the What if approach applied to eco-feedback. Herein users can test scenarios in which they modify the usage of appliances over time and then evaluate the impact of these changes on the consumption. Our solution is based on a data model that represents the user’s behavior as a set of ac-tions modifying the state of appliances over time. To assess both the usability of the system and the relevance of the What if approach in the context of eco-feedback, we conduct two user studies based on real consumption data. Results show that users can find relevant and efficient appliance usage modifications, thereby validating the use of the What if approach for household electricity consumption feedback. To summarize we present the following contributions : • The design rationale for Activelec that justifies the use of the
What if approach in the context of eco-feedback, and especially the data model designed for this (Section3).
• The Activelec system in itself, which allows to analyze and test scenarios on consumption data (Section4).
• Two lab studies to assess the usability of the system and the rel-evance of the What if approach (Sections5and6).
Finally our paper opens new perspectives on the What if ap-proach in the context of eco-feedback discussed in Section7.
J. Wambecke & G. P. Bonneau & R. Blanch & R. Vergne / What if we use the "What if" Approach for Eco-Feedback?
2. Related Work 2.1. Eco-feedback
Eco-feedback technology aims at presenting to users a visualiza-tion of their energy consumpvisualiza-tion in order to decrease it. Studies have proven the efficiency of eco-feedback in reducing energy con-sumption from 5 to 13% [Dar06]. Even if there is no definitive ex-planations for this efficiency, Buchanan et al. [BRA14] suggests one main reason. Users learn about the consumption of appliances, the link with their behavior and the actions that can be applied to the appliances to save energy. However, many limitations that im-pact the effects of eco-feedback have been pointed out in the fore-mentioned surveys. The main bias in the design of eco-feedback systems is the assumption that visualizing energy consumption will directly lead to savings [Str11]. Such systems often lack interac-tion, reducing it to exploration of raw consumption data. Moreover, users encounter difficulties to come out with daily concrete actions that can be applied to reduce consumption [Bar15,ELK∗13,Str11]. Several works focus on the design and evaluation of visualiza-tion systems for electricity consumpvisualiza-tion. Erickson et al. [ELK∗13] developed the Dubuque Electricity Portal, a system allowing users to visualize their electricity consumption via an online portal. The contribution of this work is not the system itself, which presents a classical design. Rather it is the long term study with a large amount of participants, providing findings on eco-feebdack usage. We can also cite serious games dedicated to electricity consumption. This is the case of PowerHouse [BTK06] and PowerAgent [GKB10]. Both games are designed to acquire some knowledge about elec-tricity consumption in order to decrease it. They are not focused on visualization but are similar to our approach, since the users can test a given behavior and obtain a feedback on it.
2.2. The What if Approach
The What if approach is usually implemented for the analysis of event based systems whose outcome depends on multiple complex factors, such as financial systems or large distributed systems. For example, Tarik et al. [TBV∗13] developed WISE, a language de-signed to use the What if approach in the context of content dis-tribution networks. This system targets expert users, and is based on a language implementation of the What if approach. In com-parison, our system targets non-expert users and is based on inter-action. Badam et al. [BZS∗16] presented TimeFork, an interactive prediction technique for time series. The system allows users to interact with and guide multiple computational models predicting the future of multivariate time series, and thereby to test What if scenarios. In comparison, our system does not need computational models predicting the future. Users can experiment What if sce-narios by analyzing and changing past values through interactive selection and modification of appliances states.
Costanza et al. [CRJ12] presented Figure Energy, a system based on the visualization of household electricity consumption. They provide users with the ability to manually annotate their activities and to apply What if scenarios by removing them. The important difference with our system is that modifications are limited to re-moving user activities. More importantly the user activities are only
removed in another view which does not impact the temporal visu-alization. In comparison our system allows temporal selection of usages and modifications such as changing appliances states and duration of usage. In their visualization design method, Goodwin et al.[GDJ∗13] detailed Demand Horizon, a prototype that allows the consumption of appliances to be modified by directly sculpting the raw data. If their studies gave promising results, it is worth noting that the system was designed for energy analysts and modelers to elaborate scenarios directly on consumption data of multiple house-holds. In contrast, our system is designed for non-expert users with-out any assumption on their knowledge in energy consumption.
3. Design Rationale 3.1. System Description
During studies about eco-feedback systems, users often encounter difficulties to find concrete behavior changes to reduce their con-sumption [Str11,Bar15,ELK∗13]. Our system is designed to tackle this problem, since users visualize, interact and modify their usage of appliances instead of visualizing raw consumption data. First, users explore their data by visualizing their usage of appliances linked to their consumption. Then, they select actions on appliances via criteria, followed by a modification of the actions that have been selected. Once the modification is applied, the visualization is up-dated in a way that allows users to evaluate the impact of their sce-nario on the consumption. This interaction loop motivates users to engage their data by manipulating concrete actions on appliances, e.g.ecological washing versus normal washing for a dishwasher. Our system is a dashboard, i.e. a classical computer software that provides historical views of the data, allowing patterns and trends to be recognized [Str11,Bar15]. Hence it relates data to behavior using classical information visualization methods.
3.2. Strengths of the What if
The appliances and especially their consumption per usage vary among households. This implies that a modification in the usage of an appliance can lead to different gains. As an example, switching off the lights can lead to high or low gains depending on the ef-ficiency of the bulbs. Thus users need to have precise information about the outcome of behavior modifications instead of generic ad-vices such as “switch off the lights”. Another strength of our ap-proach is the ability to test repeated subtle modifications over time. A given change (e.g. boiling only the needed quantity of water in a kettle) can seem negligible but may lead to substantial gains if repeated every day. By allowing users to visualize the accumulated gain over time they become aware of the relevance of such modifi-cations.
The What if approach allows users to assess the ratio between gain and effort required to apply their modification into their every-day actions. It seems trivial to gain energy by reducing the usage of appliances, yet in practice, this is strongly dependent on exter-nal factors constraining our use of household devices. For example savings that could be achieved on the washing machine depend on the number and the ages of people in the household, as well as on temporal factors (e.g. possible day and hour of usage). It also de-pends on personal factors such as users’ motivation. These factors,
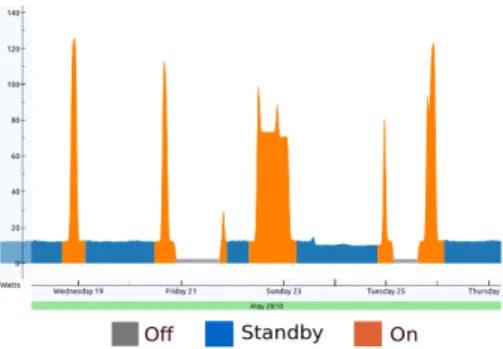
Figure 1: Data related to a computer with three states. Each state is associated to a unique color, which is used to depict its time intervals on the consumption curve of the appliance.
often neglected in eco-feedback [PFL∗10], cannot be known by the system. This supports the use of the What if approach which allows these factors to be analyzed individually.
The What if approach can also counteract another limitation of eco-feedback systems, which is the non-negotiability of everyday practices [Str11,PFL∗10]. In other terms it means that some appli-ances usages cannot be removed due to external constraints (e.g. so-cial constraints). For example, to stop using the washing machine is not conceivable since people want clean clothes. Our system al-lows usages to be both removed or modified. For example, users can switch the temperature of the washing machine from warm to cold, which can lead to a substantial gain.
3.3. Data Model
We designed a data model that decomposes appliances data be-tween consumption data and user’s actions data. In this model, the input is disaggregated energy data where each appliance is associ-ated to a temporal dataset. Consumption data represents the evo-lution of the instantaneous electric power of the appliances, and is measured directly or simulated when a modification is applied. Appliances are associated to states over time (e.g. Off, Standby and Onfor a Computer). At a given point in time the state of an ap-pliance thus depends on the action of the user. Therefore the states of the appliances allow to express the relationship between con-sumption data and users’ actions. We define an instance of a state as the time span during which the appliance remains in this state. Instances hence encode the evolution of the state of the appliance over time. The instances are automatically extracted in the system based on thresholds on instantaneous power and average consump-tion over time. Figure1shows an example of evolution over time of computer data according to this model.
4. System Design 4.1. User Interface
Our system is built on two modes: Appliances mode and Instances mode. Appliances mode (Figure2) displays the consumption of all appliances on the same plot, allowing users to explore and com-pare them. This mode gives to users an overview of the consump-tions of household appliances. From this mode, users can switch
to Instances mode (Figure3) to focus on a given appliance. In-stances modedisplays the consumption data and the usage of a single appliance and implements the What if approach. The units of energy such as kWh are often considered abstract by users and need to be converted into meaningful information [Str11]. Hence the amounts of energy consumed by appliances, contained in selec-tions or saved by modificaselec-tions are expressed in terms of cost aside with the kWh. Our system is also able to express the energy in en-vironmental units, such as pounds of emitted CO2, which makes
sense for users with environmental motivation [Bar15].
4.2. Visualization
To display the evolution of the consumption over time, we chose to use line charts, since it is a well known metaphor for continu-ous temporal data. They are also well suited for fluid interactions like continuous pan and zoom. Consumption curves are rendered and filtered in a screen-dependent manner [BM04]. That way, un-like most eco-feedback systems that aggregate the data at a fixed scale, the curves can be visualized at any zoom level and are al-ways smooth and coherent. In Instances mode the curve is colored according to the instances of the appliance. More precisely, the part below the curve is filled with the color of the current state. By using this representation, users can visualize the consumption along with the usage of the appliance. A multi-hue color scheme from Color-Brewer[Bre03] is used to assign colors to appliances and states.
4.3. Selection
In Instances mode, instances can be selected to obtain information on the usages or to modify them. The first way to create a selec-tion is to do it directly onto the visualizaselec-tion by clicking on the in-stances. It allows users to select particular instances that could not be selected with temporal criteria or to test a modification on a few instances. The second way to select instances is through the defi-nition of criteria on their properties. In its current implementation the system provides the possibility to select instances according to their state, duration, weekday, day hour and by frequency. For ex-ample, for a given appliance (e.g. a computer) users can select all the periods of Standby whose length is greater than one hour. It is also possible to combine criteria, such as selecting only one out of three instances from this selection on the computer. Once a criteria is modified, the set of selected instances is updated in real time, and these instances are highlighted on the curve. Defining criteria to se-lect instances extends the exploration step, since users can explore the space of criteria with real time feedback. It also allows to gen-eralize a pattern found during the exploration step, hence allowing habits to be easily visualized and modified.
4.4. Modification
After the selection of instances, the next step in the loop of the What ifis their modification. Our system provides two types of modifica-tions. The first one is changing the state of the instances, which is related to removing a usage of the appliance or modifying the way the appliance is used. For example, it is possible for users to switch the state of instances of a washing machine from warm washing to cold washing. The second kind of modification is limiting the time
J. Wambecke & G. P. Bonneau & R. Blanch & R. Vergne / What if we use the "What if" Approach for Eco-Feedback?
Figure 2: Interface of the Appliances mode. Five appliances are displayed: a computer (orange), a dishwasher (green), a light (blue), a TV (purple) and a washing machine (red). The washing machine has been highlighted by the user, and the item of the dishwasher has been extended to display its consumption values.
Figure 3: Interface of the Instances mode. A TV has been chosen by the user, whose states are Usage (orange), Standby (blue) and Off (grey). At the right, we can see that the user has selected all instances of Standby lasting more than 8 hours via the definition of two criteria. Three of these instances are visible on the visualization.
of the instances either to a given duration or after a given hour in the day. The extra part, i.e. after the limit, is removed and replaced by Off. For example, users can limit all instances of Standby of a TV to 2 hours, or stop them after 11 p.m. When a modification is applied, the visualization is updated accordingly by computing new data. For each applied modification, a widget in the list of applied modifications to the right gives information about its selection, its type of modification and more importantly its gain or lost value. Users can do as many modifications as they want, which are added to the list to be compared, modified or deleted.
5. Usability Study
We conducted a first user study to evaluate the usability of Activ-elec and especially to assess if users can easily find relevant mod-ifications in the usage of appliances. To do so, we designed a con-trolled experiment where participants used the same dataset, com-ing from real appliances.
5.1. Method
13 users (11 males, 2 females) participated in the study. The partic-ipants were recruited in the faculty, and were distributed among 7 PhD students, 1 post-doctoral student, 4 engineers and 1 professor. Among these 13 participants, 11 had no knowledge of visualiza-tion tools. Only half of them (7) had energy knowledge, i.e. they could define electrical power and energy. All participants were mo-tivated in saving energy, but 4 of them said that they did not want to put too much effort to change their behavior. One participant did not follow the instructions, thus we did not consider his results. For this study we used actual data from the Household Electricity Survey[Dep16]. We selected six months of data from ten common appliances. We manually defined the states of the appliances so that our tool could extract the instances from consumption data.
The experiment was preceded by a learning phase of approxima-tively 25 minutes. The first step of this phase was the explanation of the tool by one experimenter. As a second step of the training phase, the participant had to reproduce two modifications that were given by the experimenter, on two different appliances. To conclude this phase the author asked if the participant had additional questions before starting the task. For the task we asked participants to find actions which save energy by using the tool as if they were at home with their own data. We did not enforce saving objectives so that participants can freely use the system. To evaluate the relation be-tween savings induced by the modification and the effort to apply it in the home, we used a subjective measure rated by the participants for each modification they did in the system. It evaluates how much a modification in the usage of an appliance is seen as difficult for participants to apply in their home. We asked participants to rate this effort for each modification on a psychometric scale from 1 (no effort) to 5 (maximum effort).
5.2. Results
Table1presents quantitative results from the task. For each appli-ance, the mean gain is the average for all participants of the ratio in percentage between the gain realized by the participant and the
Appliance Total Mean Mean Nb. modif. Cons. Gain (%) effort (Nb. diff.) TV 175.0 32.9% 1.7 15 (7) Heater 136.0 22.7% 1.8 10 (4) Computer 116.5 48.8% 1.7 11 (8) Dishwasher 65.5 54.2% 1.3 12 (7) Washing Machine 47.5 44.0% 1.3 9 (4) Tumble Dryer 36.0 50.1% 1.3 12 (3) Kettle 30.0 29.7% 1.0 6 (5) Game Console 17.5 22.0% 1.3 7 (4) Toaster 4.7 0.0% NA 0 (0) Light 3.7 2.3% 1.0 2 (2) Table 1: Total consumption in money (euros), mean gain, mean rated effort, and total number of modifications for all participants (with number of different modifications) for each appliance used in the task.
Figure 4: Rates from final interview. “→ understanding” means helps in understanding consumption and behavior and “→ ac-tions” means helps to find relevant actions to save energy
original consumption. Analogously the mean effort for an appli-ance is the average effort rated by the participants for the modi-fications that were applied to this appliance. On average, partici-pants saved 36.73% (σ = 12.53) of the total energy consumption and modified 6.75 appliances out of 10 (σ = 1.06) with an effort of 1.48 (σ = 0.39). The most consuming appliances such as the heater, the computer or the TV received higher efforts from the participants. In contrast the lowest consuming appliance were the subject of few modifications. All users managed to successfully use the system regardless of their knowledge about energy or visualiza-tion. Furthermore once participants decided to test a modification they could do so in less than one minute, and often in only a few seconds. All participants spent approximately 10 minutes using the tool until they were satisfied by their modifications.
Once participants finished the task, they filled a questionnaire based on a Likert scale from 1 (I totally disagree) to 5 (I totally agree). This questionnaire was designed to collect participants’
J. Wambecke & G. P. Bonneau & R. Blanch & R. Vergne / What if we use the "What if" Approach for Eco-Feedback?
feelings about the system. Averaged rates and standard deviations of the questions are shown in Figure4. Results show that the sys-tem was clearly understood by participants and easy to use. We also asked to participants which functionalities they had appreci-ated/disliked the most. Among them, the interaction was positively mentioned by 7 participants, the usefulness of a cost feedback by 6 participants, and the design of the visualization, including the choice of the colors by 5 participants. As negative points, poten-tial improvements for the user interface were mentioned by 4 par-ticipants. For example, participants would have liked more details about the states of the appliances, such as their relative consump-tions. These suggestions have been integrated in the user interface before the second study described in section6.
5.3. Discussion
The main objective of this first study was to assess the usability of Activelec and especially the What if approach applied to eco-feedback. Whereas participants did not use their own data during the study, they could understand the consumption and link it with the usage of appliances thanks to the tool. Moreover, this under-standing was reinforced by the application of selections, especially with criteria. Finally, modifications in the usage of the appliances were easily applied by the participants. Indeed results show that participants found several different modifications on the appliances in a short time period. One of the problems that users face when using eco-feedback systems is finding the relevant appliances to save energy on [Str11]. Results of the study show that participants solved this problem with the help of our system. This is shown by the choices to modify high consuming appliances or appliances on which the effort to put on are seen as low by the user. Moreover, the low average efforts rated by the users suggest that they were able to find actions that are judged easy to apply in reality.
6. Application Study
In addition to the user study presented in the previous section, we conducted another study aimed to assess how people use the tool with their own data. Our hypothesis is that users will be more in-volved in the step of data analysis. We also suppose that they will find relevant modifications that comply with their behavior in order to save energy.
6.1. Method
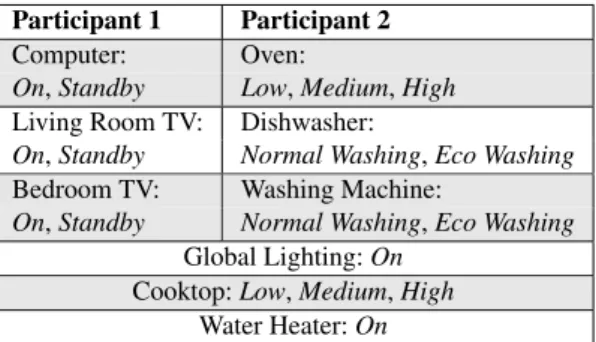
We recruited two PhD students that had previously recorded their consumption of electrical appliances. The recording took place in a dedicated smart home where participants lived during one month. The corresponding datasets are made available online by their au-thors [CLRLC17,LLR∗17]. The study was conducted after the end of the recording period, when participants no longer lived in the smart home. Both participants said that they were motivated in sav-ing electricity. One participant could define power and energy, but participants were not experts in electricity consumption. They were not specialists in information visualization. The states of the appli-ances in the datasets were manually identified and calibrated by the authors. Then the instances of the appliances were automatically extracted in our system. Appliances and states used in the study are
Participant 1 Participant 2 Computer: Oven:
On, Standby Low, Medium, High Living Room TV: Dishwasher:
On, Standby Normal Washing, Eco Washing Bedroom TV: Washing Machine:
On, Standby Normal Washing, Eco Washing Global Lighting: On
Cooktop: Low, Medium, High Water Heater: On
Table 2: Appliances used during the second study with their states. The three last appliances were common to both participants.
presented in Table2. For this study we used the same protocol as in the previous one, i.e. the same learning phase was followed by the task in which participants managed to find modifications that save energy.
6.2. Results
Participant 1 applied three modifications on the appliances and saved 7.47% of the total amount of energy, with an average of 1.67 as estimated effort to apply the modifications. Participant 2 applied six modifications and saved 31.54% of the total amount of energy, with an estimated effort of 2 in average. Despite the fact that the set of appliances was different between participants, we can see that Participant 2 managed to save more energy by applying more mod-ifications. The modifications were also rated with a higher average effort by this participant. From the gains, we can say that partici-pants managed to save a considerable amount of energy even if the datasets do not exhibit high energy consumptions. Both participants spent approximately 15 minutes using the system.
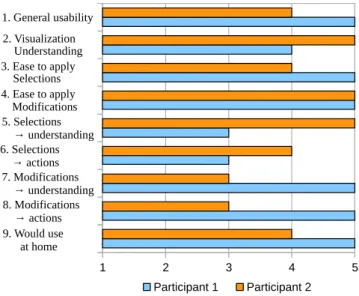
Figure5shows the answers of the participants to the question-naire about usability. We can see that both participants found Activ-elec easy to use. Results also indicate that the system was useful to understand the usage of appliances and their consumption, as well as to find actions to save energy. We can note that Participant 1 rated with a grade of 3 the two questions about the potential for selections to make data understandable and to find concrete actions to apply. Participant 2 gave the same rate for the same questions about the modifications. The explanation is that selections and modifications are used together to understand the data, as said by one participant. In the final interview, both participants said that they appreciated the visualization that allows for a detailed exploration at any time scale. As negative comments, participants only mentioned potential improvements for the interface. For example, one participant would have appreciated the consumption by month of the appliances to be displayed together with their total consumption.
6.3. Discussion
We observed that participants were more engaged in the data than in the previous study, as shown by the higher amount of time spent using the tool. This is explained by the fact that participants used their own data in this study as opposed to the previous study. They were able to relate the data to their habits. For example, they easily
Figure 5: Rates from final interview of the second study. “→ un-derstanding” means helps in understanding consumption and be-havior and “→ actions” means helps to find relevant actions to save energy.
identified their everyday actions such as taking a shower or cooking via the states of respectively the water heater and the cooktop. They also identified abnormal electricity consumptions that could be re-moved to save energy. For example, one participant observed that the water heater was heating water during each afternoon, while it was not used. Thus this participant removed this usage and said that the water heater should be configured to avoid this consumption.
We also noted that participants applied modifications that we did not expect before the study. One participant limited the usage of the cooktop to 30 minutes since it was often left on after cooking. The other participant realized that one light was used to read during the day and its consumption was substantial. These modifications saved a significant amount of energy. This supports our hypoth-esis that users will be more involved in data analysis as well as find relevant modifications that fit with their behavior to save more energy, as presented in Section3. Participants also wanted to test for modifications that are not currently possible. For example, one participant noted that two machine washings were done the same day. This participant would have liked to verify if one full machine washing is more efficient than two half-full ones.
7. Discussion and Implications 7.1. Limitations
A possible limitation of the What if approach is the requirement of user involvement, which is an inherent problem of eco-feedback dashboards [ELK∗13]. To counter this limitation, Bartram [Bar15] suggests the use of ambient systems, whose feedback is spatially (close to the appliances) and timely (when using the appliance) ap-propriate. Using a dashboard with temporal visualizations is neces-sary for our approach especially for interaction. However, we could imagine an ambient display located near the appliances to recall the
chosen modifications. This display could also provide information about the energy saved by modifying the appliance usage.
In a preprocessing step, our system extracts the instances of the appliances using empirical thresholds which requires manual tun-ing. More advanced algorithms could be used in the future to seg-ment the input data automatically and more precisely. Also, when users modify the instance of an appliance by changing its state, we need to simulate new consumption data according to the new state. Currently this is done by copying the data associated to an-other instance of this state. In future works it would be interesting to incorporate more reliable simulations of state modifications. In addition the consumption of some appliances depends on external parameters that are not taken into account by our model. For in-stance the consumption of fridges directly depends on parameters such as room temperature. To overcome this problem, we could use physical simulations that take environmental parameters as input.
7.2. Perspectives
Field Study The studies that we conducted show that users were able to find modifications that fit to their behavior. However there still remains work to prove that the What if approach is suitable in a home context. Hence we would like to go further and deploy the system in households for an in situ experiment. While asserting a change in behavior requires a long-term study and is beyond our research domain, the first step would be a mid-term study, e.g. a couple of months. This additional study could bring information about how Activelec is used in a household context. Users will test What if scenarios that they would incorporate into their everyday habits. Then, they might come back to the tool to check their new consumption. Users could also try new modifications or refine their previous scenarios. For example they might want to save more en-ergy or to put less effort to change their usage of appliances. Integration in a Home Automation System We envision incor-porating our tool in a home automation system such as Apps-Gate [CC16] where it could directly take the values of sensors as input. Users could test several modifications and define the pre-ferred ones as rules that automatically apply on the appliances. For example a rule that automatically switches off the TV after 10 PM during weekdays could be generated from the appropriate modifi-cation. In a general smart home system, our tool could also bene-fit from other available data sources. For example users would re-late the consumption of the heater to the external temperature, and lower the heater if the temperature is sufficiently high. Activelec could also be used for the analysis of other utilities such as water and natural gas. The system currently runs in a desktop environ-ment but it can be adapted to a tablet with little effort. This would allow users to analyze their consumption everywhere in the home, especially near the appliances on which modifications are applied. Suggestions The development of an automatic system that finds the best modifications for every user seems unreachable. Indeed, only inhabitants have the knowledge of how and why they use their appliances, and what is the effort required to change this usage. However it should be useful to suggest modifications that seem ap-propriate in terms of gain and estimated effort. For instance
switch-J. Wambecke & G. P. Bonneau & R. Blanch & R. Vergne / What if we use the "What if" Approach for Eco-Feedback?
ing to ecologic washing seems to require a reasonable effort. Sug-gesting selection criteria and modifications will also provide a first step to novice users, since they will directly have access to exam-ples.
Additional "What if" Features For now, Activelec allows the modification of past data but the What if approach can also be used in other ways. We could imagine the extraction of a typical week in terms of appliances usage and consumption. For example, in a typical week inhabitants could always turn on the coffee machine in the morning, and watch the TV during two hours in the evening. Then this typical behavior could be modified by users, hence ap-plying the What if approach on current data instead of past data. It would also be possible for users to create their behavior entirely from scratch. In this way the What if approach would be applied to hypothetic future data. Activelec currently targets the reduction of consumption and not the shift of consumption peaks. Since the units of energy are computed dynamically from watts our system could easily apply time based pricing. However the system should be modified to allow the visualization of energy prices over time and to shift usages of appliances.
8. Conclusion
In this paper we present a system for users to analyze, interact with and modify their electricity consumption data. In this system we model the appliances as having states over time, which are modi-fied by users. Thanks to the What if approach, users can select and change the state of appliances over time. The visualization allows them to evaluate the impact of their modifications on the consump-tion. Users can then assess the ratio between energy saving (money saved) and the required efforts to apply these modifications in their behavior. Our studies have proven the usability of the system and the ability of the users to find modifications with a reasonable ef-fort. This work opens new perspectives on applying the What if approach to the visualization of household electricity consumption and even personal visualization systems in general.
Acknowledgements
This work has been partially supported by the LabEx PERSYVAL-Lab (ANR-11-LABX-0025-01) funded by the French program In-vestissement d’avenir.
References
[Bar15] BARTRAM L.: Design challenges and opportunities for eco-feedback in the home. Computer Graphics and Applications, IEEE, Vol-ume:35, Issue:4(2015).2,3,7
[BM04] BERRYL., MUNZNERT.: Binx: Dynamic exploration of time series datasets across aggregation levels. In IEEE Symposium on Infor-mation Visualization(Oct 2004), pp. p2–p2.3
[BRA14] BUCHANAN K., RUSSO R., ANDERSON B.: Feeding back about eco-feedback: How do consumers use and respond to energy mon-itors? Energy Policy 73 (2014), 138 – 146.2
[Bre03] BREWERC. A.: Colorbrewer, 2003. URL:http://www. ColorBrewer.org.3
[BTK06] BANGM., TORSTENSSONC., KATZEFFC.: The powerhouse: A persuasive computer game designed to raise awareness of domestic en-ergy consumption. In PERSUASIVE 2006, Eindhoven, The Netherlands, May 18-19, 2006. Proceedings(Berlin, Heidelberg, 2006), IJsselsteijn W. A., de Kort Y. A. W., Midden C., Eggen B., van den Hoven E., (Eds.), Springer Berlin Heidelberg, pp. 123–132.2
[BZS∗16] BADAMS. K., ZHAOJ., SENS., ELMQVISTN., EBERTD.: Timefork: Interactive prediction of time series. In Proceedings of the 2016 CHI Conference on Human Factors in Computing Systems(New York, NY, USA, 2016), CHI ’16, ACM, pp. 5409–5420.2
[CC16] COUTAZJ., CROWLEY J. L.: A first-person experience with end-user development for smart homes. IEEE Pervasive Computing 15, 2 (Apr 2016), 26–39.7
[CLRLC17] CUMIN J., LEFEBVRE G., RAMPARANY F., L. CROW
-LEYJ.: A dataset of routines of daily living in an instrumented smart home. In Proceedings of the 11th International Conference on Ubiqui-tous Computing and Ambient Intelligence (UCAmI)(Cham, Switzerland, 10 2017), Springer International Publishing.6
[CRJ12] COSTANZAE., RAMCHURNS. D., JENNINGSN. R.: Under-standing domestic energy consumption through interactive visualisation: A field study. In Proceedings of the 2012 ACM Conference on Ubiq-uitous Computing(New York, NY, USA, 2012), UbiComp ’12, ACM, pp. 216–225.1,2
[Dar06] DARBYS.: The effectiveness of feedback on energy consump-tion. a review for defra of the literature on metering, billing and direct displays. 1–21.2
[Dep16] DEPARTMENT OF ENERGY AND CLIMATE CHANGE, IN
-TERTEKTESTING ANDCERTIFICATIONLTD.: Household electricity survey, 2010-2011. uk data service [data collection], 2016.5
[ELK∗13] ERICKSONT., LIM., KIMY., DESHPANDEA., SAHUS., CHAOT., SUKAVIRIYAP., NAPHADEM.: The dubuque electricity por-tal: Evaluation of a city-scale residential electricity consumption feed-back system. In Proceedings of the SIGCHI Conference on Human Fac-tors in Computing Systems(New York, NY, USA, 2013), CHI ’13, ACM, pp. 1203–1212.1,2,7
[GDJ∗13] GOODWINS., DYKESJ., JONESS., DILLINGHAMI., DOVE
G., DUFFYA., KACHKAEVA., SLINGSBYA., WOODJ.: Creative user-centered visualization design for energy analysts and modelers. IEEE Transactions on Visualization and Computer Graphics 19, 12 (Dec 2013), 2516–2525.2
[GKB10] GUSTAFSSONA., KATZEFFC., BANGM.: Evaluation of a pervasive game for domestic energy engagement among teenagers. Com-put. Entertain. 7, 4 (jan 2010), 54:1–54:19.2
[LLR∗17] LAGOP., LANGF., RONCANCIOC., JIMÉNEZ-GUARÍNC.,
MATEESCU R., BONNEFOND N.: The ContextAct@A4H Real-Life Dataset of Daily-Living Activities. Springer International Publishing, Cham, Switzerland, 2017, pp. 175–188.6
[PFL∗10] PIERCE J., FAN C., LOMAS D., MARCU G., PAULOS E.: Some consideration on the (in)effectiveness of residential energy feed-back systems. In Proceedings of the 8th ACM Conference on Design-ing Interactive Systems(New York, NY, USA, 2010), DIS ’10, ACM, pp. 244–247.1,3
[Str11] STRENGERSY. A.: Designing eco-feedback systems for every-day life. In Proceedings of the SIGCHI Conference on Human Factors in Computing Systems(New York, NY, USA, 2011), CHI ’11, ACM, pp. 2135–2144.2,3,6
[TBV∗13] TARIQM. B., BHANDANKARK., VALANCIUSV., ZEITOUN
A., FEAMSTERN., AMMARM.: Answering ’what-if’ deployment and configuration questions with wise: Techniques and deployment experi-ence. IEEE/ACM Transactions on Networking 21, 1 (Feb 2013), 1–13.