© EWRA Seventh International Conference
Water Resources Conservancy and Risk Reduction Under Climatic Uncertainty Limassol, Cyprus, 25-27 June 2009
COMBINED HYDRAULIC AND SOCIO-ECONOMIC IMPACT
MODELLING AT A MICRO-SCALE
J. Ernst2*, I, Coninx1*, B.J. Dewals2,3, S. Detrembleur2, S. Erpicum2, K. Bachus1, M. Pirotton2 1
Research group Environmental Policy and Sustainable Development, Katholieke Universiteit Leuven, Belgium
2Research Unit of Hydrology, Applied Hydrodynamics and Hydraulic Constructions, Department ArGEnCo, University of Liege, Belgium
3F.R.S.-FNRS Postdoctoral Researcher * both authors contributed equally to this paper
Abstract: Risk management is currently shifting from the full protection against flooding towards the management of the consequences of flooding. To reduce these consequences, micro-scale analysis is compelled. In addition to the hydraulic modelling of the inundation flow, nearby land use and vulnerability of elements-at-risk are taken into consideration. This new approach requests an interdisciplinary collaboration of scientists from hydraulic and social science, as is the case for this paper. The research teams have developed a methodology to evaluate socio-economic consequences of flooding based on the analysis at the micro-scale of the flood characteristics, the exposure and the vulnerability of elements-at-risk and the adaptive capacity of society. The hydrodynamic simulations are conducted by means of 2D flow modelling run on a highly accurate Digital Surface Model - DSM with a resolution of 2 by 2 meters. The two-dimensional modelling provides high resolution flood maps detailing the distribution of water depth and flow velocity field in the floodplains, which constitute key inputs for the subsequent flood risk analysis. The methodology will be illustrated for a case study along River Ourthe, which is the main tributary of River Meuse in Belgium, for selecting and designing flood protection measure. The geographic data in this area are available at a resolution consistent with the conducted micro-scale risk analysis. They include data on social vulnerability coming from the most recent socio-economic national survey (NIS).
Key words: 2D modelling, adaptation measure, flood risk, micro scale, social impact.
1. INTRODUCTION
Flood risk management focuses on the reduction of flood risks. This means on one hand that flood probability is aimed to reduce, and on the other hand that consequences of flood risks are meant to limit. Acknowledging that full prevention against flooding is a difficult, even unfeasible, objective, water managers currently invest in managing the impacts of flooding. Two types of impacts are triggered by floods: tangible impacts and intangible impacts. Tangible impacts can be easily monetized and are merely related to material damage like damage to houses, household goods, public and industrial buildings, and agricultural goods. Intangible impacts cannot be directly expressed in monetary terms. The main category of intangible impacts are social impacts, like mental and physical health impacts, disruption in time spending, the loss of irreplaceable items, the financial disruption of a household, the difficulties in recovery and the impoverishment of the neighbourhood. Other intangible impacts are ecological impacts, typically the loss of biodiversity. The reduction of social flood risks is the focus of this paper. Since social flood impacts are experienced at the level of the individual and the households, a micro-scale analysis is compelled by using an object oriented procedure. In addition, the new approach requests an interdisciplinary approach of scientists from hydraulic and social sciences, as is the case for this research team. A methodology is developed in order to evaluate the social consequences of flooding based on the micro-scale analysis of the three-pillar social flood risk reduction strategy. The first pillar refers to the weakening of flood characteristics. The second pillar includes the restriction of the exposure of
vulnerable elements-at-risk. And the last pillar contains the increase of the adaptive capacity of the society.
2. ADAPTATION TO SOCIAL FLOOD RISKS
The social flood impacts are the main focus of this paper. These impacts appear at the moment that human settlement is coming into contact with flooding, and in particular when this flooding makes losses on houses, factories and public infrastructures. This occurrence may start a chain of reactions, since social impacts are interrelated to each other. Hereafter, a non exhaustive list of these potential social flood impacts that may occur during or following of a flood event is presented. First of all, the most severe social flood impact is the loss of life, which is compared to a direct damage to the human body. Less severe, but more frequently occurring impacts are physical health (e.g. colds, skin irritation, exhaustion…) (Tapsell et al. 2002; Lamothe et al. 2005) and mental health impacts (e.g. stress, anxiety and depression …) (Tapsell and Tunstall 2001). After the flooding, the recovery process is difficult for communities that have faced the inundation. In particular for those who rent houses and those who are not covered by insurances. But for insured people as well, recovery may be stressful, because of the negotiations with insurers and loss adjusters. (Tapsell and Tunstall 2001) In addition, flood damage may have an impact on the financial situation of the household in two ways. Firstly, flood may cause in income cut due to days off from business interruption. Secondly, spending might increase due to rehabilitation after flooding (e.g. cleaning-up, repairing, health care costs…) (Twigger-Ross 2005; Tapsell and Tunstall 2001; Walker et al. 2006). People’s attitude towards policymakers may make a 180 degree turn. This event may result in distrust regarding the governing authority and the loss of confidence in existing flood protection, forecasting and support provision. (Lamothe et al. 2005; Tapsell et al. 2002) However, it might be this distrust that triggers the positive behaviour of precautionary measures to protect one-selves (Grothmann and Reusswig 2006). A last social impact to mention here is the impoverishment of the neighbourhood. The dirt in the street, the damage to public infrastructure may create material impoverishment. But it is the empty houses, and the migration of people out of the flood risk area that create social impoverishment. People feel insecure and anxious about the new-comers what may affect the social cohesion of the community (Tapsell et al. 2002). From this reviewing of the potential social flood impacts, the three pillars, or driving forces of the impacts evaluation methodology can be discerned. They are expressed in Equation 1 (based on Hilhorst 2004): * * F E V SI AC = (1),
SI : social flood impacts
F: flood characteristic
E: exposure of elements-at-risk
V : vulnerability of people AC : adaptive capacity of
the society Firstly, the flood characteristics: the water level, the water rise, the velocity and duration of the flooding, influence social flood impacts. Secondly, exposure of elements-at-risk to flooding: people living near river banks are more likely to experience social flood impacts than people living outside the flood risk area. And thirdly, the vulnerability of the people-at-risk and the capacity that is available in the society to adapt to the floods. Certain population groups have more difficulties in coping with flooding than others. On the other hand, society has organised several measures to support people during flooding, which is called adaptive capacity. These three driving forces are clarified more in the next chapters. Thus, social flood impacts can be limited by one or more strategies. The first strategy is to weaken the flood characteristics, for instance by the construction of natural or artificial controlled flood areas, dikes and walls, green roofs and wells. These measures are most of the time promoted and implemented by water managers. In addition, exposure of elements-at-risk might be limited. These measures are related to land use and in particular implemented by spatial planners. A third strategy to reduce social flood risks is to increase the adaptive capacity of the society. Multiple measures are useful, but none of them can stand alone. For instance, flood proofing of buildings, the communication of the flood risks in order to raise awareness, financial support to reimburse the flood damage organised by private insurance
companies or by the government. In addition, an emergency plan may increase the adaptive capacity when well organised and exercised.
3. INONDATION MODELLING
As mentioned before, inundation flow characteristics are the first driving force of the social impact evaluation. These parameters are direct outputs of the hydraulic modelling. Prior to running numerical simulation, the flow boundary conditions have to be set by means of a hydrologic analysis of the catchment response. This study also leads to the associated probability of a given discharge based on the statistical analysis of the river flow time series (usually expressed in hydrology in terms of a return period in year).
It is shown that interactions between the main channel and the floodplain of rivers during flooding are important and cannot be neglected (Mcmillan and Brasington 2008). Therefore, the assumptions of one dimensional model are not acceptable in many cases involving complex floodplain geometries in particular in urbanized areas. Therefore, since very accurate Light Detection And Ranging – LiDAR topographic data, which is an airborne laser remote sensing tool characterized by a horizontal resolution of 1 by 1 meters grid size and an altitude precision of 15 centimetres, are available, the present study is based on a detailed two-dimensional flow model. This model is included in the modelling system WOLF developed at the University of Liège. WOLF 2D is based on the depth-averaged equations of volume and momentum conservation, i.e. the “shallow-water” equations (Chaudhry 1993): • d d 0 f f g s f g S S t x y x y ∂ ∂ ∂ +∂ +∂ + + = − ∂ ∂ ∂ ∂ ∂ r r r r r r r (2) with sr=
[
h hu hν]
T the vector of the conservative unknowns. Sr0 and Sfr
designate respectively the bottom slope term and the friction term:
[
]
T0 0 b b
Sr = −gh ∂ ∂z x ∂ ∂z y (3), Srf = 0 τb,x ρ τb,y ρT (4)
f
ur
and gur represent the advective and pressure fluxes in directions x and y, while fd
r
and grd are the diffusive fluxes. The following notations have been used: t represents the time, x and y the space coordinates, h the water depth, u and v the depth-averaged velocity components, zb the bottom
elevation, ρ the density of water, τbx and τby the bottom shear stresses. The bottom friction is
conventionally modelled thanks to an empirical law, such as the Manning formula. The models enable the definition of a spatially distributed roughness coefficient. The internal friction may be reproduced by different turbulence closures included in the modelling system, such as simple algebraic ones but also a complete depth-averaged k-ε model.
The space discretization is performed by means of a finite volume scheme. Variable reconstruction at cells interfaces is performed linearly, in combination with slope limiting, leading to a second-order spatial accuracy. The advective fluxes are computed by a Flux Vector Splitting (FVS) technique developed by the HACH. A Von Neumann stability analysis has demonstrated the stability of this FVS (Dewals 2006). The diffusive fluxes are legitimately evaluated by means of a centred scheme. Since the model is applied to compute steady-state solutions, the time integration is performed by means of a 3-step first order accurate Runge-Kutta algorithm, providing adequate dissipation in time. The time step is constrained by the Courant-Friedrichs-Levy (CFL) condition based on gravity waves. A semi-implicit treatment of the bottom friction term is used, without requiring additional computational costs.
The model has been extensively validated and has shown its efficiency for numerous practical applications, (Dewals et al. 2006; Dewals et al. 2008; Erpicum et al. 2009a; Erpicum et al. 2009b; Roger et al. 2009) notably flood modelling (Dewals et al. 2008)..
4. EXPOSURE ANALYSIS
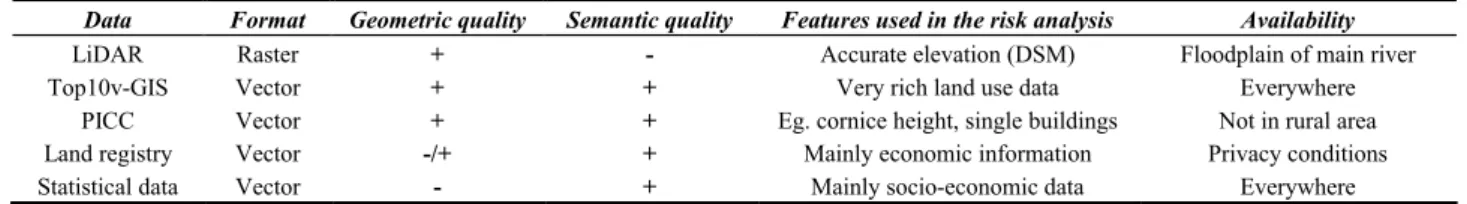
The second driving force of the social flood impact evaluation is the exposure of the elements-at risk. Typically, the exposure is carried out by combining the inundation extent and land use database. In order to keep consistency between the 2D numerical flow modelling performed on a 2m Cartesian grid and the risk evaluation process, the developed tool handles several sources of highly accurate Geographic Information Systems – GIS as shown in Table 3 (Ernst et al. 2008). Table 2. Summary of the spatial information.
Data Format Geometric quality Semantic quality Features used in the risk analysis Availability
LiDAR Raster + - Accurate elevation (DSM) Floodplain of main river
Top10v-GIS Vector + + Very rich land use data Everywhere
PICC Vector + + Eg. cornice height, single buildings Not in rural area
Land registry Vector -/+ + Mainly economic information Privacy conditions
Statistical data Vector - + Mainly socio-economic data Everywhere
For increasing the reliability of the hydraulic modelling, it is performed based on a DSM which includes obstacles relevant to the flow including the “over grounded” elements-at-risk. Furthermore, the present social risk analysis is based on an object oriented process, requiring that the flood parameters need to be determined for each element-at-risk, i.e. house, industrial building…, threatened by the flood. In this context, specific features are developed in order to compute the flood parameters inside these assets. Either the average value of the flood parameters in the neighbouring cells is assigned to the element-at-risk, or the free surface and the ground level are linearly interpolated inside the asset by using a least square method and subsequently averaged (Ernst et al. 2008).
Once the elements-at-risk are identified and the flood parameters computed, the flood characteristic index expressed in Equation (5) (Coninx and Bachus 2008) can be evaluated:
0.45* 0.22* 0.22* 0.11*
F = WD+ WR+ V+ D (5), WD : water depth score WR : water rise score V : velocity score
D: duration score Each of these scores is binary valued based on a threshold value. For example, in the case of the water depth score, the threshold value is 0.3m. Thus, if the water depth is lower than 0,3m the variable is 0 and 1 otherwise. For the velocity, the threshold value is 2 ms-1, 12 hours for the duration and considering the water speed rising, there is no numerical threshold, but the rising have to be considered as slow or sudden. Slow means that the rising is faster than people warning delay. Since the numerical simulations are run using the steady state assumption, the two last flood characteristics, i.e. water rising and duration of the flood, may not be established based on the flow modelling. But regarding the gauging station measurements, the flood events on river Ourthe can be considered as slow and long. In this context, the WR and D scores will remain respectively 0 and 1 in the following of this paper.
5. SOCIAL VULNERABILITY AND ADAPTIVE CAPACITY OF SOCIETY
5.1 Social vulnerability of people and adaptive capacity of society: concepts
The last driving forces are the vulnerability of some population groups and their capacity to adapt to flood events. They are connected to each other in the way that increased adaptive capacity will reduce the actual vulnerability of the people.
Vulnerable people are individuals that are unable to cope with the effects of flooding due to social economic, political and cultural attributes. Empirical researches (Tapsell et al. 2002; Cutter et al. 2003) shows that some people categories have more difficulties in handling the flood event (cf. § 0). The reasons are that they have a limited awareness of the risk, a lack of information and knowledge of the risk or restricted access to political power and social patterns (Aysan 1993).
Adaptive capacity refers to mechanisms to alleviate or contain the impact (Thywissen 2006). To be effective, these mechanisms have to be organised at society level such as social networks, economic
mechanisms (e.g. savings or available governmental budget), institutional mechanisms (e.g. collective action to reduce vulnerability), technological and non-technological mechanisms that prevent or reduce disaster impact (Brouwer et al. 2007).
5.2 Assessment methodology
5.2.1 Vulnerability of people
Theoretically, it would be best to measure vulnerability at the level of houses. However, due to privacy arguments, data is rarely available at this level. Therefore, we are limited to measure vulnerability at the level of districts, which is the lowest level of available data. Given this limitation, social vulnerability is measured by a composed index that indicates the proportion of vulnerable people in a certain area. The selected indicators are proxies of the vulnerable social groups, selected on literature review (Tapsell et al. 2002; Cutter et al. 2003).
Normalization or standardization are not necessary, because every indicator refers to data on the proportion of people and are expressed in percentages. Due to lack of scientific evidence on the interrelationships between the indicators, it is opted to weight them equally. The present analysis takes into account the ratio of (i) elderly, (ii) ill people, (iii) lone parents, (iv) foreigners, (v) financially deprived people, (vi) people living in one-storey houses. The indicators are aggregated by the geometric mean since the variables are non-comparable and ratio scale (Ebert and Welsh 2004 ; Böhringer and Jochem 2006).
( )
(
)
( )
1( )
1 0 for 1,... 1 i n W i i i I Y X W i n I S I Y = = − > = = −∏
(6), I Y = non-social vulnerability index;( )
X = social vulnerability indicator;( )
I S = social vulnerability index Data on the vulnerability of people in case study Esneux is coming from the most recent population census, which is 2001 (NIS). Another bottleneck is that data on ill people and people living in one-storey houses is currently missing at the district level and therefore, these indicators are not yet included in this research. The indices are ranked by using fixed margins. Areas with indices between 0 – 0.06 are resilient, 0.06 – 0.13 are at risk of social vulnerability, 0.13 and 0.19 are socially vulnerable, 0.2 or more are called extremely socially vulnerable areas.
5.2.2 Adaptive capacity of the society
In contrast to vulnerability research, the search for indicators to make adaptive capacity operational is rather new and only few systematic methods seem to approach adaptive capacity. To meet this gap, the sociologists of the research team have developed an analytical framework for adaptive capacity towards floods. From literature reviewing, policy documents and in collaboration with public officers, several indicators have been identified in order to evaluate the adaptive capacity. They are classified in eight variables: technological and non-technological measures, availability and distribution of resources, institutional structure and capacity, social capital, risk spreading instruments, information, public perception. By scoring the indicators, a total adaptive capacity score is received.
6. SOCIAL FLOOD IMPACTS AND SOCIAL FLOOD RISKS
Given the intangibility, social flood impacts are hard to quantify separately. Therefore, the use of a figure that symbolises the level of severity of the social flood impacts and that enables relative comparison between areas seems to be appropriated. In this way, high priority areas for social flood risk reduction are disclosed. To estimate the social flood impacts for those people who are exposed
to floods, the aspects are combined in Equation 7 (Coninx and Bachus 2008), while Table 4 illustrates what is the meaning of low, medium or high social impact.
0,5* 0, 25* 0, 25*
SI = F+ V+ AC (7), SI: Social impact
F : flood characteristics
V = vulnerability AC = adaptive capacity Table 3.Social indices value: flood characteristics, vulnerability and adaptive capacity
Flood characteristics index Vulnerability index Adaptive capacity index
Cf. Equation (5) Resilient category = 0 Low adaptive capacity = 1 Category at risk of social vulnerability = 0.33 Medium adaptive capacity = 0.5 Category socially vulnerable = 0.66 High adaptive capacity = 0 Category extremely socially vulnerable = 1
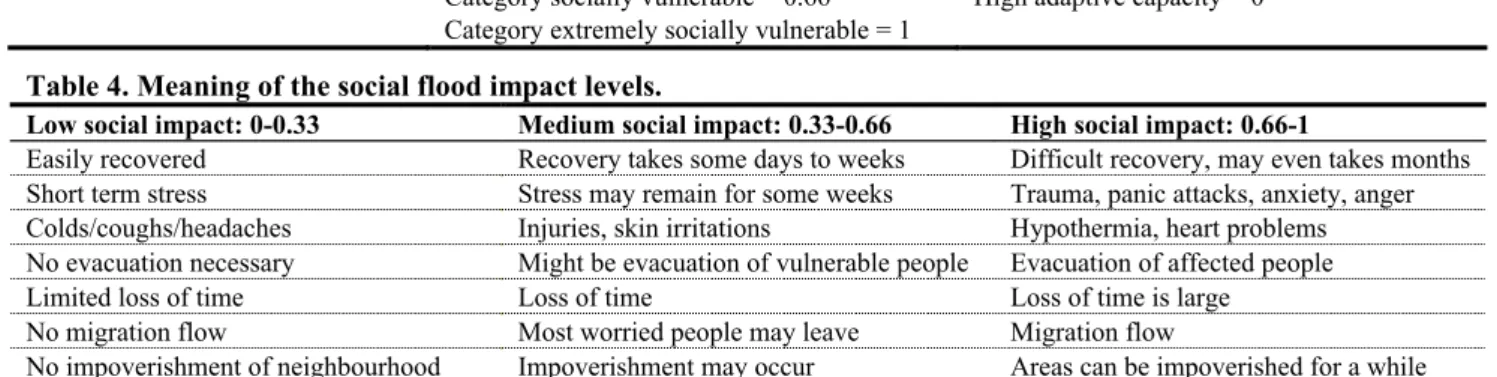
Table 4. Meaning of the social flood impact levels.
Low social impact: 0-0.33 Medium social impact: 0.33-0.66 High social impact: 0.66-1
Easily recovered Recovery takes some days to weeks Difficult recovery, may even takes months Short term stress Stress may remain for some weeks Trauma, panic attacks, anxiety, anger Colds/coughs/headaches Injuries, skin irritations Hypothermia, heart problems No evacuation necessary Might be evacuation of vulnerable people Evacuation of affected people Limited loss of time Loss of time Loss of time is large
No migration flow Most worried people may leave Migration flow
No impoverishment of neighbourhood Impoverishment may occur Areas can be impoverished for a while The social flood impacts are expressed as the number of people that are living in low, medium or high social flood impact areas. The aim of social flood risk management is firstly to reduce the number of affected people in general and secondly to reduce the severity of the impact.
7. CASE STUDY
7.1 Description
The case study is located in the lower part of river Ourthe, the basin of which has a catchment area of about 2900 km2 at the downstream limit of the case study. Two towns are located along the studied part of the river Ourthe: the town of Esneux and the town of Tilff. Concerning the hydraulic modelling, the case study is located in the Ardennes massif, where the valleys are quite narrow and the water storage in the inundated floodplain is very low. Thus, the steady state assumption is valid for the river Ourthe. With the purpose of reducing the computational time, this assumption will be used for the modelled flood events. The risk analysis will be applied on an area that covers three reaches of the river Ourthe located respectively 18.5 km (reach n°1), 12.5km (reach n°2) and 10 km (reach n°3) upstream of the mouth of river Ourthe into river Meuse (Belgium). The total length of the simulated reaches is about 16 km with a computational Cartesian grid of 2 by 2 meters leading to 8,2.105 computational cells. For this case study, the most significant factors influencing vulnerability are the high proportion of single parents and deprived people.
7.2 Adaptation measure
During the 19th century, the idea of an inland navigation canal building that should have linked the Meuse and the Rhine basins was developed. But, only some reaches of this huge engineering project were indeed constructed. The constructed parts of the canal were used to enable inland navigation and, as far as the reaches along river Ourthe are concerned, they were intensively exploited until the beginning of the 20thcentury.
Today, some remains of the canal, notably some locks, are still visible. Field surveys have been dedicated to take census of all the remains still visible today in order to identify the ancient course and an approximated cross section of the ancient canal. Using the collected information, the Digital Surface Model has been updated taking into account the canal rehabilitated, considered as a flood
protection measure increasing the overall section of the river by 18%. Figure 1 shows cross-sections of river Ourthe just downstream of the town Tilff. Notice the protection wall (cf. Figure 1 b.), designed for a 100-year flood (876 m3s-1), the effectiveness of which is discussed below.
Figure 1. Cross section (a. present situation, b. canal rehabilitated).
7. 3 Risk analysis
Figure 2 a. shows the results of the social risk analysis with the rehabilitation of the ancient canal (continued curves) and the current situation (dotted curves). The light grey curves plot the number of people affected by the flood in the low social risk class, the black one is related to medium risk and there are no affected people in the higher risk class. This figure also shows the effectiveness of another non-structural adaptation measure (cf. Figure 2 b.), namely the increasing of the adaptive capacity of the people threatened by the flood. In this context, it is assumed that the adaptive capacity of people facing inundation increase from medium to high.
First, the analysis of the total number of people threatened by the flood reveals that for the interval between 876m3s-1and about 970m3s-1the effectiveness of the mitigation measure increases sharply. This trend is related to the protection wall located downstream of Tilff for the protection of a residential district. Thanks to the canal rehabilitation, this wall initially designed for a 100-year flood becomes effective up to a 250-year flood. Outside this interval, the number of people affected by flooding is reduced by no more than about 20 to 40. The number of people affected in the lowest class of social impact is rather constant; the influence of this adaptation measure is quite small.
Figure 2. Number of affected people with and without adaption measure (a. rehabilitation of the ancient canal, b. increasing of the adaptive capacity).
Secondly, the graph b. in Figure 2 shows the influence of the social impact of an increase of the adaptive capacity of people threatened by flood. This measure might be put in place by perfecting a emergency planning for example. It leads to high changes in the distribution inside social impact classes. But since this non-structural measure does not influence the flow, the total number of people affected remains the same.
The general conclusion of the social risk analysis is that the effectiveness of the first mitigation measure is mainly tangible for a limited range of discharges between 876m3s-1 and about 970m3s.
a. b. Free surface Protection wall Canal Main channel a. b.
The second mitigation measure seems to be very interesting thanks to the reduction of affected people in the medium social impact class. As both measures play a different part in the social impact reduction and without considering the cost of both mitigation measures, it would be interesting to combine measures in order to add the effects of the structural and non structural them, even if the cost of the rehabilitation of the ancient canal should not be underestimated within the framework of an overall cost-benefit analysis.
8. CONCLUSION
The procedure presented in this paper constitutes a genuine risk modelling chain handling the whole flow process from statistical analysis of river time series to the social risk evaluation including the flow modelling. The risk modelling system also provides practical support for selecting and designing the most appropriate protection measures.
REFERENCES
Aysan, Y., 1993. Keynote paper: vulnerability assessment. In P. Merriman and C. Browitt (eds) Natural disasters: protecting
vulnerable communities. Telford. London.
Böhringer, C. and Jochem, P., 2006. ZEW discussion paper No. 06 – 073. Measuring the immeasurable: a survey of sustainability indices. Zentrum für Europäische Wirtschaftsforschung GmbH. Mannheim. 24.
Brouwer, R., Akter, S., Brander, L., and Haque E., 2007. Socioeconomic vulnerability and adaptation to environmental risk: a case study of climate change and flooding in Bangladesh. Risk Analysis; 27; 2; 313-326.
Chaudhry, M. H., 1993. Open-Channel Flow. Englewood Cliffs, Prentice Hall.
Coninx I., Bachus K. 2008. Social risk assessment methodology. HIVA-KULeuven (Unpublished paper)
Cutter,S., Boruff, B.J., Lynn Shirley, W., 2003. Social vulnerability to environmental hazards. Social Science Quarterly; 84;2:242-261.
Dewals, B. J.; Detrembleur, S.; Archambeau, P.; Erpicum, S.; Pirotton, M., 2008 Detailed 2D hydrodynamic simulations as an onset for evaluating socio-economic impacts of floods considering climate change. Proc. European Conference on Flood Risk
Management - FloodRisk 2008. Rotterdam, Balkema.
Dewals, B. J.; Erpicum, S.; Archambeau, P.; Detrembleur, S.; Pirotton, M., 2006. Depth-integrated flow modelling taking into account bottom curvature. J. Hydraul. Res. 44(6): 787-795.
Dewals, B. J., Kantoush, S. A.; Erpicum, S.; Pirotton, M.; Schleiss, A. J., 2008. Experimental and numerical analysis of flow instabilities in rectangular shallow basins. Environ. Fluid Mech. 8: 31-54.
Ebert U. & Welsch H., 2004. ‘Meaningful environmental indices: a social choice approach’. In Journal of Environmental Economics
and Management. 47. p. 270-283.
Ernst, J., Dewals, B. J.; Detrembleur, S.; Archambeau, P.; Erpicum, S.; Pirotton, M., 2008. Integration of accurate 2D inundation modelling, vector land use database and economic damage evaluation. Proc. European Conference on Flood Risk Management
-FloodRisk 2008. Rotterdam, Balkema.
Erpicum, S., Dewals, B. J., Archambeau, P., and Pirotton, M., 2009. "Dam-break flow computation using high resolution DEM." J. Comput. Appl. Math., in press.
Erpicum, S., Meile, T., Dewals, B. J., Pirotton, M., and Schleiss, A. J., 2009),. "2D numerical flow modeling in a macro-rough channel." Int. J. Numer. Methods Fluids, in press.
Grothmann, T. and Reusswig, F., 2006. ‘People at risk of flooding. Why some residents take precautionary action while others do not’. Natural Hazards. 38. p. 101-120.
Hilhorst, D., 2004. Wageningen course Natural Hazards and Disaster. University of Wageningen. Wageningen. (16th of March 2004)
Jonkman, S.N. and Kelman, I., 2005. ‘An analysis of the causes and circumstances of flood disaster deaths’. Disasters. 26(1) p.75-97. Lamothe, D.-N., Neveu, G., Görlach, B. and Interwies, E., 2005. Evaluation of the impact of floods ad associated protection policies.
Final report. European Commission DG Environment. 108p.
Mcmillan, H. K., and Brasington, J., 2008. End-to-end risk assessment: A coupled model cascade with uncertainty estimation. Water Resources Research 44(W03419): 14.
Roger, S., Dewals, B. J., Erpicum, S., Pirotton, M., Schwanenberg, D., Schüttrumpf, H., and Köngeter, J., 2009. "Experimental und numerical investigations of dike-break induced flows." J. Hydraul. Res., accepted.
Tapsell, S.M. and Tunstall, S.M., 2001. The health and social effects of the June 2000 flooding in the North East Region. Report to the Environment Agency. Flood Hazard Research Centre. Middlesex University. Enfield. 144p.
Tapsell, S.M., Penning-Rowsell, E.C., Tunsall, S.M., and Wilson T.K., 2002. ‘Vulnerability to flooding: health and social dimensions’ Phil. Trans. R. Soc. Lond. A. 360. p. 1511-1525.
Thywissen, K., 2006. ‘Core terminology of disaster reduction. A comparative glossary.’ In: Birkmann J. (eds.) Measuring
vulnerability to natural hazards: towards disaster resilient societies. United Nations University Press. Tokyo. P. 448-496.
Twigger-Ross, C., 2005. The impact of flooding on urban and rural communities. Environment Agency. Bristol. 44p.
Walker, G., Burningham, K., Fielding, J., Smith, G., Thrush, D. and Fay, H. (2006) Addressing environmental inequalities: flood