Customer Service Driven Supply Chain Segmentation
byPrakit Worawattananon B.A. Economics Thammasat University, 1996
Submitted to the Engineering Systems Division in Partial Fulfillment of the Requirements for the Degree of
Master of Engineering in Logistics
at theMassachusetts Institute of Technology
June 2008© 2008 Prakit Worawattananon
All rights reserved.
The author hereby grants to MIT permission to reproduce and to distribute publicly paper and electronic copies of this document in whole or in part.
Signature of Author ...
Master of Engineering in Logtics Program, Engineering Systems Division
7 May 9, 2008
Certified by...
D). Larry Lapide Director, Demand Management, MIT Center for Tansport and Logistics // F4 I /esis Supervisor
Accepted by ... . .. ... Prof. Yossi Sheffi Professor, Engineering Systems Division Professor, Civil and Environmental Engineering Department Director, Center for Transportation and Logistics Director, Engineering Systems Division MASSACHLýSE7TS INSTTUTE
OF TECHNOLOGY
AUG 0 6 2008
LIBRARIES
Customer Service Driven Supply Chain Segmentation
by
Prakit Worawattananon
Submitted to the Engineering Systems Division On May 09, 2008 in Partial Fulfillment of the
Requirements for the
Degree of Master of Engineering in Logistics
ABSTRACT
The objective of this thesis is to develop a supply chain segmentation model for Company X, which is in the chemical and construction materials industry. The company sells products in an expanding Southeast Asia market. At the same time, it innovates and launches new products to these markets. A major issue for the company to consider is services offered to its
customers. The company has to address customer needs, analyze them, and design the products and services that will fulfill those selective demands.
This thesis leverages this concern for the company by developing a model to segment the company's supply chain based upon customer services. Company Y, a subsidiary company of Company X, is selected to be a case study for the model developed in this thesis. Quantitatively, the thesis examines collected data such as customer including portions of revenue and margin from each customer; and a customer's profile potential from the size of the firm. Qualitatively, the data and information collected from interviewing relevant people, such as sales and marketing personnel, is used to characterize the company's future customer prospects. Furthermore, some selected current practices in the industry will be reviewed and benchmarked for formulating the model.
Thesis Supervisor: Larry Lapide
Acknowledgements
First and foremost, I would like to thank my thesis advisor, Dr. Larry Lapide, for his valueless advice. His helpfulness and guidance were critical for developing this thesis from the beginning to the end. Moreover, I would like to express my sincere thanks to Mr. Arichai Lalitkulanant and all colleagues at Company X for advising and providing me the material for the thesis. This thesis could not have been completed without the generous help and information given by them. Lastly, I would like to thank my family, especially my mom and my wife, for their always being supportive during my entire period at MIT.
Table of Contents
ABSTRACT ... . ... ... 2
A cknow ledgem ents ... ... ... ... ... ... 3
List of Tables ... ... ... ... .. . ... ... 5
L ist of F igures ... .... .... ... .... ... ... . . ... 6
Chapter 1 Introduction: Project Background and Motivation ... 7
Chapter 2 Business Challenge and Opportunity ... ... 9
2.1 Overview of Business Structure... ... .. ... 9
2.2 Overview of Company Position in the Industry ... 10
Chapter 3 Company Supply Chain and Customer Service ... 11
3.1 Definition of Customer Service ... 11
3.2 Customer Segmentation Approach ... 12
3.3 Profile of the Company Supply Chain ... ... 14
Chapter 4 Review of the Literature ... ... 22
4.1 Customer and M arket Segmentation ... ... ... 22
4.2 Supply chain segmentation ... .. ... .. ... ... 27
Chapter 5 Approach to Segm ent ... ... .. ... 38
5.1 Custom er Survey ... ... ... ... ... ... 38
5.2 Sales Data Analysis ... .... ... ... .... . ... 38
5.3 Interview with Sales and Marketing Personnel ... 39
Chapter 6 Data Collection and Analysis ... ... 41
6.1 Sales performance Analysis... ... 41
6.2 Push Factors A nalysis ... ... ... ... 43
6.3 Pull Factors Analysis... . ... .... ... 50
Chapter 7 Segmentation Model Development ... 57
7.1 Combining Push and Pull Segmentation Factors ... 57
7.2 Segmenting Customers and Developing Sets of Services Based on the Push-Pull Segm entation M atrix ... ... ... ... 58
Chapter 8 Conclusion and Opportunities for Future Research ... 66
8.1 Sum m ary of the Thesis ... ... . ... ... 66
8.2 Key Learning ... ... 67
8.3 Opportunities for Future Research ... ... .... ... 68
Bibliography... .. . . ... ... 69
List of Tables
Table 3.1: Behaviors and Characteristics of Dealers in Each Channel ... 13
Table 4.1: Example of Segmentation in Different Industries ... ... 25
Table 4.2: The Linkage between Desired Supplier Attributes and Resulting Customer C onsequences ... . . ... ... ... 34
Table 6.1: Sales Performance by Each Channel ... 42
Table 6.2: Condition for Contribution Level ... ... 44
Table 6.3: Condition for Potential Level ... ... 45
Table 6.4: Criteria for Push Segmentation Factor Ranking ... ... 47
Table 6.5: Wholesale Channel- Required Services Derived from Pull Factors ... 53
Table 6.6: Retail Channel- Required Services Derived from Pull Factors ... 54
Table 6.7: Project Channel- Required Services Derived from Pull Factors ... 55
Table 7.1: Wholesale Channel- Services Offered by Group of Dealer ...59
Table 7.2: Retail Channel- Services Offered by Group of Dealer ... 60
Table 7.3: Project Channel- Services Offered by Group of Dealer ... 62
Table 7.4: Financial Contribution Consideration ... ... 63
List of Figures
Figure 3.1: Company's Channel Network ... ... 14
Figure 3.2: Cement Plants ... ... .. 15
Figure 3.3: Construction Materials Plants ... ... 16
Figure 3.4: Petrochemical Plants ... ... ... ... 17
Figure 3.5: Paper Plants ... ... ... ... 18
Figure 3.6: Domestic Distribution Facilities ... ... 19
Figure 3.7: Production Expansion Plan in Southeast Asia ... ... 20
Figure 4.1: Logistics Service Quality and Loyalty Drivers ... 28
Figure 4.2: Hypothesized Model of LSQ as a Process ... 32
Figure 4.3: Six Supply Chain Network Designs ... .. ... 36
Figure 6.1: Company Y's Sales Revenue in 2007 ... ... ... 42
Figure 6.2: Portion of Customers, Transactions, and Revenue of Each Channel ... 43
Chapter 1 Introduction: Project Background and
Motivation
As the worldwide markets have been continuously opened, global competition becomes inevitable. Moreover, as some developed Southeast Asian markets, such as Thailand, are gradually becoming saturated, companies need to develop new strategies to compete with their competitors and grow or even maintain their business, especially for the companies producing commodity products like construction materials and chemicals.
From 1987 to 1995, Thailand enjoyed a very high annual growth rate of GDP, between 8.1 and 13.3%, stimulating the investment and construction in the country. At the time, construction companies gained a huge benefit and expanded their production capacity to fulfill the overwhelming demand. However, after the Asian financial crisis everything turned backward. In 1997 and 1998, negative investment occurred (which means there was no investment but the depreciation of the existing building and machinery still occurred) and appeared on the country's economic index. Currently even though the economy has recovered, big investment such as what happened in 1987-1995 seems to be very difficult to repeat. The construction market grows a tiny rate and tends to be saturated, in the very near future.
Company X is one of the companies facing this situation and trying to grow its business by expanding the business into new markets in Southeast Asian. In new markets, the business territory is expanded out of Thailand, so the company has to face greater complexity in its supply chain. In order to meet this challenge, Company X is developing a new supply chain
strategy to serve the new customers in the new markets. To achieve this target, the most important initial task for the company is to find a way to define its future customers and segment its supply chain model to match with those customers.
The objective of this project is to develop a supply chain segmentation model for the company. Firstly, this thesis will discuss about the business challenge and opportunity that Company X is facing. Then the company's existing supply chain and customer services will be examined and described to evaluate the current practices. Finally the thesis will propose a methodology to define and segment customers, and then develop the supply chain segmentation model as a framework for the company to apply to its other subsidiary companies.
Chapter 2 Business Challenge and Opportunity
In this chapter, we introduce the overview of business structure and then briefly discuss about the overview of company position in the industry
2.1 Overview of Business Structure
Company X focuses in three major businesses: Cement and Construction Materials, Chemicals, and Paper.
Cement and Construction Materials Business
Company X produces and supplies cement, ready-mixed concrete, and concrete products, as well as construction materials which are a complementary to the cement business with a various range of products including roofing materials, ceramic tiles, sanitary ware, faucets, paving blocks, and insulation products. With extensive industry knowledge, advanced production technology, and product design capability, the company is now recognized as a leading manufacturer of a diverse range of products in a wide variety of construction related
applications in Thailand and the Southeast Asia region.
Chemicals Business
Company X manufactures and supplies a full range of chemical products ranging from upstream chemicals such as olefins, intermediate chemicals such as styrene monomer, PTA, and MMA, to downstream chemicals such as polyethylene, polypropylene, polyvinyl chloride, and polystyrene resins. It is now one of the largest integrated chemical companies in
Thailand and a key industry leader in the Asia-Pacific region. The company is widely accepted for its quality products as well as excellent management and operational prowess.
Paper Business
Company X is the largest integrated producer of paper products in Thailand, consisting of pulp and printing & writing paper, packaging paper, and corrugated containers. The products have gained wide acceptance in both domestic and international markets for their world quality standards. The Paper Business remains the industry leader in Thailand and in the Southeast Asia region. The Paper Business focuses on constant improvement of operation and management efficiency, which enhances the country's productivity and competitiveness.
2.2 Overview of Company Position in the Industry
Company X continually develops itself to sustain business leadership in Thailand and in the region, and remain internationally competitive. To cope with the highly intense competition and volatile prices as a commodity product, the company continues to develop value-added products and broaden its range of products to increase sales of high-value non-commoditized products with high yields and little price volatility. Emphasis will be placed on on-going research and development to drive new products. The company also exports its products to many Southeast Asia countries which have great potential for further growth to create brand and product awareness among customers and to lay solid foundations for future business expansion in the region.
Chapter 3 Company Supply Chain and Customer Service
This chapter discusses about the definition of customer service which is referred to in this thesis. Then, the customer segmentation approach and the profile of the company's supply chain are discussed to describe its current practice on its customer segmentation and supply chain management.
3.1 Definition of Customer Service
In this thesis, customer services are defined as services that a company would offer its customers to motivate them to buy its main products or services.
Customer services become more important for companies to sell their products to customers as the customers pay more attention on the customer services in their buying decision process. Moreover, not only can the companies use customer services as a tool to motivate customers to buy their products, but they also can use customer services to differentiate their products from the competitors by proposing a bundle of products and customer services to their customers. However, it is very important that the companies need to understand customer needs before proposing additional services to them. Since the customers have
different needs and provide different value to the company, logically, the services proposed
to the customers should not be the same.
Currently, Company X provides several customer services to its customers. Logistics service
serve its customers in different locations. It manages transportation for the customers who require the service, however, it does not have its own truck fleets.
The Customer Service Center is one of the main divisions on which the company focuses to fulfill customer requirements by providing advice to the customers and solving any problem related to company's products and services.
Company X also develops the relationship with its customers by arranging activities, such as an annual party, overseas and domestic traveling trips, and training programs. These programs help the company get closer to its customers, and build a better relationship with them and even their family.
This thesis proposes a methodology to develop customer services by considering customer needs and customer value, and, then, deploy these customer services as drivers to segment the company's supply chain.
3.2 Customer Segmentation Approach
In this section, company's customer segmentation approach is examined to illustrate its current segmentation practice.
Currently, the company segments its customers which are dealers by considering their characteristics and behaviors: buying behavior, product characteristics, major next-tier customers, and price sensitivity. The following table shows dealers' behaviors and characteristics.
Table 3.1: Behaviors and Characteristics of Dealers in Each Channel Factor Buying Behavior Wholesale - Slow Buying Retail
- Convenient to Buy - Big Lot Buying Decision
- Focus on Relationship
- Small Lot Buying - Focus on Product Specification
Major Next- - Sub dealer
tier Customer - Transformer - Home Owner - Local Contractor - Project Owner - Contractor
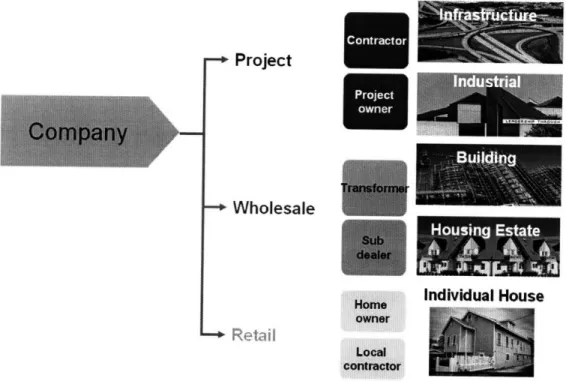
According to dealers' behaviors and characteristics, the company divides its dealers into three channels: wholesale dealer, retail dealer, and project dealer. Currently, the company has around 580 dealers located in six regions: metro, east, west, north, northeast, and south. Generally, each dealer sells its product in every channel with different portions; however, for the purpose of this thesis, each dealer is identified as a dealer type according to its major sales channel.
The figure below draws the channel network of the company.
Figure 3.1: Company's Channel Network
- Project
-+ Wholesale
Uo
Individual House
-- Retai
3.3 Profile of the Company Supply Chain
The supply chain network of Company X is mainly a local network, that is, products are manufactured and sold to customers within the country because the nature of the products are low margin to volume. The company exports some products from the production capacity left to a customer outside Thailand, with the export sales approximately 30% of the company's sales revenue, while some raw materials needed to be imported from outside the country.
3.3.1 Supply Chain Network
As customer locations are scattered throughout the country, manufacturing sites are located near the sources of raw materials. There are three main manufacturing locations for Company X - central part of Thailand, eastern part of Thailand, and western part of Thailand.
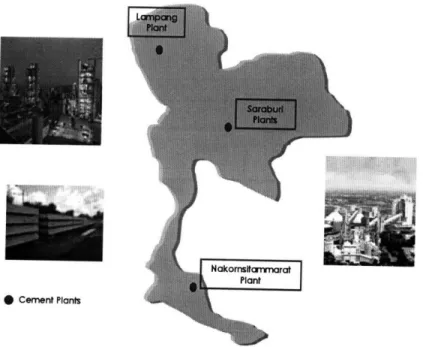
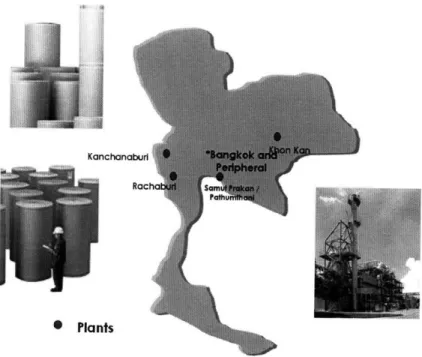
Central Part of Thailand - Cement and Construction Materials
Limestone, a key raw material for cement production, is abundant in the central part of Thailand, so most of the cement and related construction material plants are located in that area, with two small plants in the far northern and far southern part of Thailand to specifically serve customers in those areas.
Figure 3.2: Cement Plants
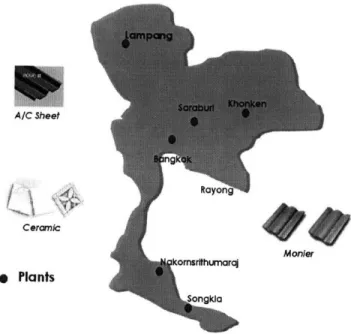
Figure 3.3: Construction Materials Plants
A/C Sheet
Ceramic
* Plants
Eastern Part of Thailand - Chemicals
As Naphtha, a key raw material of petrochemical production process, is needed to be imported, a petrochemical complex is located in the eastern part of Thailand which has sea port and facilities.
Figure 3.4: Petrochemical Plants
Western Part of Thailand - Paper and Packaging
Pulp and waste paper are key raw materials for paper production. 80% of raw materials are sourced from local suppliers who are located mainly in western and northeastern part of Thailand.
Figure 3.5: Paper Plants
Kanchan
0 Plants
Product distribution of Company X are centralized and managed by an in-house distribution group. Distribution activities include domestic sale, international trading, and logistics. The distribution network of the company, covering the areas over the country, comprises of domestic dealer network, multi-modal transportation such as truck, train, and barge, and distribution facilities such as a distribution center, hub, cross-docking area, and port.
Domestic Dealer Network
In contrast to chemicals and paper products which are mainly sold to downstream product manufacturers, cement and construction materials are distributed to end consumers via a company's registered dealer. A dealer will sell the products to a retailer or directly sell them to contractors or end consumers. In general, a dealer will have a joint marketing scheme with the company and will carry some inventories to maintain its service level to end consumers.
Transportation and Distribution Facilities
With various kinds of finished products, Company X needs to have a wide variety of transportation and distribution facilities. A product could be distributed in bulk form such as bulk cement or ready mixed concrete with special truck or barge, or could be shipped in bag or pallet by a general truck or train. The company manages distribution activities by having its own distribution facilities including a distribution center or cross-docking area while outsourcing trucking service to a partner.
Figure 3.6: Domestic Distribution Facilities
o
Distribution Center* Hub/Cross-Docking Area
I I
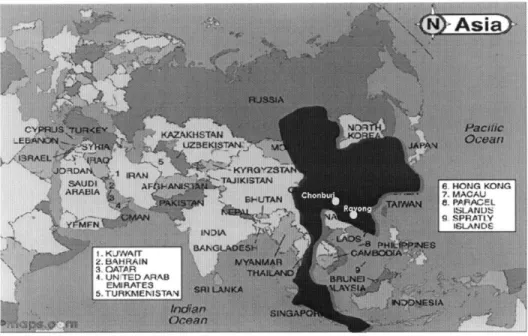
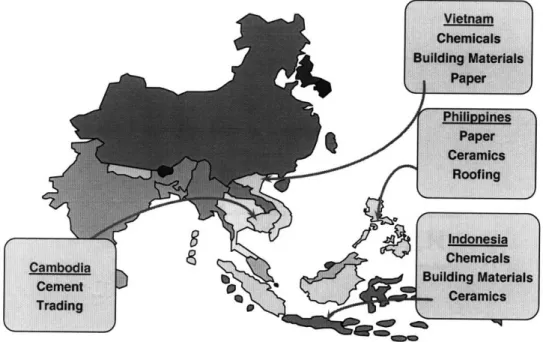
As the company also continued to expand its business into the Southeast Asia region, this makes the supply chain network be more complex as some of raw materials and finished products needed to be distributed across the countries. With imports and exports among countries, the company has concern of many additional factors including transportation, customs formalities, and rules and regulations.
Figure 3.7: Production Expansion Plan in Southeast Asia
3.3.2 Managing the Supply Chain
Similar to most of the manufacturing companies, Company X mainly focused on efficiency and utilization improvement which is the push side of the supply chain in an early stage of its supply chain management. The Total Productivity Management and Total Quality Management were adopted to reduce costs and control quality of the production processes. The company also implemented Production Planning and Scheduling for production optimization among various plant locations. Transportation Management System was introduced to increase efficiency when processing sales orders. Multi-modal Transportation was considered to reduce transportation cost, while back haul management was emphasis to improve truck utilization.
However, with increasing importance and awareness on customer side, the company has been focused a lot more on pull side of the supply chain later on. Processes have been integrated and information has been shared throughout the supply chain from production to distribution and customers for better customer response. For example, a Sales and Operations Planning (S&OP) meeting has been introduced to improve the forecasting process. This included re-processing how each party plans and shares data to achieve consensus plan which successfully increased demand forecast accuracy and also brought inventory and production cost down. In addition, for construction materials business where channel to end customer is a key success factor, customer service and customer satisfaction is important, so Customer Relationship Management was implemented to collect and analyze information regarding customer demand, and a customer survey is an important tool to get feedback and needs from customers for designing a supply chain.
In order to carry on the supply chain management task, the company set up a Supply Chain Committee to sponsor supply chain improvement activities and drive changes within the company. The company also has supply chain outside expert to support on supply chain management and improvement.
Chapter 4 Review of the Literature
This section describes recent research and articles that discuss supply chain and customer service segmentation. Later, selected material will be discussed and applied to the case in the thesis.
Two major literature topics are discussed. Firstly, the customer and market segmentation is described to provide general meanings of the customer and market segmentation, and then details of the methodology and importance of customer and market segmentation are explained. The second part explains the supply chain segmentation beginning with its definition followed with the supply chain segmentation factor and methodology.
4.1 Customer and Market Segmentation
Wendell Smith (1956) provides a perspective on market segmentation by explaining how a
provider of goods can segment a market so as to adapt the service used in relative to these goods and the goods themselves in order to most efficiently serve the part of the market it targets and achieve greater profit.
Sternthal and Tybout (2001) adds to Wendell's definition that "segmentation involves dividing the market's potential customers into homogeneous subgroups. These subgroups may be distinguished in terms of their behavior patterns, attitudes, demographic characteristics, psychographic profile, and the like" (pp. 3)
4.1.1 Segmentation Methodology
There are several different ways to do segmentation. Kumar, Petersen, and Leone (2007) suggest the way to segment customer is by customer life time value (CLV) and customer referral value (CRV). CLV is calculated from the present value of the projection of contribution margin from the customer minus the marketing expense spent for that customer, while CRV is the value of customers who joined because of a referral and that would join anyway. Furthermore, they develop the customer value matrix according to the CRV and CLV and dividing customers into four categories: miser, affluent, advocate, and champion.
Probal and Eun Kyun Kim (2007) divide segmentation methods into three categories which are demographic segmentation, psychographic segmentation, and segmentation by benefits from the products.
Cecere (2005) mentioned about segmenting supply chain to trade off between cost and responsiveness in a high complex and variability business environment. Cecere also gives "four elements of supply chain redesign" consisting of the right amount of push, the right amount of pull, the best design for reliable supply and the right mix of risk, agility, and alignment with social responsibility imperatives.
Fisher (1997) pointed out the change of business environments, since there are more innovative products and services. He proposed a very interesting approach to segment demand into two product categories- functional products which satisfy basic needs and do not change much over time , and innovative products which are new products having short life cycles and high product variety.
Yankelovich (1964) mentioned about the importance of market segmentation which has been realized from the ineffectiveness of the same market policy applied to all market segments. He also argued that traditional demography segmentation is not enough for current market situations, instead a company should create new dimensional segmentations that align with its customers, products and services. The new segmentation approach will allow a company to achieve higher competitiveness over its rivals since it provides benefit to the company in several aspects: allocating resource, developing product, forecasting market trend, and selecting market strategy.
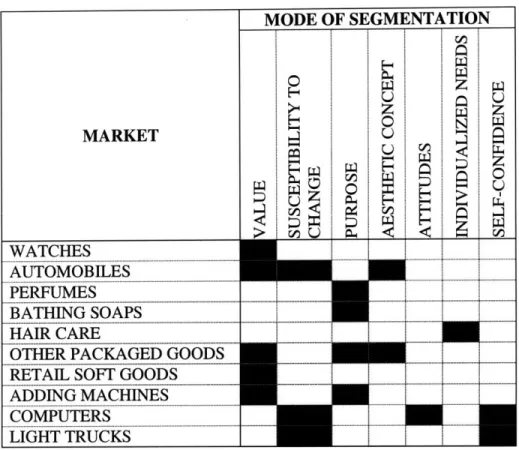
To verify insufficiency of demography segmentation and the possibility to develop different segmentation approaches, Yankelovich examined a "non-demographic segmentation" based on: "value, susceptibility to change, purpose, aesthetic concept, attitudes, individualized, and self confidence"; in ten sample markets: watches, automobiles, perfumes, bathing soaps, hair care, other packaged goods, retail soft goods, adding machines, computers, and light trucks, as displayed in the following figure;
Table 4.1: Example of Segmentation in Different Industries MARKET WATCHES AUTOMOBILES ... . .. ... .. ... .. .. ... ... . . .. ... ... . . . . .. . PERFUMES ... ... ... ... ... ----.... .. . ... ----... .... ... BATHING SOAPS HAIR CARE
OTHER PACKAGED GOODS RETAIL SOFT GOODS
ADDING MACHINES COMPUTERS LIGHT TRUCKS MODE OF SEGMENTATION U
z
0Source: New Criteria for Market Segmentation
The author comes up with the result of the proper mode of segmentation for each market, such as "value" is the best way to segment customers in the watch market, while value, susceptibility to change, and purpose are the best modes of segmentation for the automobile market.
The conclusions of this research for a company to survive in current highly competition markets are:
1) Stop using only demographical factors in segmentation approaches
2) Align all product and service strategies for the selected customer segments
~
...
[ I zi ...-...-....-...---.
...
.
.
...
...
...
.
...
I
.
...
-- ...----- -----
--
--
--/
c... I i ... t ...3) Initiate its own unique segmentation factors, rather than applying those existing in the market
This research is one of the very beginning works on developing new segmentation approaches, which help companies initiate new ideas to divide, select and reach their customers.
4.1.2 The importance of segmentation
Since Wendell's proposed concept on segmenting the customer and market, segmentation has become one of the most important factors enabling a company to gain competitiveness over the competitors in the market. Lawrence and Sheree (2004) point out that segmentation allows a company to develop and sustain its competitiveness over its rivals. Lawrence and Sheree describe loyalty as a key segmentation factor for a business's growth since loyal customers tend to keep buying goods from their preferred provider and recommend it to the others.
Segmentation enables a company to achieve higher profits by providing the right services or goods to the right customer. Basu and Eun Kyun Kim (2007) conducted a study to examine customer needs and proposed ways to segment customers for improving service while reducing cost. Their study provides the company a chance to achieve over 3 million dollars per year by changing the price policy to serve customer demand.
4.2 Supply chain segmentation
Conceptually, supply chain segmentation is the process enabling business to formulate the right product or service to its segmented customers.
Supply chain segmentation becomes very interesting and important for the company as it enables a company to develop its core strategy to increase its competitiveness in current and future environments.
Innis and La Londe (1994) studied the cause and effect between "customer service" and "customer satisfaction" and pointed out the importance of "physical distribution", which conveys a company's "customer service", as a tool to increase customer satisfaction by integrating those services into the company's marketing mix. However, "physical distribution" has always been viewed as a cost reduction factor by several companies rather than increasing customer service tool.
Lapide (2008) insists that it is necessary for companies to develop supply chain segmentations. The main reason is that it is very hard for a company to fulfill all needs from various groups of its customers with only a single supply chain. Ideally, a company may have several supply chains to be most matched to all customers' requirements, but it will enormously increase cost to the company. A successfully deployed supply chain strategy can lead the company to gain higher revenue, profit, and customer satisfaction. As a result, it is very crucial for a company to develop its supply chain segmentation, and by doing that it has to trade off between customer's satisfactions and costs.
4.2.1 Supply chain segmentation factors
It is crucial that a company needs to understand its customers' needs and their drivers of buying decisions, so that the company can develop the right supply chain, including products and services, to those customers. Mentzer, Flint, and Hult (2001) insist that a company needs to find out whether its customers have identical requirements. If customer expectations are not the same, a company can gain higher customer satisfaction by offering a differentiated set of services according to each customer segment requirement. On the other hand, if customer expectations are almost all similar, a company can gain better economy of scale by proposing a mass logistics service set.
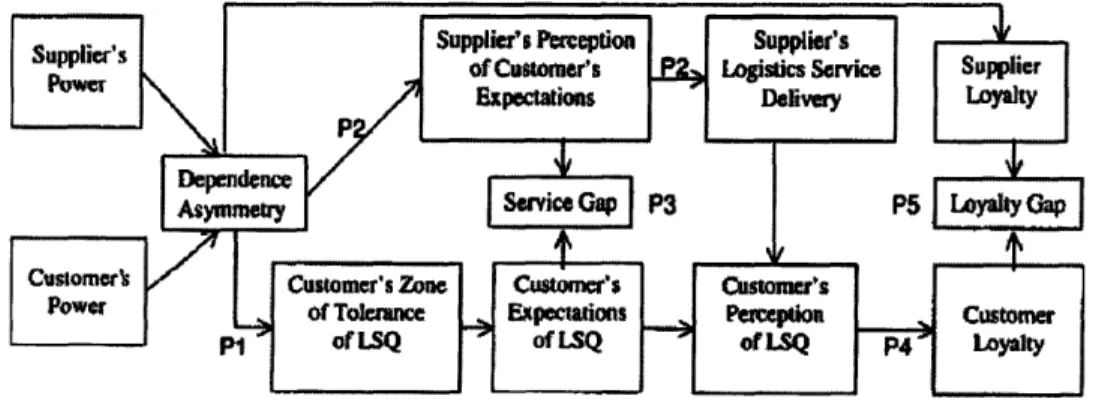
Mentzer and David (2006) research the impact of service quality perception on customer loyalty and find that there is a significant relationship between these two factors.
They demonstrate this relationship as shown in the figure below
Figure 4.1: Logistics Service Quality and Loyalty Drivers
According to the research, the service is divided into two categories: "desired service" which is a standard service that customers expect to get from suppliers, and "adequate service" which is the minimum level of service quality that customers can accept from suppliers. The gap between these two services is called the "zone of tolerance" which can be big or small mainly depending on the "customer's power" and "supplier's power". If the customer has more power than supplier, such as when the customer is the key account of the supplier, the "zone of tolerance" is expected to be bigger. On the contrary, if the supplier has more power than the customer, such as when the customer relies heavily on the supplier's raw material, the "zone of tolerance" tends to be smaller.
Davis and Mentzer also found in this research that the quality of service has a correlation with the customer loyalty as the smaller the gap in logistics service quality (LSQ) perception is, the better the loyalty relationship between customer and supplier will be. They found four key services important to customer loyalty:
1) Reliability, which means customers can count on supplier's products and services 2) Communication, such as after sale contact or providing updated information to
customers
3) Timeliness, referring to on time delivery or action done in time as promised
4) Responsiveness, which is ability to solve customer problems or set up preventive procedures to decrease the chance of problems occurring
Furthermore, the research reveals essential information that loyalty has more relationship to "intangible elements, such as handling problems and communication" than "measurable components, such as fill rates and on-time deliver"
The concept and finding from this research help a company understand more about customer expectations leading to a better way to segment customers and develop goods and services to match with expectations in each customer segment.
Mentzer, Flint, and Hult (2001) summarize that logistics service can allow a company to gain higher customer satisfaction by offering so-called the seven Rs (i.e., right product, right amount, right time, right place, right condition, right price, and right information) as a part of company's marketing strategy.
According to the research, there are nine customer satisfaction factors as described below; 1) "Personal Contact Quality" indicates the ability of a company to contact people to
acknowledge customers and solve problems for them. These people play a very important role in developing and maintaining a relationship with the customer. It's very crucial that they understand the whole company's supply chain and gain problem-solving skills, so that they can serve and support customers effectively.
2) "Order Release Quantities" means product availability, which is presumed to increase customer service level. However, this can trigger the company's inventory cost to go up since the company has to keep higher stock level to prevent stock out situations. Moreover, at the higher service level, especially near 100%, a company will have to add a lot more stock than it does at a lower service level. That means a company has to spend additional costs to achieve a higher customer service level, and at the near 100% service level that additional cost increases exponentially (Silver, Pyke, and Peterson 1998)
3) "Information Quality" means the information provided by the company is accessible and enough for a customer to choose the product or service from the company.
4) "Ordering Procedures" expresses "the efficiency and effectiveness of the procedures" that a company sets up for its "order placement procedures."
5) "Order Accuracy" means customers get what they order in terms of both right product and right amount. This is a very important factor as it serves as the most basic requirement which a customer orders from the company.
6) "Order Condition" expresses that the delivered product is in a good condition, and has no damage, when the customer receives it. Since customers are unwilling to spend their own time to solve a condition problem, even one that the supplier can fix that within a very short time, this seriously impacts customer satisfaction.
7) "Order Quality" represents the functionality of the product whether it works as the company defines it and as customers expect it.
8) "Order Discrepancy Handling" refers to a company's ability to manage a problem with an order which is a function of the speed and effectiveness with which a company can solve a problem for its customer.
9) "Timeliness" means the lead time that a company provides from the time customers order until the product is delivered to those customers. This also refers to how well the company delivers products to customers per the promised time.
Mentzer, Flint, and Hult combine "a general customer-perceived Logistics Service Quality (LSQ)" process with their nine customer satisfaction factors and come up with the "Hypothesized Model of LSQ" demonstrating the relationship among these factors as show in the figure drawn below;
Figure 4.2: Hypothesized Model of LSQ as a Process
Order Receip at... at
Order Receipt Salisfkactioin
Source: Logistics Service Quality as a Segment-Customized Process
After examining the model and hypothesis, the authors conclude that:
1. There will be at least one customer group that is concerned with all nine satisfaction factors.
2. A company should consider "LSQ" as a process not only a concept, so that it can do further analysis on the factors that impact the LSQ.
3. Some customer groups have concerns about the same LSQ factors, but some identify their concern about a different group of factors.
The authors also summarize that a company should identify its customers' requirements and segment them, so that it can develop the right product or service to fulfill those demands effectively. They insist that logistics service can be an important tool for the company to not only "improve efficiencies by reducing costs" but also "improve marketing effectiveness via customized processes that generate greater revenue for supplier firms."
4.2.2 Supply Chain Segmentation Methodology
Flint and Mentzer (2000) research and propose changes in a customer expectation from a supplier resulting from a change in customer's expected benefit They found that these changes cause differing desired values from a supplier's logistics service. The linkage between the logistics related changes in desired value and the expected benefit from customers is summarized in the table below;
Table 4.2: The Linkage between Desired Supplier Attributes and Resulting Customer Consequences
Supplier logisticians involved in projects early
Supplier become QS9000 certified
Supplier do distribution and related service design work for the customer
Supplier reduce cycle time
Supplier logistician start bar-coding
Supplier logistician customize packaging Supplier logistician provide cost saving ideas
Customers leverage logisticians, learn, reduce costs because change can be made earlier
Customer improves quality in own
processes
Customer removes costs of non-core work
Customer can bring vehicles to market faster
Customer improves inventory management
Customer improves facility utilization Customer reduces costs, learns
Supplier carry inventory Customer reduces costs
Supplier locate Customer reduces costs, improves cycle warehousing/manufacturing near customer times
around the globe
Source: Logisticians as Marketers: Their Role When Customers' Desired Value Changes I
There are changes in demand from customers, which reflects their new requirement from suppliers. This research points out these changes and enables a company to view a customer need differently and allows it to grab opportunity to gain a competitive advantage by serving the customer with new services, especially logistics-related service.
Lovell, Saw, and Stimson (2005) discuss factors that must be considered for supply chain segmentation by grouping them into four categories: Product, Market, Source, and Geographic and commercial environment, as follows:
1) Product factors refer to product value, product life cycle, product physical attributes, variety of the product and characteristics of product (e.g., functional or innovative, Fisher (1997)).
2) Market factors mean the characteristics of demand: fluctuation, consumption quantity, and dispersion.
3) Source factors refer to characteristics of its source of raw material and production process (i.e. high technology based, high fixed cost based)
4) Geographic and commercial environment mean geographic condition, local and international legislation, tax and duty, currency exchange rates.
These factors significantly impact the way a company designs its supply chain to handle its product
According to the research, supply chain design might be developed under a key cost-drivers framework. The authors summarized three major cost-drivers, which are throughput level and variability, product value density, and demand variability-service factor, and propose
designing a supply chain according to these drivers. With this concept, the authors come up with six supply chain network designs illustrated in figures below;
Figure 4.3: Six Supply Chain Network Designs
Low DEMAND VARIABILITY-SERVICE High (AVAILABILITY) FACTOR High DEMAND VARIABILITY-SERVICE (AVAILABILITY) FACTOR Low High T H R O U G H P U T Low
Low PRODUCT VALUE DENSITY High
Low DEMAND VARIABILITY-SERVICE High (AVAILABILITY) FACTOR High DEMAND VARIABILITY. SERVICE (AVAILABILITY) FACTOR Low
Low PRODUCT VALUE DENSITY High
High T H R O U G H P U T Low
Low PRODUCT VALUE DENSITY High
Source: Product Value-density: managing diversity through supply chain segmentation
The framework from this research is very useful as it allows companies to develop their supply chain segmentation. It helps identify critical factors affecting supply chain design and
point out how key cost drivers, which were derived from those critical factors, impact the way companies shape their supply chain network.
Chapter
5
Approach to Segment
The thesis explores company Y's current practice on its customer segmentation and proposed services. Moreover, customer data is gathered and analyzed to develop a supply chain segmentation model. These data are collected by three approaches: customer survey, sales data analysis, and interview with sales and marketing personnel.
5.1 Customer Survey
Company Y uses customer surveys in three channels: wholesale, retail, and project. This covers six regions: metro, west, east, north, northeast, and south. A set of these customer surveys recently performed by the company is reviewed and analyzed to get current and future customer requirements divided into major decision factors, such as lead time, brand preference, credit term, after sales service. In this part, the main objective is to determine the important service attributes that influence customers' purchasing decisions and to realize the service level that customers need for each service attribute.
5.2 Sales Data Analysis
Company Y keeps its sales records electronically in a data warehouse enabling it to track and analyze customer behavior. In 2007, the company extended the scope of data collected from company-buyer level to buyer-end user level, which increases its ability to explore customer behaviors. In this thesis, historical data of sales record is collected to analyze customer behavior and contribution to the company. Sales, profit, continuity, product, company size, geography, and coverage (for retailer customer) are examined and analyzed to segment and rank a customer based on these factors. Below are criteria to select the data for examining;
b. Selected Customers: 78 out of 580 dealers, representing 75% of total revenue (because so far there have been 78 dealers that joined the integration data program with the company)
c. Cover Three Channels: Wholesale, Retail, and Project,
d. Cover Six Regions: Metro, West, East, North, Northeast, and South e. Data Detail: Collected at Order Transaction level
5.3 Interview with Sales and Marketing Personnel
Additional research is performed by interviewing sales and marketing personnel who have a close contact with customers. Their input about customer requirements both current and future is contributed to develop the customer segmentation. The questions for the interview are listed as below;
Current Environment Base
* How do you categorize/segment your customers?
* What are (the most important) factors/criteria for this segmentation? * What is your strategy/action responding to customers according to the
segmentation?
* Are there pros/cons according to using current customer category/segmentation?
* What else will you do (or are you going to do) to fulfill or increase customer satisfaction?
Future Environment Base (Expected)
* In you opinion, what would customer requirements be in the future? * How would you redesign the customer category/segmentation according to
* What would be (the most important) factors/criteria for this segmentation? * What would be your strategy/action responding to customers according to
this new segmentation?
All collected data is reviewed, analyzed, and used for developing a supply chain segmentation model which is described in detail in Chapter 7.
Chapter 6 Data Collection and Analysis
This chapter discusses the analysis of data collected from all three sources: customer surveys, sales data analysis, and interviews with sales and marketing personnel. The main objective of the analysis is to formulate push-pull segmentation factors; a push segmentation factor is the factor from the company's point of view that the company uses to categorize its customer, and pull segmentation factor is the factor from customer's point of view that drives a customer to buy goods and/or services from the company. This push-pull segmentation factor takes a very important role in developing the supply chain segmentation model which is discussed in the next section.
The analysis is divided into three parts. First, it describes the overview of company's current sales performance from each channel and region. Second, the analysis on dealer's contribution, potential, and loyalty is introduced to form push segmentation factors. The last piece of analysis is discussed about formulation of pull segmentation factors which are mainly derived from the survey data analysis and the interview with sales and marketing managers.
6.1 Sales performance Analysis
This section provides analysis on the sales performance of each channel to describe an overview of the sales performance of each channel
Most of the products that Company Y sells are construction materials, as a result, the seasonal factor has an impact on company's sales pattern during the year.
Figure 6.1: Company Y's Sales Revenue in 2007
Sales Revenue in Y2007 ($Million) 600UU 500 400 300 200 100 0 1 2 3 4 5 6 7 8 9 10 11 12 Sales 426.473 398.835 508.392 358.273 416.721 393.451 371.381 370.792 403.274 358.266 371.581 356.145 Month
Figure 6.1 indicates Company Y's sales record and pattern during the year. The company sold 53% for the first half of the year and 47% for the second half. As mentioned earlier, seasonality has an effect on the company's sales; it is the raining season in the second half of the year, which lowers construction projects in this period.
Table 6.1 depicts the sales of the company sold through each channel.
Table 6.1: Sales Performance by Each Channel
SI otalI I 9,^41 503,169Y 4,669I
From the above figure, it is indicated that the wholesale channel has the biggest sales portion, $2,627 million, with 225,255 transactions and 3,676 next-tier customers. Retail channel's sales are the second, with $1,467 million, with 201,586 transactions and 4,147 next-tier
customers. The smallest-sales-portion channel is the project with 76,328 transactions and 1,241 next-tier customers.
Figure 6.2: Portion of Customers, Transactions, and Revenue of Each Channel
PRi-tiCii of 'i1ismtoiuers 14% Poiticin of Tiansactions '*170 Portion of Revenue 12%• m1 Wholesale I Retail EI Project
Figure 13 demonstrates the portion of customers, transactions, and revenue of each channel. It is shown in the figures that the wholesale channel has the highest portion in every area considered, followed by the retail channel and the project channel, respectively.
6.2 Push Factors Analysis
The objective of this section is to analyze dealer characteristics and attributes in each channel to formulate the customer segmentation factor from the company's perspective, named the "push segmentation factor". Furthermore, the analysis is made on each channel separately because each contains different characteristics.
As mentioned earlier, because of the limitation of data, this analysis includes 78 out of 580 dealers, which represent around 75% of total revenue, and they are evaluated and ranked
according to their contribution, potential, and loyalty from the company's point of view.
Contribution used for evaluating is measured as the initial margin that company Y gets from
selling goods to dealers. There are three levels in this criterion: 1) highest contribution; 2) medium contribution; and 3) lowest contribution. The following table defines the criteria of each level;
Table 6.2: Condition for Contribution Level
Potential is measured by evaluating a dealer on several aspects: vision, the size of the firm,
payment discipline, the number and importance of next-tier customers in its account, and the location of the store. There are three levels in this criterion: A, high potential; B, medium potential; and C, fair potential. The following table describes the measurement of the potential in each level, and it is followed by definitions of the elements.
Table 6.3: Condition for Potential Potential g Level C O 1 Y >200 >5 E G 2 100-200 3-5 G 3 N <100 <3 N
* Future direction is measured by the alignment between the dealers' business direction and the company's. The result is "Y" if it is aligned and "N' if it is not: the alignment is determined by the company.
* Count of customers is the number of customers that are in the dealer's account. For each channel, this condition is divided into three levels: equal to or more than 200; between 100 and 200; and less than 100
* Capital is the dealers' registered capital, which is divided into three levels: equal to or more than $5 million; between $3 million and $5 million; and less than $3 million. * Payment discipline is measured by the dealer's on time payment history. Most dealers
have an excellent (E) record and make payments on time; however any dealer who makes late payments not more than 2 times a year will be recorded as a good (G) payment dealer. Since there are no dealers making late payment more than 2 times per year, there are only two levels, excellent and good, in this measurement.
* Store location is considered whether the dealer's store is located in a good (G)
location, located on a main road, or not (N), located on a local road.
Dealers are ranked as A, B, or C.
A dealer ranked as a class-A dealer has to have its future direction aligned with the company's, and gets potential level 1 in other three out of four criteria. A dealer ranked as a class-B dealer has to have its future direction aligned with the company's, and gets potential level 1 in other two out of four criteria. A dealer ranked as a class-C dealer does not have its future direction aligned with the company's, or has its future direction aligned with the company's but gets potential level 1 in other criteria in less than two out of four.
Loyalty is defined according to the membership status of a dealer in company Y's loyalty program. As of now this program has not been fully implemented yet, and it may not really reflect the loyalty level of the dealer. However, for the purposes of preliminary model development, this is allowed and assumed to be fully implemented for the real implementation of the model for this thesis. There are two types defined in this criterion: Y, membership in the loyalty program; N, non-membership in the loyalty program.
All dealers are measured with the three criteria of contribution, potential, and loyalty and ranked according to conditions described as below;
Group 1: The dealer must be best in all three criteria.
Group 2: The dealer is not eligible for Rank 1, and must at least get level 2 in contribution, class B in potential, and Y in loyalty.
Group 3: The dealer is not eligible for Rank 1 and 2, and must not be in the lowest level in two out of all three criteria.
Group 4: The dealer is in the lowest level in at least two out of three criteria.
The above mentioned criteria can be illustrated by the following table;
Table 6.4: Criteria for Push Segmentation Factor Ranking
Derived from collected data and defined criteria, the followings are the results for each
There are thirty dealers in this channel; five dealers are in the first rank, eight dealers are in the second, thirteen dealers are in the third, and four dealers are in the fourth.
7,459,667 1 1,175,171 2 1,872,269 2 3,458,449 1 574,553 3 3,909,008 1 1,064,152 2 2,181,220 2 2,073,022 2 1,868,144 2 704,753 3 2,559,752 2 3,929,985 1 3,172,142 1 3,870,575 1 2,595,968 2 1,629,847 2 2,745,198 2 1,944,634 2 2,925,876 2 5,485,535 1 1,201,179 2 2,294,359 2 2,201,570 2 3,398,517 1 1,622,868 2 7,691,931 1 1,262,422 2 1,919,365 2 1,347,070 2 No Yes No No No Yes Yes Yes Yes Yes Yes No No Yes Yes Yes No Yes Yes No Yes Yes No No Yes No No No Yes No 1 2
3
2 2 3 1 23
3 1 3 3 4 2 4 Wholesale Channel ~I~Ptni
al Lyat
Retail Channel
There are thirty six dealers in this channel; three dealers are in the first rank, three dealers are in the second, eighteen dealers are in the third, and twelve dealers are in the fourth.
-ae
Poftbly
_
_nil
319,081 1,447,957 718,371 292,531 654,264 443,386 727,882 1,320,205 868,750 360,840 750,779 903,440 90,932 346,490 1,349,301 594,954 335,559 792,269 2,392,758 2,534,867 537,669 210,221 1,338,754 595,897 261,622 2,761,634 315,576 203,371 758,907 791,015 3,697,041 804,021 4,846,404 1,301,236 112,962 48,343 3 1 2 3 2 3 3 1 2 3 2 2 3 3 1 2 3 2 1 1 2 3 1 2 3 1 3 3 2 2 1 2 1 1 3 3 B A B C B B A A C B A A C A A B A B A A C C A B A A B C B B A A A C A C No No No No Yes No No Yes Yes No Yes Yes Yes No No No Yes No Yes No Yes No No No Yes Yes No No No No No Yes No No Yes No 4 3 3 4 3 4 4 1 3 4 2 2 4 4 3 3 3 3 1 3 3 4 3 3 3 1 4 4 3 3 3
2
34
34
Project Channel
There are twelve dealers in this channel; one dealer is in the first rank, two dealers are in the second, seven dealers are in the third, and two dealers are in the fourth.
828,943 372,397 507,941 2,574,703 249,833 1,526,464 396,142 554,451 2,881,793 3,876,877 538,146 685,856 - il '1 No Yes No No No Yes No No Yes No Yes No
6.3 Pull Factors Analysis
This section explains the analysis on the survey data, dealers' profiles, and interview data which help in developing the customer service drivers, called "pull segmentation factor"; the factor, from customer's perspective, that influences a customer's decision making process to buy goods from the company. Also provided in this section is the list of required services describing the details of service derived from each pull factor.
Survey Results: the surveys were done with different formats in each channel and region to fit with customers in the area. After looking into the results of the surveys, we find a set of customer's needs. These needs are expressed in the way to both improve existing services and add more services.
Dealer's Profile: by considering a dealer's facility, financial capability, buying behavior, and truck availability, this information allows us to assess a customer's hidden needs which are not indicated in the customer surveys.
Interview Data: the interviewees provided their perspective on customer needs and the way that Company Y and they respond to fulfill these needs, both currently and in the future.
To develop and summarize customer's needs in this section, it is necessary to review and analyze all data simultaneously because they are all linked together. By considering all above three areas of analysis, the following are the list of five pull segmentation factors.
1. Product
There are two key concerns in this area. One is the variety of the product sold, and another is the product availability. The variety allows the dealer more chance to increase revenue by broadening its range of products provided in the store. Meanwhile, the product availability helps the dealer gain customer satisfaction by reducing stock out situations. However, these two also cost the dealer more as it tends to be faced with more inventories from that greater variety and availability of products.
2. Order Process
The order process reflects a customer's need into ways to reduce the time and complication of the order process.
3. Service
This mainly involves after-sales services which the company can provide as extra services to increase customer satisfaction. The services include, for example, technical support, damage and claim handling, and training & seminars.
4. Logistics
Logistics is one of the key services required by the dealers as it directly impacts their selling opportunity and cost. The services are divided into four main areas: transportation, warehouse, track and trace systems, and knowledge sharing.
5. Financial Support
Some dealers are faced with financial constraints which may limit their ability to sell or even expand their business. Providing a longer credit term and credit line should allow the dealers to gain more ability to overcome these constraints.
The following tables provide more details of the services needed under each pull factor for each channel.
Table 6.5: Wholesale Channel- Required Services Derived from Pull Factors
Product
-Availability
Order Processing
- Integration
-Order to Deliver Lead time
Service
- Technical Support
-Damage/Claim Handling
-Training & Seminar
- Promotional Material
-Relationship Activity
Logistics I Financial Support
-Storage Provision
-Urgent Order Delivery
-On time Delivery
-Status Tracking Inf.
-Knowledge: Fleet Mgmt
-Knowledge: Inventory Mgmt
-Credit Line
- Credit Term
- Over Credit Ordering
Product Service w
Table 6.6: Retail Channel- Required Services Derived from Pull Factors
Product Order Processing
- Variety - Availability
I
-- Integration
Service
-Sales Rep. Visit/Call
-Damage/Claim Handling
-Training & Seminar - Promotional Material
-Relationship Activity
Logistics
- Storage Provision
- Urgent Order Delivery
- Consolidation
- Status Tracking Inf.
- Knowledge: Fleet Mgmt - Knowledge: Inventory Mgmt Financial Support - Credit Line - Credit Term ~
Pull egmenationFacto
" -'Table 6.7: Project Channel- Required Services Derived from Pull Factors Pul SemnainFco - Variety -Availability -Quotation Response -Price Discount - Technical Support - Damage/Claim Handling
- Training & Seminar - Co-Approach End User
- Relationship Activity
Logistics
-Urgent Order Delivery
-On time Delivery
-Status Tracking Inf.
Financial Support
-Credit Line
-Credit Term
There are some similarities in the factors among three channels such as product availability, damage and claim handling, status tracking information, and credit line. However, since customers in each channel have different usage behaviors, there are some differences among the factors in these three channels as well.
Chapter 7 Segmentation Model Development
This chapter reviews and combines the results attained from the previous chapter, Data Collection and Analysis, to develop a supply chain segmentation model.
The supply chain segmentation model is developed by the following two steps:
1. Combining push and pull segmentation factors, which gives a push-pull segmentation matrix
2. Segmenting customers and developing sets of services offered based on the push-pull segmentation matrix
7.1 Combining Push and Pull Segmentation Factors
Push Segmentation factors are driven by the company's perspective on customer segmentation, while Pull Segmentation factors provide segmentation criteria according to the customer's perspective. Combining these two groups of factors, the company gets perspectives from both the company and the customers, which helps it to initiate a supply chain segmentation that balances powers; push factors tend to weigh more of a company's benefit and, as a result, limit customer response. Meanwhile, pull factors drive the company to focus more on fulfilling customer satisfaction causing greater cost to the company. By combining push and pull segmentation factors, we get a push-pull segmentation matrix for each dealer in each channel. This push-pull matrix is a tool for segmenting customers and developing sets of services which are discussed in detail in the next section. (The Push-pull segmentation matrix is shown in the appendix)
7.2 Segmenting Customers and Developing Sets of Services Based on the Push-Pull Segmentation Matrix
Based on the push-pull segmentation matrix, we segment customers and develop sets of services to match up with these customer groups. These services are defined and customized to be the best match to the customers by considering their push-pull segmentation factors.
The following figure illustrates the expected result of the matching of sets of services to each group of customer.
Figure 7.1: Matching Sets of Services to Groups of Customers
Customer
Service Sets
Seu..
From the figure, customers in group 1 are served with service set 1 which is formulated based on the customer needs and characteristics in group 1, while customers in group 2 and 3 are served with service set 2 and 3 with the same idea, accordingly.
Analyzing from the actual data, the followings are the matching between the customer segments and the services offered for each channel. This is followed by an explanation of the rationale and a description of the services.
-- - 11~1 11111 - --- ----^C