READ THESE TERMS AND CONDITIONS CAREFULLY BEFORE USING THIS WEBSITE. https://nrc-publications.canada.ca/eng/copyright
Vous avez des questions? Nous pouvons vous aider. Pour communiquer directement avec un auteur, consultez la première page de la revue dans laquelle son article a été publié afin de trouver ses coordonnées. Si vous n’arrivez pas à les repérer, communiquez avec nous à [email protected].
Questions? Contact the NRC Publications Archive team at
[email protected]. If you wish to email the authors directly, please see the first page of the publication for their contact information.
NRC Publications Archive
Archives des publications du CNRC
This publication could be one of several versions: author’s original, accepted manuscript or the publisher’s version. / La version de cette publication peut être l’une des suivantes : la version prépublication de l’auteur, la version acceptée du manuscrit ou la version de l’éditeur.
Access and use of this website and the material on it are subject to the Terms and Conditions set forth at
Seasonal variations in formaldehyde concentrations in homes
insulated with urea-formaldehyde foam
Sullivan, J. L.; Shirtliffe, C. J.; Svec, J. M.
https://publications-cnrc.canada.ca/fra/droits
L’accès à ce site Web et l’utilisation de son contenu sont assujettis aux conditions présentées dans le site LISEZ CES CONDITIONS ATTENTIVEMENT AVANT D’UTILISER CE SITE WEB.
NRC Publications Record / Notice d'Archives des publications de CNRC:
https://nrc-publications.canada.ca/eng/view/object/?id=5da7fff2-0b3c-4518-a069-1983791ec13a https://publications-cnrc.canada.ca/fra/voir/objet/?id=5da7fff2-0b3c-4518-a069-1983791ec13a
TB1
N21d
'
National Research Conseil nationalo.
1385
I+
Council Canada de recherchar Canadac. 2
BLQG
Institute for lnstitut deResearch in recherche en
- - Construction construction
Seasonal Variations in Formaldehyde
Concenfrafions in Homes lnsulafed
with Urea-Formaldehyde Foam
by J.L. Sullivan, C.J. Shirtliffe and J.M. Svec
Reprinted from
Transactions, Indoor Air Quality in Cold Climates: Hazards and Abatement Measures
APCA Specialty Conference Ottawa, Ontario, April 1985 p. 191 -207
(IRC Paper No. 1385)
A N A L Y Z E D
I
Price $3.00! NRCC 25996
i
36-
OH-
1
EJ
iABSTRACT
Recent s t u d y i n d i c a t e s t h a t o u t d o o r t e m p e r a t u r e i n f l u e n c e s room a i r and w a l l c a v i t y formaldehyde c o n c e n t r a t i o n s i n most, but n o t a l l , homes c o n t a i n i n g formaldehyde i n s u l a t i o n .
Une 6 t u d e r g c e n t e a r&v616 que l a t e m p 6 r a t u r e e x t 6 r i e u r e i n f l u e s u r l ' a i r i n t g r i e u r e t s u r l e s c o n c e n t r a t i o n s de formaldghyde dans l e s c a v i t g s d e s murs de l a p l u p a r t mais non p a s de t o u t e s l e s maisons i s o l 6 e s 5 l a MIUF.
SEASONAL VARIATIONS IN FORMALDEHYDE CONCENTRATIONS IN HOMES INSULATED WITH UREA-FORMALDEHYDE FOAM
John L. Sullivan, University of Western Ontario Cliff J. Shirtliffe, Jana M. Svec, National Research Council-, Canada
This study was conducted for the purpose of investigating a suspected rela- tionship between residential air-borne formaldehyde and one or more seasonal factors. For that purpose, indoor air and wall cavity formaldehyde analyses were performed for a one year period on 26 London, Ontario, homes with urea- formaldehyde foam insulation (UFFI) and 6 control homes without it. Simultan- eous measurements of meteorological variables were also made. The sampling and analytical methods used were the revised U. S. National Institute for Occupational Safety and Health (NIOSH) chromotropic acid procedure and Pro-
I
I Tek C-60 passive dosimeters.
The results by both methods showed a seasonal relationship between indoor air and wall cavity formaldehyde concentrations which was positive for outdoor temperature and absolute humidity. However, some homes responded differently to seasonal variables than others. While all homes containing UFFI showed variations in wall cavity formaldehyde, only about 60 percent showed corres- ponding room air fluctuations. These were described as UFFI-Responders. Those which did not show the relationship were called UFFI-Nonresponders. Wind direction and velocity showed a positive correlation with formaldehyde concentrations in wall cavities for both responder and nonresponder homes. Construction factors were assumed to be responsible for the differences between responder and nonresponder homes but were not identified.
Reprinted with permission from the transactions Indoor Air Quality in Cold Climates: Hazards and Abatement Measures, - -- published in 1986 by the Air Pollution Control Association.
I
INTRODUCTIONIn the latter part of 1980, increasing concerns about the health effects of formaldehyde gas led to a temporary ban on UFFI, in Canada, late in 1980. This ban became permanent in April 1981. Soon after, a grant program was instituted by the federal government. Initially, eligibility for assistance, in any individual case, was to be based upon a demonstrated concentration of one tenth of a part per million (0.1 ppm) of formaldehyde. This condition, which was later dropped, had been adopted as a provisional standard by the government and was based upon a recommendation from Health and Welfare Canada. The same value had also been recommended as a ceiling concentration by the American Society of Heating Refrigerating and Air Conditioning Engineers
(ASHRAE [
3
.
After the introduction of the home-owner assistance program, large scale testing of formaldehyde in homes began to take place. Most of this was initiated by the federal government but private consultants and similar organizations
were also involved. In 1981, the University of Western Ontario Occupational
Health and Safety Resource Centre (OHSRC) tested over 100 homes, for their
owners, in London, Ontario. About 30 percent of these showed formaldehyde concentrations in excess of 0.1 ppm.
A noticeable feature of these tests was that formaldehyde concentrations were generally lower in the fall and winter. This was demonstrated, also, when the same homes were repeat-tested as shown in Table 1. To confirm these find- ings, the study, reported here, was conducted jointly by OHSRC and the UFFI-Unit of the National Research Council. This test program was started in the summer of 1982 and completed by summer in 1983. It involved testing of 32 homes on six occasions, including the autumn and winter. The total sample of 32 homes consisted of 26 in which UFFI had been installed and six others which had never contained UFFI. These six were used as controls. All of the control homes were less than five years old when the survey started. This period was selected as it was approximately equivalent to the age of the urea-formaldehyde foam
I
insulation in the homes selected for the study.SURVEY METHODS
Or~anizat ion
The formaldehyde testing schedule was programed in six series in August, October and December 1982 and January, April and July 1983. These have been
identified, here, as Series 1 to 6. In each series, two room air formaldehyde
measurements were made in single-storey homes and four in two-storey homes. Wall cavity formaldehyde tests, using both Draeger and Gastec detector tubes at approximately 10 feet intervals, were also made in the outside walls of the UFFI-insulated homes. After initial tests had shown no detectable concentra- tions of formaldehyde in the wall cavities of control homes, further testing of these was abandoned. The meteorological parameters, measured, were outdoor temperature and humidity, wind direction and speed and barometric pressure.
Before testing, the occupants of the homes were asked to keep windows and doors closed, as far as possible, for approximately 18 hours. They were also asked to refrain from using air conditioners and ventilation fans and from cooking, smoking and operating motor vehicles in attached garages for the same
Sampling and A n a l y s i s
Indoor a i r Sam l e s were c o l l e c t e d and a n a l y z e d by t h e modified NIOSH method
I
proposed by M i k s c h [ q ~ , A c t i v e Oakridge S i e v e Tubes (AORST) and t h r e e commercially a v a i l a b l e p a s s i v e d o s i m e t e r s . The t h r e e commercial d o s i m e t e r s were t h e Pro-Tek C-60, t h e A i r Q u a l i t y Research (AQR) PF-1 and t h e 3M, S e r i e s 3750. The a c t i v e NIOSH and AORST p r o c e d u r e s showed good agreement w i t h each o t h e r and w i t h t h e t h r e e d o s i m e t e r s . A c t u a l comparisons of t h e r e s u l t s of t h e methods a r e t o b e p u b l i s h e d e l s e w h e r e and f o r t h e p r e s e n t paper o n l y , t h e NIOSH and Pro-Tek r e s u l t s a r e used.
For t h e modified NIOSH method, samples were c o l l e c t e d by midget impinger, c o n t a i n i n g one p e r c e n t sodium b i s u l p h i t e s o l u t i o n , f o r 4-hour p e r i o d s a t one l i t r e p e r minute a i r f l o w r a t e s . The b i s u l p h i t e s o l u t i o n h a s been s h o w r 1 [ ~ , ~ 1 t o p o s s e s s good sample s t a b i l i t y , a f t e r c o l l e c t i o n , w i t h o u t r e f r i g e r a t i o n .
A c t u a l l y , a l l samples were r e f r i g e r a t e d and a n a l y z e d w i t h i n 1-3 days f o r t h i s p r o j e c t .
The r e l i a b i l i t y and a c c u r a c y of t h e NIOSH method f o r low c o n c e n t r a t i o n s of formaldehyde have been t h e s u b j e c t of d i f f e r i n g r e p o r t s . One r e c e n t s t u d y i n d i c a t e d t h e method was a c c u r a t e and r e l i a b l e p r o v i d i n g i t was em loyed i n
57
a s s o c i a t i o n w i t h a s t a n d a r d i z e d Sam l i n g and a n a l y t i c a l p r o t o c o l [
.
A s e n s i t i v i t y of a b o u t 0.01 ppm was a l s o r e p o r t e d f 6 ] . On t h e o t h e r hand, an e r r o r a n a l y s i s performed on t h e r e s u l t s of an e x t e n s i v e Canadian survey i n d i c a t e d an u n c e r t a i n t y of 38 p e r c e n t a t 0 . 1 ppm formaldehyde[ 71. T h i s s t u d y c a s t c o n s i d e r a b l e doubt on t h e v a l i d i t y of any r e s u l t s of l e s s t h a n 0 . 1 ppm.I n t h e OHSRC s t u d y i n London, O n t a r i o , g r e a t c a r e was t a k e n w i t h t h e sampling and a n a l y t i c a l p r o c e d u r e . A l l pumps were c a l i b r a t e d b e f o r e and a f t e r each u s e and t h e r e s u l t s were d i s c a r d e d i f d i f f e r e n c e s of more t h a n 5 p e r c e n t between t h e two v a l u e s were measured. A f r e s h c a l i b r a t i o n of t h e a n a l y t i c a l
method was a l s o c a r r i e d o u t f o r e v e r y b a t c h of samples.
h The p a s s i v e d o s i m e t e r s (Pro-Tek C-60) were exposed f o r 7-day p e r i o d s . Both
t h e NIOSH sample and t h e Pro-Tek C-60 were t a k e n on t h e windward and leeward s i d e s of each house. For two s t o r e y h o u s e s , two d o s i m e t e r s were p l a c e d on each f l o o r i n rooms o t h e r t h a n k i t c h e n s , bathrooms and l a u n d r i e s . A l l d o s i m e t e r s were hung from t h e c e i l i n g s a t l e a s t 50 cm from w a l l s a t a p p r o x i m a t e l y human b r e a t h i n g h e i g h t . A f t e r e x p o s u r e , a l l d o s i m e t e r s were d i s p a t c h e d immediately t o a n o t h e r l a b o r a t o r y (IEC Beak C o n s u l t a n t s L t d . ) f o r a n a l y s i s . F i e l d unexposed b l a n k s were s u b m i t t e d i n c o n j u n c t i o n w i t h e v e r y sample and f o u r l a b o r a t o r y
b l a n k s were a l s o i n c l u d e d w i t h each b a t c h .
Wall c a v i t y formaldehyde a n a l y s e s were made by Draeger and Gastec d e t e c t o r t u b e s . These t e s t s were performed from i n s i d e t h e homes t h r o u g h h o l e s bored i n t h e lower p a r t s of w a l l s a t 1 0 f e e t i n t e r v a l s around t h e home p e r i m e t e r s . By sampling from i n s i d e , t h e u s u a l l o s s of s e n s i t i v i t y of t h e d e t e c t o r t u b e s a t low t e m p e r a t u r e s was removed. Samples were a l s o c o l l e c t e d on t h e windward and leeward s i d e s by t h e NIOSH method.
RESULTS Formaldehyde i n Room A i r
When t h e r e s u l t s of t h e formaldehyde i n a i r a n a l y s e s were examined, o n l y 1 5 of t h e 26 UFFI-homes showed a r e s p o n s e t o s e a s o n a l change. The remaining e i g h t s t a r t e d a t a b o u t 0 . 0 5 ppm i n t h e f i r s t t e s t s e r i e s and d i d n o t change a p p r e c i a b l y throughout t h e survey. F o r . i d e n t i f i c a t i o n p u r p o s e s , t h e two s e t s
I
of homes were termed "responders" and "nonresponders". A third set consisting of the remaining three UFFI-homes from which the foam had been removed earlier in the survey, were termed "UFFI-removed".Thus, the homes were classified, as follows:
Controls : Homes in which UFFI had never been installed;
UFFI-Responders: Fifteen UFFI homes which showed an obvious seasonal
change in room air formaldehyde concentrations;
UFFI-Nonresponders: Eight UFFI homes which showed no clear evidence of a
seasonal change in formaldehyde;
UFFI-kemoved : Three UFFI homes from which the foam had been removed
after the second series of tests. Five other foam removals occurred after the fifth series but were
left in their original classifications for the summary calculations.
The average concentrations of room air formaldehyde and other data are given for the modified NIOSH method in Table 2 and for Pro-Tek C-60 dosimeters in Table 3.
Figures 1 and 2 also show the series averages for the four classifications. Both figures show evidence of seasonal effects for the UFFI-responder classifi- cation but none for the other three. Statistical analysis indicated that only the UFFI-responder classification had significant differences between any pairs of series.
Comparisons between the different series, measured by the NIOSH method, indicated significant differences between August-September, 1982, and December, 1982 (p<0.05), between August-September, 1982 and January, 1983 (p<0.05) and
between January, 1983, and July, 1983, (p<0.05). The results obtained by Pro-
I Tek C-60 dosimeters showed the same comparisons between equivalent pairs but
in addition indicated significant differences (p<0.05) between both October, 1982 and November, 1982, and both December, 1982, and January, 1983, (p<0.05).
The very high Series 6 results (July 1983), shown for House
4,
in bothTables 2 and 3 probably occurred because the house was closed and unoccupied
for several months prior to the test. Also, on the day of NIOSH test
able
2),the outdoor temperature was unusually high.
The differences between the UFFI-responder and UFFI-nonresponder averages
were significant (p<0.01) only in Series 1 (Aug., 82) and in Series 6 (July 83).
In the case of the Control home classification, the results were notable in that their measured formaldehyde concentrations were only exceeded by the UFFI- responder homes. For the first five series, the Control home average formalde- hyde concentrations exceeded both the UFFI-nonresponder and UFFI-removed
classifications.
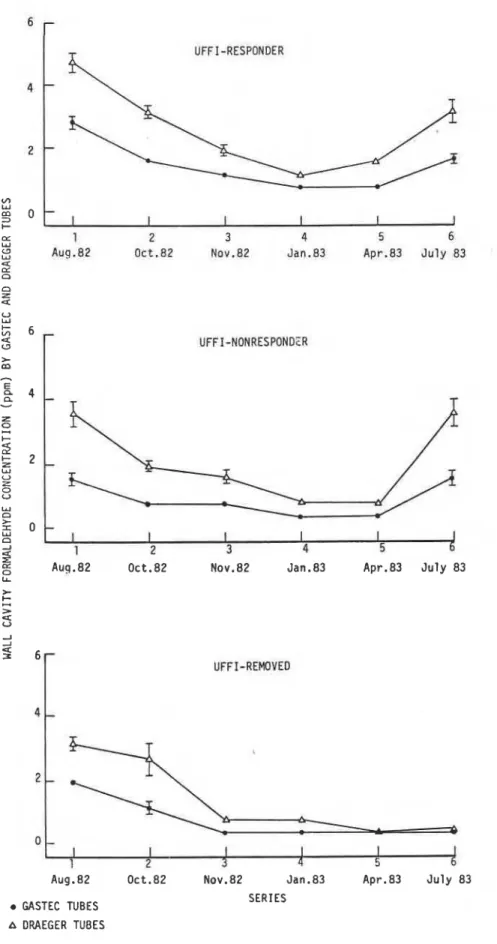
Wall Cavity Measurements
Arithmetic average wall cavity formaldehyde concentrations, measured by Draeger and Gastec tubes, are given in Figure 3. Control homes which showed no detectable wall cavity formaldehyde concentrations were not included in the table. It is apparent that seasonal wall cavity trends occurred for all homes in which UFFI was installed. By contrast to the absence of a room air seasonal trend for Nonresponders, one clearly existed for wall cavities. Significant
I
seasonal differences were found for both the Responders and the Nonrespondersj
and the trends were very similar for both groups. For the three UFFI-removed homes, the expected reduction in wall cavity formaldehyde concentrations, to below detectable level, occurred soon after the foam was taken out.METEOROLOGICAL DATA
The meteorological variables which were considered as possible influences on formaldehyde concentrations were:
a) temperature b) humidity c) wind direction d) wind velocity e) barometric pressure Temperature
The average outdoor temperatures varied through approximately 20°C in Series 1 (Aug., 82), lo°C in Series 2 (Oct., 82), 0°C in Series 4 (Jan., 831, 4 . 5 " ~ in Series 5 (Apr., 83) to 23'~ in Series 6 (July, 83). Temperature
-
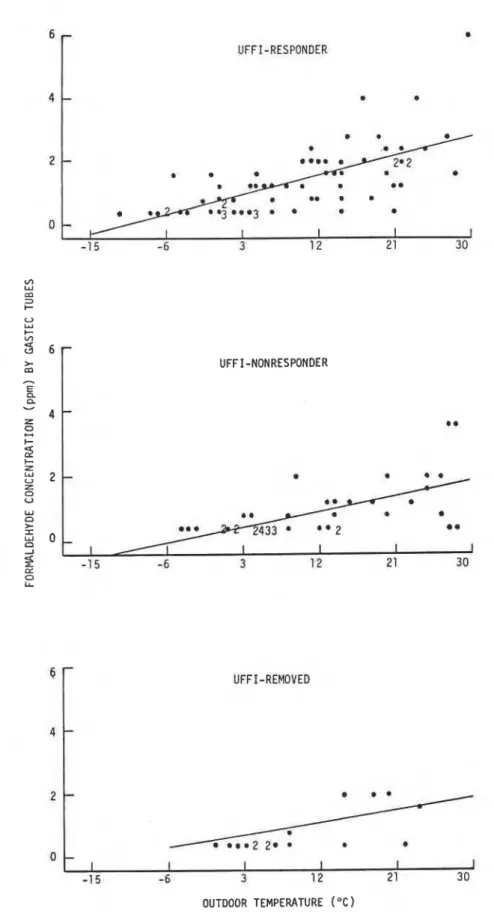
room air formaldehyde plots for UFFI-responders, Nonresponders and Controls are shown in Figure4.
Statistical analysis of the results shown in thefigure gave a positive correlation (~<0.02) only for the UFFI-responder class- ification. Though a positive relationship between temperature and formaldehyde concentrations for the Control classification also appears to exist in Figure 4, it was not statistically significant.
Equivalent values for the wall cavity formaldehyde concentrations corre- sponding to the temperatures measured are shown in Figure 5. Analysis of these results indicated a strong correlation (p<0.001) between temperature and formaldehyde for both UFFI-responder and UFFI-nonresponder homes.
Humidity
Outdoor relative humidity readings for the various seasons showed no sub- stantial changes. They were about 10-15 percent higher in winter than in summer. No trends between formaldehyde concentrations and relative humidity were found though regression analysis showed slight positive correlations between relative humidity readings and formaldehyde concentrations for all classifications, but they. were not statistically significant.
Wall cavity formaldehyde concentrations indicated no correlation with out- door relative humidity for UFFI-responders, but the UFFI-nonresponders were significantly negatively correlated (~~0.05). This latter correlation was assumed to be adventitious.
On the other hand, absolute humidity was found to be significantly corre- lated with room air formaldehyde concentrations for the UFFI-responders, but not for any of the three other classifications. These results were similar
to the formaldehyde
-
outdoor temperature comparisons. This was to be expected as the conversion of relative humidity to the absolute values involves tempera- ture only. Similarly, wall cavity concentrations for the UFFI-responder, UFFI- nonresponder and UFFI-removed correlated positively (p<0.01) with absolute humidity values.#
Wind Direction and Velocity
Formaldehyde measurements were made on the windward and leeward sides of homes. A total of 522 individual air samples, half each on the windward and leeward sides, were collected for the complete survey. The same number of windward-leeward wall cavity measurements of formaldehyde were also made. The wall cavity test sites were those which had been selected for a comparison measurement between the modified NIOSH method (to be reported elsewhere) and
the detector tubes. Only the detector tube results are given here.
For the 522 room air samples, the arithmetic average results on the wind- ward and leeward sides were identical at 0.057 ppm. In the individual series,
it was apparent that no relationship between room air formaldehyde concentra- tions and wind direction existed. By contrast, the wall cavity formaldehyde results were consistently higher on the leeward than the windward sides.
This was apparent in every series but only in Series 3, for UFFI-responder
homes, was the difference found to be significant (p<0.05). In no other
series, nor in the results for all six series, was a significant difference
found
.
In the case of wind velocity, a negative, but not significant, correlation was found for room air results in the Control, Responder and Nonresponder
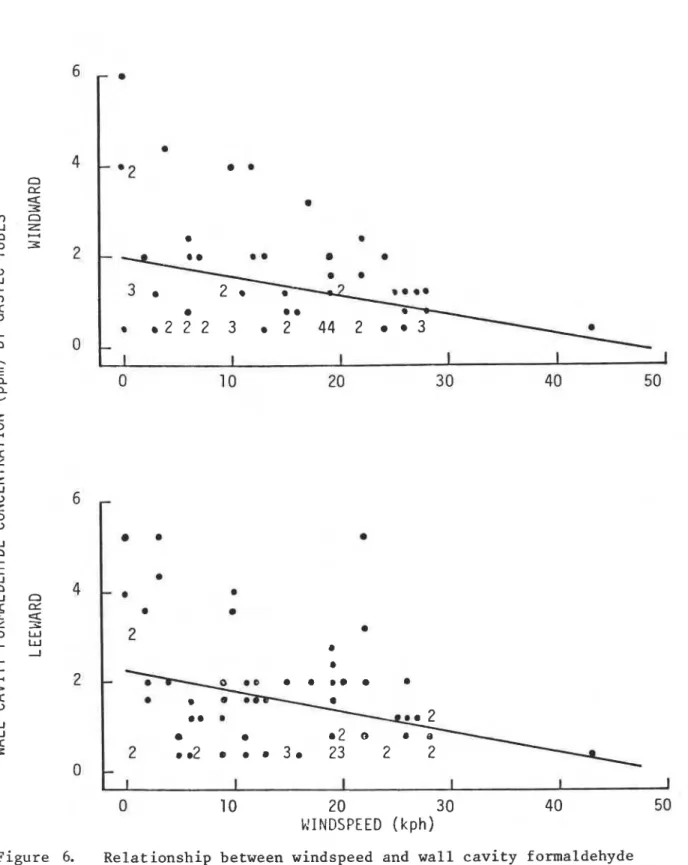
classifications. When the wall cavity results were compared with wind velocity, a strong negative correlation (p<0.001) for the UFFI-responder classification was found. The significance level was the same for both the windward and
leeward sides. For the UFFI-nonresponder classification, the wall cavity formaldehyde concentration results indicated a negative correlation with wind
velocity which was very close to being significant (p<0.05). The results for
the wall cavity formaldehyde
-
wind velocity comparison for UFFI-respondersare shown in Figure 6.
Barometric Pressure
A
regression analysis of barometric pressure readings taken at the timesof testing indicated a slight negative relationship, but it was not statistically significant. It was concluded that no relationship existed. Very rapid pressure changes would be more likely to cause short-term changes in formaldehyde con- centrations, but it was not possible to include a study of these in this survey. House Physical Effects
A number of correlations were attempted to determine whether such factors as house age, type and materials of construction, and the UFFI installation date and contractor had any effect on the room air or wall cavity formaldehyde con- centrations. The only relationship found was that second floor readings were higher, on average, than the first floors of two-storey houses. Though the difference was appreciable, it was not statistically significant.
DISCUSSION OF RESULTS
This study indicated that a correlation between formaldehyde concentration in homes and changing seasons could occur. Significant differences in formalde- hyde concentrations were measured between the summer values (1982 and 1983) and the intervening winter. The relationship was confirmed for both room air and wall cavity concentrations, the latter being more clearly sensitive to seasonal change.
others insofar as their room air concentrations showed a comparatively marked seasonal change while a smaller number of others did not. In the survey, those 1
that showed a significant response were termed UFFI-responders and the others were called UFFI-nonresponders. Both types of house showed similar and marked seasonal fluctuations in wall cavity formaldehyde although the UFFI-responder concentrations were somewhat higher.
It would seem reasonable to assume that a relationship would exist between room air and wall cavity concentrations. Indeed, in this study, a correlation was found for UFFI-responders but not for UFFI-nonresponders. Had there been a relationship for the UFFI-nonresponders, a seasonal room air fluctuation in formaldehyde could have been expected for these. The correlation might have been expected to be less clear than ;or the UFFI-responders, but, in fact, it was nonexistent. From these observations, it could be inferred that a house construction factor may have been responsible for the difference between the Responders and Nonresponders.
Homes selected as Controls for comparison with UFFI-homes, were found to contain formaldehyde almost to the same degree. While none of the Controls ever had UFFI installed, their room air formaldehyde concentrations were higher than the Nonresponder UFFI homes and only marginally lower than the Responders. The formaldehyde in the Controls, for which only new homes were selected, probably originated from various types of resin bonded wood products. All Control homes were less than 5 years old. In addition to outdoor tempera- ture, a correlation with indoor formaldehyde levels was found for outdoor
absolute humidity. A study of an office buildingi6] also reported fluctuations in formaldehyde concentrations of about two to one between warm and cold weather.
Neither wind direction nor velocity were significantly correlated with room air formaldehyde. On the other hand, a consistent positive relationship for UFFI-responders, between wall cavity and the leeward room air was found. This correlation was only statistically significant for one of the six series. By contrast, a strong negative correlation was shown to exist between wind velocity and wall cavity formaldehyde concentrations on both the windward and leeward sides of homes for the UFFI-responder classification.
A
similar, but weaker, correlation for UFFI-nonresponder homes also existed.I
CONCLUSIONSThe conclusion of this study was that outdoor temperature had an influence on room air and wall cavity formaldehyde concentrations in most, but not all homes, containing UFFI. Some showed a marked fluctuation in both room air and wall cavity formaldehyde, but in others the variation was in the wall cavities, only. These differences were considered to be true but the reasons were not fully identified. Unfortunately, by the time the data were analyzed and the responder-nonresponder difference became apparent, many homeowners had begun to remove the foam and make structural changes in their homes. This largely
I removed the possibility of determining the exact causes for the difference.
The most likely explanation for responder/nonresponder effects was considered to be caused by differences in the sealing between the wall cavities and the rooms. If this is correct, it confirms that more effective sealing is one means of reducing room air formaldehyde levels in UFFI homes.
It was predictable that wind velocity would be negatively related to formaldehyde concentration, but it was only found to be statistically signifi- cant for wall cavities. If any correlation occurred for room air, it was a weak one. Wind may have the effect of lowering the wall cavity values on the windward side. This was partially confirmed by the observation of a positive
leeward to windward ratio for formaldehyde although the correlaton was not strongly significant.
The presence of formaldehyde in homes not containing UFFI at concentra- tions which were near to those which did contain the foam, could be worthy of further investigation. The presence of other products containing urea-formalde- hyde was shown by the lack of a seasonal effect on room air concentrations. If formaldehyde in concentrations of about 0.1 ppm is a cause of adverse health effects, its presence in homes, such as the Controls used in this study, may be a cause for future concern.
REFERENCES
1. ASHRAE Standard 62-1981, Ventilation for Acceptable Indoor Air Quality, American Society of Heating, Refrigerating and Air Conditioning Engineers Ind., Atlanta, Ga.
-
2. Miksch, Robert R., "Formaldehyde in Air,
A
Revised NIOSH Procedure",Lawrence Berkeley Laboratory, University of California, Berkeley, CA 94720 (April 18) 1980.
3. Meadows, Geoffrey W. and George M. Rusch, "The Measuring and Monitoring of Formaldehyde in Inhalation Test ~tmospheres", Am. Ind. Hyg. Assoc. J.,
44
(2) 71-77 (1983).4.
Daggett, Denise L. and Thomas H. Stock, "An Investigation into the Storage Stability of Environmental Formaldehyde ~ a m ~ l e s " , Am. Ind. Hyg. Assoc. J.,46 (9)497-504 (1985).
5. Godish, Thad, "~esidential Formaldehyde Sampling
-
Current and Recommended Practices", Am. Ind. Hyg. Assoc. J., 46 (3)105-110 (1985).6. Konopinski, Virgil J., "Seasonal Formaldehyde Concentrations in an Office Building", Am. Ind. Hyg. Assoc. J. 46(2)65-69 (1985).
7. Department of Corporate and Consumer Affairs, UFFI Centre, Final Report of the National Testing Survey Conducted by the Urea-Formaldehyde Foam
Insulation Information and Co-ordination Centre (UFFI-ICC), Ottawa-Hull (September) 1983.
ACKNOWLEDGEMENTS
This project was conducted under Contract No. 03SU.3115-2-4485 which was funded by the National Research Council of Canada, Ottawa, Ontario, Canada. However, neither the Crown nor the National Research Council makes any repre- sentations with respect to the accuracy, completeness or usefulness of the information contained in the paper nor assumes any liabilities with respect to the use of, or damages resulting from the use of any information, apparatus or method described in the paper.
TABLE 1
REPEAT T E S T I N G OF F I V E HOMES BY THE MODIFIED NIOSH METHOD SHOWING VARIATIONS O F INDOOR FORMALDEHYDE CONCENTRATION
WITH SEASONAL CHANGES O F TEMPERATURE & HUMIDITY
OUTDOOR OUTDOOR L I V I N G
RM.
KITCHENDATE/TEST T E K P . O C R.H. % PPm PPm
BEDROOM
TABLE 2
ARITHMETIC MEAN VALUES OF ROOM AIR FORMALDEHYDE CONCENTRATIONS IN HOME CLASSIFICATIONS INDICATED AS MEASURED
BY
THE NIOSH METHODFORMALDEHYDE CONCENTRATION (ppm) TEST SERIES
HOME AGE UFFI
1
2 34
5 6NO.
(YR)
INSTALLED* Aug.82 Oct.82 Nov.82 Jan.83 Apr.83 July83- -
A. CONTROLt
27
1 Not 0.06 0.05 0.05 0.06 0.05 0.07 28 5 Not 0.08 0.09 0.05 0.05-
-
1
29 < 1 Not 0.09 0.09 0.09 0.05 0.07-
30 2 Not 0.050.04
0.02 0.02 0.03 0.05 31 1 Not 0.02 0.03 0.06 0.03 0.02 0.00 3 2 1 Not 0.05 0.06-
-
-
-
B.
UFFI-RESPONDERI
C. UFFI-NONRESPONDER I D. UFFI-REMOVEDTABLE 3
ARITHMETIC MEAN VALUES OF ROOM AIR FORMALDEHYDE CONCENTRATIONS
IN HOME CLASSIFICATIONS INDICATED AS MEASURED BY PRO-TEK C-60 DOSIMETERS
HOME AGE UFFI FORMALDEHYDE CONCENTRATION (ppm)
NO.
(YR) INSTALLED*
1 2 3 4 5 6-
-
Sep.82 Oct.82 Nov.82 Jan.83 Apr.83 July 83
A. CONTROL 27 1 Not 0.04 0.06 0.06 0.06 0.06 0.04 28 5 Not 0.06 0.07 0.07 0.04
-
-
29 < 1 Not 0.10 0.11 0.14 0.07 0.07-
30 2 Not 0.03 0.03 0.03 0.03 0.03 0.05 3 1 1 Not 0.01 0.03 0.06 0.05 0.03 0.03 3 2 1 Not 0.03 0.05-
--
-
B. UFFI-RESPONDER C. UFFI-NONRESPONDER 5 27 Sp.1980 6 45 Sp.1980 9 25 F.1977 14 31 S. 1977 19 100 F.1979 2 1 45 Sp.1979 23 32 Sp.19801
24 40 S.1980I
D. UFFI-REMOVEDUFFI-RESPONDER
cc
W 1 2 3 4 5 6
a
rn Rug.82 Dct.82 Nov. 82 Jan.03 Apr.83 July 83
d n n Z a U W 0 f I I I I 1 2 3 4 5
6
Aug.82 Oct. 82 Nov.82 Jan. 83 Apr.83 July 83
UFFI-REMOVED
Aug.82 Oct. 82 Nov.82 Jan.83 Apr.83 July 83
GASTEC TUBES SERIES
A DRAEGER TUBES
Figure 3. Mean wall cavity formaldehyde concentrations for 6 test series in home classifications indicated.
UFFI-RESPONDER
UFFI-NONRESPONDER
UFFI-REMOVED
OUTDOOR TEMPERATURE ( O C )
Figure 5. Relationship between wall cavity formaldehyde concentrations and outdoor temperature.
Figure Relationship between windspeed and wall cavity formaldehyde concentration on windward and leeward sides of UFFI-Responder homes.
T h i s p a p e r i s b e i n g d i s t r i b u t e d i n r e p r i n t f o r m by t h e I n s t i t u t e f o r R e s e a r c h i n C o n s t r u c t i o n . A l i s t of b u i l d i n g p r a c t i c e and r e s e a r c h p u b l i c a t i o n s a v a i l a b l e from t h e I n s t i t u t e may be o b t a i n e d by w r i t i n g t o t h e P u b l i c a t i o n s S e c t i o n , I n s t i t u t e f o r R e s e a r c h i n C o n s t r u c t i o n , N a t i o n a l R e s e a r c h C o u n c i l of C a n a d a , O t t a w a , O n t a r i o , KIA 0R6. C e document e s t d i s t r i b u 6 s o u s forme d e t i t 6 - 3 - p a r t p a r 1' I n s t i t u t de r e c h e r c h e e n c o n s t r u c t i o n . On p e u t o b t e n i r une l i s t e d e s p u b l i c a t i o n s d e l t I n s t i t u t p o r t a n t s u r les t e c h n i q u e s ou l e s r e c h e r c h e s e n matisre d e b d t i m e n t e n 6 c r i v a n t 3 l a S e c t i o n d e s p u b l i c a t i o n s , I n s t i t u t d e r e c h e r c h e e n c o n s t r u c t i o n , C o n s e i l n a t i o n a l d e
r e c h e r c h e s du Canada, Ottawa ( O n t a r Lo),