Publisher’s version / Version de l'éditeur:
Proceedings of the Second Workshop on Very Large Digital Libraries VLDL2009
(A Workshop in conjunction with the European Conference on Digital Libraries
2009), 2009-10-02
READ THESE TERMS AND CONDITIONS CAREFULLY BEFORE USING THIS WEBSITE.
https://nrc-publications.canada.ca/eng/copyright
Vous avez des questions? Nous pouvons vous aider. Pour communiquer directement avec un auteur, consultez la
première page de la revue dans laquelle son article a été publié afin de trouver ses coordonnées. Si vous n’arrivez pas à les repérer, communiquez avec nous à [email protected].
Questions? Contact the NRC Publications Archive team at
[email protected]. If you wish to email the authors directly, please see the first page of the publication for their contact information.
NRC Publications Archive
Archives des publications du CNRC
This publication could be one of several versions: author’s original, accepted manuscript or the publisher’s version. / La version de cette publication peut être l’une des suivantes : la version prépublication de l’auteur, la version acceptée du manuscrit ou la version de l’éditeur.
Access and use of this website and the material on it are subject to the Terms and Conditions set forth at
Semantic journal mapping for search visualization in a large scale
article digital library
Newton, Glen; Callahan, Alison; Dumontier, Michel
https://publications-cnrc.canada.ca/fra/droits
L’accès à ce site Web et l’utilisation de son contenu sont assujettis aux conditions présentées dans le site LISEZ CES CONDITIONS ATTENTIVEMENT AVANT D’UTILISER CE SITE WEB.
NRC Publications Record / Notice d'Archives des publications de CNRC:
https://nrc-publications.canada.ca/eng/view/object/?id=63e869d5-b589-456e-8459-33e1da3d35c8 https://publications-cnrc.canada.ca/fra/voir/objet/?id=63e869d5-b589-456e-8459-33e1da3d35c8
Semantic Journal Mapping for Search
Visualization in a Large Scale Article Digital
Library
Glen Newton1,2and Alison Callahan1and Michel Dumontier2,3,4
1
National Research Council Canada, Ottawa, Canada
2
Department of Biology,
3
Institute of Biochemistry,
4
School of Computer Science, Carleton University, Ottawa, Canada
Abstract. In this paper5
, we examine the scalability and utility of se-mantically mapping (visualizing) journals in a large scale (5.7+ million) science, technology and medical article digital library. This work is part of a larger research effort to evaluate semantic journal and article map-ping for search query results refinement and visual contextualization in a large scale digital library. In this work the Semantic Vectors software package is parallelized and evaluated to create semantic distances be-tween 2365 journals, from the sum of their full-text. This is used to create a journal semantic map whose production does scale and whose results are comparable to other maps of the scientific literature.
1
Introduction
The goal of this work is to create semantic journal maps to support the user search experience, in a large scale digital library of science, technology and med-ical (STM) journal articles. By projecting article search results onto a semantic map, we seek to visualize and contextualize the query results, and offer interac-tive tools for users to refine queries and discover relevant articles.
Before article query result mapping can occurr, we need to find and validate a technique that can scale up to tens of millions of terms and yet generate understandable and useful semantic journal mappings.
Visual representations of the scientific literature – often called Maps of Sci-ence– have been studied extensively over the last decade[20,1,3,5]. These maps have been constructed for a number of reasons: for informing science policy[16,14]; comparing author groupings within a discipline[6]; examining within discipline journal influence[2]; comparing the innovation systems between and within coun-tries[17,9]; visualizing and discovering research fronts[12], etc. The majority of these maps have been constructed using citation, author, or term analyses, with only a minority using content-based methods like latent semantic analysis
5
Submitted to Second Workshop on Very Large Digital Libraries at the European Conference on Digital Libraries (ECDL) 2009
(LSA)[8,7]. This is due to the scalability issues of LSA, whose solution depends on singular value decomposition which becomes untenable when tens of millions of terms and/or items are involved.
Semantic Vectors (SV) [22] produces similar results to LSA but uses a much less computationally expensive method based on random vectors[4]. This paper evaluates the scalability and quality of journal semantic mappings generated by SV.
Table 1.Category Statistics
Category # Journals Category # Journals
per category per category
Agricultural and Biological Sciences 358 Arts and Humanities 70
Biochemistry, Genetics, 240 Business, Management 106
and Molecular Biology and Accounting
Chemical Engineering 126 Chemistry 226
Civil Engineering 64 Computer Science 218
Decision Sciences 50 Earth and Planetary Sciences 146
Economics, Econometrics 112 Energy and Power 73
and Finance
Engineering and Technology 328 Environmental Science 138
Immunology and Microbiology 104 Materials Science 160
Mathematics 205 Medicine 671
Neuroscience 103 Pharmacology, Toxicology 73
and Pharmaceutics
Physics and Astronomy 210 Psychology 126
Social Science 222
2
Data and Methods
The data is derived from NRC/CISTI’s onsite collection of full-text STM scien-tific articles. This dataset is approximately 4100 journals and 8.4 million articles, and primarily covers the publishing years 1995 - 2009. The collection includes metadata and full-text for all articles. All journals are classified into one or more of 22 categories by library cataloguers (Table 1).
2.1 Data Preparation
Articles were restricted to those whose metadata indicated they had authors and abstracts, as a filter to reduce the number of notices, obituaries, etc. in the collection. As the text extraction software is language specific, non-English language journals were also filtered out. In addition, journals with less than 50
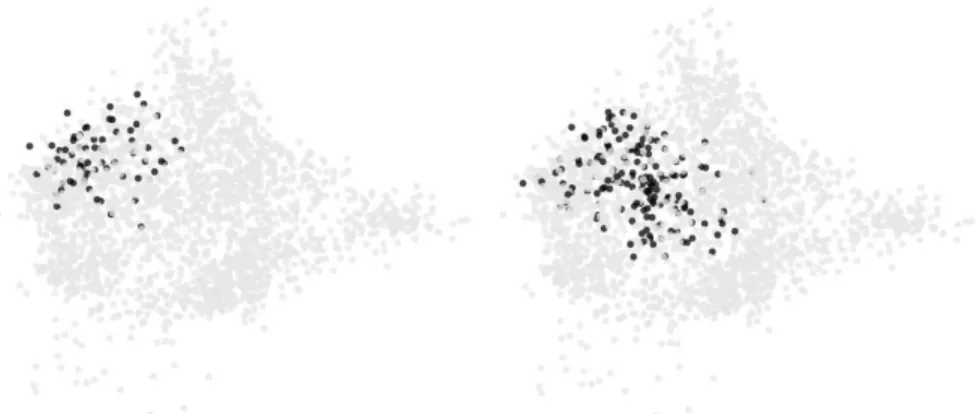
Fig. 1. Two-dimensional Projection of Semantic Mapping of all 2365 journals. Each color represents a category.
articles in total were excluded. The resulting collection amounted to 5,733,721 articles. Table 1 shows the journals per category for this collection. The average number of categories per journal for this collection was 1.53, comparable to the 1.6 reported in [10] in their journal citation analysis and mapping based on ISI Science Citation Index.
Using the LuSql6
Lucene tool, the full-text (only) of the articles from each journal was concatenated into a single (rather large) document. This journal document (one per journal) was then indexed using Lucene7
v2.4, using an ag-gressive stopword list and the Porter stemmer (the Snowball analyzer). Semantic Vectors8
v1.18 BuildIndex was applied to the Lucene index, configured to use 512 dimensions.
A parallelized version of the SV was used to query the resulting model, using each document in the index as a query, resulting in a distance matrix between all documents (journals). Using the R statistics software9
, this distance matrix was scaled to two dimensions using classical multidimensional scaling (MDS) with the cmdscale() function. An interactive application10
was constructed to visualize and validate the two dimensional projection using Processing[19].
6 http://sourceforge.net/projects/lusql/ 7 http://lucene.apache.org/ 8 http://code.google.com/p/semanticvectors 9 http://www.r-project.org/ 10 http://cuvier.cisti.nrc.ca/~gnewton/torngat/applet/index.html
3
Results and Discussion
All computation performed on a Dell PowerEdge 1955 Blade server56, 2 x dual-core Xeon 5050 processors with 2x2MB cache, 3.0 Ghz 64bit, 32GB RAM, at-tached to a Dell EMC AX150 storage arrays via SilkWorm 200E57 Series 16-Port Capable 4Gb Fabric Switch. The operating system was Linux openSUSE 10.2 (64-bit X86-64), kernel 2.6.18.8-0.10-default #1 SMP, Java version 1.6.0.07 (build 1.6.0 07-b06) Java HotSpot 64-Bit Server VM (build 10.0-b23, mixed mode).
3.1 Scalability
The Lucene index produced by indexing the journal articles was 43GB in size, and took 13hrs 51 minutes to produce. This index contained 21.6 million terms. Semantic Vectors indexing took 58 minutes to produce a document vector index of 885MB. The parallelized SV document querying took six minutes to complete the document–document distance comparisons.
3.2 Semantic Mapping
Figure 1 shows the 2-D MDS of the semantic distance space for all journals, col-ored by the categories defined in the collection metadata. Figures 2, 3 and 4 are groupings of the categories into the harder sciences and engineering, agricultural and biomedical, and inter-disciplinary and non-science, respectively. The sub-diagrams show each category within these clusters. If we use the geographic di-rection idiom, Figure 2 shows a north-east to south-east progression from Chem-istry, Fig. 2(a), through Material Sciences, Fig. 2(b), to Physics and Astronomy, Fig. 2(c), to Engineering and Technology, Fig. 2(d), on to Mathematics, Fig. 2(e), then swinging west into Computer Science, Fig. 2(f). Chemical Engineer-ing and Civil EngineerEngineer-ing – somewhat under–represented in this study – are more central-north, Fig. 2(g), and central, Fig. 2(h), respectively.
The biomedical cluster forms most of the western portion of the map (Fig. 3) and seems to have greater cluster overlap than the “hard sciences”. North-central and bridging to Chemistry in the north-east is Biochemistry, Genetics and Molecular Biology, Fig. 3(a), Agriculture and Biological Sciences, Fig. 3(b). Pharmacology, Fig. 3(c) and Immunology and Microbiology, Fig. 3(d), form clus-ters in the north-west, with Neuroscience, Fig. 3(e), in the west. Medicine, Fig. 3(f), occupies much of the south-west and is a larger cluster, overlapping with all other biomedical categories as well as many of the other categories. Psychology, Fig. 3(g), occupies the south-west, with significant overlap with Medicine and Neuroscience.
The third cluster is a catch-all of inter-disciplinary science and non-STM journals. Environmental Science, Fig. 4(a), and Earth and Planetary Sciences, Fig. 4(b), are both central, surrounded by all other clusters, an indication of their complex relationships with other disciplines, both STM and non-STM. Energy and Power Fig. 4(c), has a similar positioning, although it is an even more vague
(a) Chemistry (b) Materials Science
(c) Physics and Astronomy (d) Engineering and Technology
(e) Mathematics (f) Computer Science
(g) Chemical Engineering (h) Civil Engineering
(a) Biochemistry, Genetics and Molecular Biology
(b) Agriculture and Biological Sciences
(c) Pharmacology (d) Immunology and Microbiology
(e) Neuroscience (f) Medicine
(g) Psychology
(a) Environmental Science (b) Earth and Planetary Sciences
(c) Energy and Power (d) Decision Science
(e) Economics (f) Social Sciences
(g) Business, Management and Account-ing
(h) Arts and Humanities
category. Decision Science, Fig. 4(d), – another under–represented category – is a rather spread–out cluster and overlaps with Economics, Computer Science and Mathematics. Economics, Fig. 4(e), is central south, and foms a bridge between Mathematics to the east, and Social Sciences and Business, Management and Accounting to the west. Social Science, Fig. 4(f), is central south, along with Business, Management and Accounting, Fig. 4(g), and for the most part, the also under–represented Arts and Humanities Fig. 4(h).
This mapping is very similar to that reported by other efforts[3,13], and particularly to that described in [10], where the the authors identify a medical pole and hard-science pole: ‘Chemistry plays a brokerage role between Physics and Material Sciences, on the one side, and core Biomedical Sciences such as Biophysics and Biochemistry, on the other’ ([10], p.355).
4
Conclusion
Semantic Vectors produced a robust semantic mapping that was comparable to other maps made with other techniques. In this case, however, no structured information such as keywords, authors or citations were needed to produce these results. SV was able to scale to the extremely large number of terms in this digital library.
4.1 Future Work
With the scalability and semantic usefulness issues resolved, the next step in this work is to project search results, i.e. the first 100-200 articles resulting from a query, onto the journal semantic space. The underlying journal space contextualizes the user’s query, and we envision the ability to zoom in local to the bounding polygon of the search results. This interface would allow a user to visualize semantically similar articles, as well as identifying important journals related to their query. Three-dimensional MDS scaling and visualization will be explored in the hope of better discrimination and less loss of structure over the two-dimensional MDS used here. We will be evaluating non-metric MDS to see if it generates better results than the classical MDS used in this work.
We are also interested in evaluating the finer–grained attributes of SV-generated semantic maps, with an interest in creating domain–specific maps for queries that fall within a particular domain.
5
Acknowledgements
The authors would like to thank NRC/CISTI colleagues Greg Kresko for techni-cal support and Andre Vellino and Jeff Demaine for their input on this project.
References
1. Borner, K., Chen, C., Boyack, K. Visualizing Knowledge Domains. In Blaise Cronin (Ed) Annual Review of Information Science & Technology volume 37 (2003). 2. van Campenhout, C., van Caneghem, T., van Uytbergen, S. A comparison of overall
and sub-area journal influence: The case of the accounting literature. Scientometrics 77(1) 61–90 (2008)
3. Boyack, K.,Klavans, R., Borner, K. Mapping the backbone of science. Scientometrics 64(3) 351–374 (2005)
4. Kanerva, P. Hyperdimensional computing: An introduction to computing in dis-tributed representation with high–dimensional random vectors. Cogn Comput 1 139-159 (2009)
5. Klavans, R., Boyack, K. Toward a consensus map of science. JASIST 60, 455–476 (2009)
6. Kreuzman, H. A co-citation analysis of representative authors in philosophy: Ex-amining the relationship between epistemologists and philosophers of science. Sci-entometrics 50(3) 525–539 (2001)
7. Landauer, T., Laham, D. Derr, M. From paragraph to graph: Latent semantic anal-ysis for information visualization. PNAS 101 S1 5214–5219 (2004)
8. Landauer, T., Dumais, S. A solution to Plato’s problem: The latent semantic anal-ysis theory of acquisition. Psych Rev 104(2) 211–240 (1997)
9. Leydesdorff, L., Yuan, S. National and international dimensions of the Triple Helix in Japan: University-industry-government versus international coauthorship relations. JASIST 60(4) 778–788 (2009)
10. Leydesdorff, L., Rafois, I. A Global Map of Science Based on the ISI Subject Categories. JASIST 60(2), 348–362 (2009)
11. Michalek, R., Tarantello, G. Subharmonic solutions with prescribed minimal period for nonautonomous Hamiltonian systems. J. Diff. Eq. 72, 28–55 (1988)
12. Miguel, S., Moya-Anegn, F., Herrero-Solana, V. A new approach to institutional domain analysis: Multilevel research fronts structure. Scientometrics 74(3) 331–344 (2008)
13. Moya-Aneg´on, F., Vargas-Quesada, B. Chinchilla-Rodr´ıguez, Z., Corera- ´Alvarez, E., Munoz-Fern´andez, F., Herrero-Solana, V. Visualizing the marrow of science. JASIST 58(14) 2167–2179
14. Noyons, E., Calero-Medina, C. Applying bibliometric mapping in a high level sci-ence policy context: Mapping the research areas of three Dutch Universities of Tech-nology. Scientometrics 79(2) 261–275 (2009)
15. Newton, G. LuSql: (Quickly and easily) Getting your data from your DBMS into Lucene. Code4Lib Conference, Providence, RI (2009)
16. Noyons, E. Science Maps Within a Science Policy Context. In H. Moed (Ed) Hand-book of Quantitative Science and Technology Research, 237-255. Kluwer (2004) 17. A comparison of the knowledge-based innovation systems in the economies of South
Korea and the Netherlands using Triple Helix indicators. Scientometrics 65(1) 3–27 (2005)
18. Rabinowitz, P. On subharmonic solutions of a Hamiltonian system. Comm. Pure Appl. Math. 33, 609–633 (1980)
19. Reas, C., Fry, B. Processing: A programming handbook for Visual Designers and Artists. MIT Press (2007)
20. Small, H. A general framework for creating large-scale maps of science in two or three dimensions: The SciViz system. Scientometrics 41(1-2) 125–133 (1998)
21. Tarantello, G. Subharmonic solutions for Hamiltonian systems via a ZZp
pseudoin-dex theory. Annali di Matematica Pura (to appear)
22. Widdows D., Ferraro K. Semantic Vectors: A Scalable Open Source Package and Online Technology Management Application. Proceedings of the Sixth International Language Resources and Evaluation (LREC’08) (2008)