Publisher’s version / Version de l'éditeur:
Ind. Eng. Che. Res., 31, 1992
READ THESE TERMS AND CONDITIONS CAREFULLY BEFORE USING THIS WEBSITE. https://nrc-publications.canada.ca/eng/copyright
Vous avez des questions? Nous pouvons vous aider. Pour communiquer directement avec un auteur, consultez la première page de la revue dans laquelle son article a été publié afin de trouver ses coordonnées. Si vous n’arrivez pas à les repérer, communiquez avec nous à PublicationsArchive-ArchivesPublications@nrc-cnrc.gc.ca.
Questions? Contact the NRC Publications Archive team at
PublicationsArchive-ArchivesPublications@nrc-cnrc.gc.ca. If you wish to email the authors directly, please see the first page of the publication for their contact information.
NRC Publications Archive
Archives des publications du CNRC
This publication could be one of several versions: author’s original, accepted manuscript or the publisher’s version. / La version de cette publication peut être l’une des suivantes : la version prépublication de l’auteur, la version acceptée du manuscrit ou la version de l’éditeur.
Access and use of this website and the material on it are subject to the Terms and Conditions set forth at
Variations in the pore size of charged and noncharged hydrophilic
polysulfone membranes
Tremblay, A.; Tam, C.; Guiver, Michael
https://publications-cnrc.canada.ca/fra/droits
L’accès à ce site Web et l’utilisation de son contenu sont assujettis aux conditions présentées dans le site LISEZ CES CONDITIONS ATTENTIVEMENT AVANT D’UTILISER CE SITE WEB.
NRC Publications Record / Notice d'Archives des publications de CNRC: https://nrc-publications.canada.ca/eng/view/object/?id=4f46deba-3bb6-44e3-a0b8-1cf9b71be8a8 https://publications-cnrc.canada.ca/fra/voir/objet/?id=4f46deba-3bb6-44e3-a0b8-1cf9b71be8a8
834 Ind. Eng. Chem. Res. 1992,31,
zyxwvutsrqponmlkjihgfedcbaZYXWVUTSRQPONMLKJIHGFEDCBA
834-838MATERIALS AND INTERFACES
Variations in the Pore Size of Charged and Noncharged Hydrophilic
Polysulf one Membraned
Andr6
Y.
zyxwvutsrqponmlkjihgfedcbaZYXWVUTSRQPONMLKJIHGFEDCBA
Tremblay,t C h u n g M. Tam,* and Michael D. GuiverInstitute for Environmental Chemistry, National Research Council
zyxwvutsrqponmlkjihgfedcbaZYXWVUTSRQPONMLKJIHGFEDCBA
of Canada,Ottawa, Ontario, Canada
zyxwvutsrqponmlkjihgfedcbaZYXWVUTSRQPONMLKJIHGFEDCBA
K I A OR6Changes affecting carboxylated polysulfone (CPS) membranes were studied in relation to membrane porosity. The pore size of CPS membranes containing COOH substituents was measured after exposure to acidic and basic environments. Membrane pore size was found
to
be dependent on the form of the carboxyl group. Pore size decreased by 10-25% on exposure t o acid. T h e conversion from the COOH form t o the ionic COO-Na+ form, by exposure t o base, increased the pore size of the membrane by 30-100%. These changes were fully reversible on conversion to the COOH form. Membranes were exposed to aqueous ethanoland
chlorine t o determine their resistance t o these environments. Aqueous ethanol had no measurable effect on membrane pore size. For membranes in the COOH form, a 24-h exposure to chlorine resulted in a small increase in membrane pore size, while no significant change was observed for membranes in the COO-Na+ form.Introduction
Aromatic polysulfones are commonly used in the man- ufacture of synthetic membranes. They have outstanding oxidative, thermal, hydrolytic, and dimensional stability. The inherent hydrophobic nature of polysulfone is often cited as a disadvantage in using this polymer as a mem- brane material. Hydrophilicity can be imparted into polysulfone by the addition of carboxyl functional groups. These groups are added to the polymer backbone with the implicit assumption that the polymer will retain many of its favorable characteristics. The lithiation/carboxylation process described by Guiver et al. (1990a) is one method of adding pendant carboxyl groups onto the polysulfone backbone, resulting in the production of carboxylated polysulfones (CPS). The use of these materials has been demonstrated in the manufacture of reverse osmosis (Guiver et al., 1990b) and ultrafiltration membranes (Tremblay et al., 1991).
The carboxyl groups present in CPS membranes can exist either in the
COOH
form or in the ionized COO-Na+ form, depending on the pH environment. The change of pore size was studied after exposure to acidic and basic media. The effects of exposure to chlorine and aqueous ethanol were also studied. Data were collected from single solute permeation experiments in order to generate amolecular weight separation curve for the membranes. A
restricted transport model was then used to analyze the separation data and produce an average pore size, char- acteristic of membrane morphology. Changes in mem- brane morphology were interpreted from differences in the average membrane pore size.
Theory
The average pore size of the membranes studied in this
*
To whom correspondence should be addressed.'NRCC No. 32944.
1 Present address: Department of Chemical Engineering,
University of Ottawa, Ottawa, Ontario, Canada K1N 9B4.
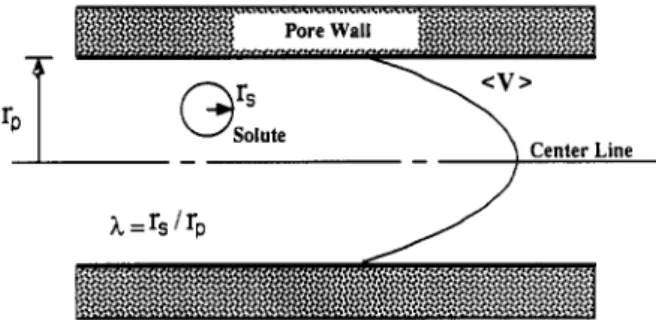
work was estimated with a restricted transport model. The derivation of this model was described by Bungay and Brenner (1973) and Anderson and Quinn (1974). In this model, the surface of the membrane is represented as an array of capillaries of equivalent cylindrical cross section. The usual assumptions of continuum mechanics are be- lieved to be valid. Only steric interactions are assumed to exist between the solute and pore wall. The translation of a solute molecule through a membrane pore is repre- sented schematically in Figure 1. Separation experiments were carried out with dilute solutions which had a negli- gible osmotic pressure compared to the operating pressure used in the characterization test. They were performed at high cross-flow velocities and low pore fluid velocities. On the basis of momentum and mass balances, solute
separation
zyxwvutsrqponmlkjihgfedcbaZYXWVUTSRQPONMLKJIHGFEDCBA
( f ( h ) ) was defined asY
A
f ( h ) = 1 -
1 - e-Pe(l - x )
where h is the ratio of solute radius (rJ to pore radius (rp).
The pore Peclet number (Pe) is given by
X( V)6
Pe =
zyxwvutsrqponmlkjihgfedcbaZYXWVUTSRQPONMLKJIHGFEDCBA
CT\tu-
where (V) is the average fluid velocity in the pore, 6 is the length of the membrane pore, 5 is the ratio of the restricted
diffusivity of the solute in the pore
zyxwvutsrqponmlkjihgfedcbaZYXWVUTSRQPONMLKJIHGFEDCBA
(0) to the bulk diffu-sivity of the solute in solution
(DJ,
andx
is a global steric parameter associated with restricted convective transport within the pore.With the application of the Hagen-Poiseuille equation
rm2AP
( V ) = y
867 (3)
where rp is the pore radiu, AP is the system pressure, and
q is the viscosity of water. The Peclet number can be
Ind. Eng. Chem. Res., Vol. 31, No. 3, 1992
zyxwvutsrqponmlkjihgfedcbaZYXWVUTSRQPONMLKJIHGFEDCBA
835T
Figure 1. Probe solute translating through a membrane pore.
defined without explicit knowledge of the pore length by substituting eq 3 into eq 2
(4)
Numerical values for
zyxwvutsrqponmlkjihgfedcbaZYXWVUTSRQPONMLKJIHGFEDCBA
5
andx
zyxwvutsrqponmlkjihgfedcbaZYXWVUTSRQPONMLKJIHGFEDCBA
as a function ofzyxwvutsrqponmlkjihgfedcbaZYXWVUTSRQPONMLKJIHGFEDCBA
X are givenin Bungay and Brenner (1973).
The radius of poly(ethy1ene glycol)
zyxwvutsrqponmlkjihgfedcbaZYXWVUTSRQPONMLKJIHGFEDCBA
(r,) was calculatedon the basis of a predictive equation (Tremblay, 1989) for
rs as a function of molecular weight. This equation was obtained by combining data from Amu (1982) and Sour- irajan (1983). This relation is expressed as follows rs/nm = 0.02607(PEG molecular weight)'l2 - 0.015 (5) The correlation has a regression factor of 1.00 and is based on 13 data points for poly(ethy1ene glycols) ranging from 200 to 40000 molecular weight.
The diffusion coefficient of PEG can be obtained using the Stokes-Einstein relationship (e.g., Reid et al., 1987):
a m
n r
D - =
where
R
is the gas constant, T is the temperature, q is the viscosity of water, and r, is the solute radius.The average pore size of a membrane was estimated by performing a regression on the restricted transport model using experimentally obtained separation data. In this work, the criteria of the minimum sum of squares of re- siduals was used to determine average pore sizes. Experimental Section
Carboxylated polysulfone (CPS) having a degree of substitution (DS) of 0.88 was made via the lithiation procedure illustrated in Figure 2. The degree of substi- tution was verified using 'H-NMR spectroscopy. All membranes were cast from carboxylated polysulfone in its acidic form (COOH). In a basic environment, the car- boxylic acid groups are converted to the salt form (COO-Na+).
Membranes were cast from a 28 wt % polymer solution in N-methylpyrrolidinone (NMP) onto a nonwoven poly-
ester backing and gelled directly into water at 0 "C. Seven
sheets of membranes were cast, and coupons were cut from these sheets. Test coupons were divided into three groups. Each set was subjected to different exposure histories as follows:
(a) Set A was not exposed to acid or base. These cou- pons were used to verify the reproducibility of the char- acterization procedure.
(b) Set B was first characterized, exposed to acid, and recharacterized. These membranes were then exposed to base and characterized once more.
(c) Set C was first characterized, exposed to base, and recharacterized. Finally the coupons were exposed to acid and characterized once more.
Table I. Average Pore Size and 95% Confidence Interval (CI) for All Membranes from Set A
no. of av pore 95% 95% CI
*
%membrane testa size/nm CI/nm of av Dore size A1 4 1.83 f0.26 14.2 A2 4 1.65 f0.13 7.9 A3 4 1.81 f0.20 11.0 A4 5 1.90 f0.17 8.9
Table 11. Initial Pore Size, Obtained from a Single Characterization Run. for All Membrane Counons
set membrane designation pore size/nm A A 1 1.77 A2 1.75 A3 1.94 A4 2.08 B B1 1.66 B2 1.87 B3 2.41 B4 1.52 C
c1
2.09c2
1.91 c 3 1.93 c 4 1.71 av: 1.89After this series of alternating exposure to acid and base, selected membranes from each set were exposed to ethanol and chlorine. The membranes were rinsed with pure water after each exposure. Membranes were recharacterized using pure water and dilute PEG solutions.
The acidic treatment was performed by exposing the membranes to 2 M HC1 (pH 0.5) for 24 h. The base treatment was performed by immersing the membrane for 24 h in 2 M NaOH (pH 13). Membranes were also exposed to 20% aqueous ethanol for 24 h. Tolerance to chlorine was determined by immersing membranes in an aqueous solution of 0.05 wt % NaOCl for 24 h.
Ultrafiltration experiments were carried out at 347 kPa (50 psig) in test cells having an effective surface area of 14.50 cm2. The feed solution was circulated in the system a t a rate of 3 L/min. This feed flow rate provided a cross-flow velocity of 0.8 m/s over the surface of the membrane. Membranes were characterized by the suc- cessive permeation of water-soluble polymers. A series of PEG'S of various molecular weights and narrow molecular weight distxibution were used as "probe" solutes. The PEG feed concentration was 200 ppm. At this low feed con- centration and high cross-flow velocity, effects of concen- tration polarization are negligible. One complete charac- terization run involved a series of five individual per- meation tests. PEG concentration was determined using total organic carbon analysis. A complete membrane characterization run, including PEG analysis, took 24 h. Results
Reproducibility. Set A was used to verify the repro- ducibility of the characterization method. Figure 3 rep- resents a typical sieving curve and shows the reproduc- ibility of characterization tests performed on coupon A4. The average pore size based on 4-5 successive charac- terizations are summarized in Table I. The confidence interval (CI) is a measure of the uncertainty in evaluating the average pore size. These values represent the com- bined experimental errors involved in concentration de- terminations as well as possible membrane performance changes over time. The individual confidence intervals obtained in estimating membrane pore size ranged from f0.13 to f0.26 nm, as shown in Table I.
Table I1 lists the initial characterization for pore size generated using the restricted transport model for all
836
zyxwvutsrqponmlkjihgfedcbaZYXWVUTSRQPONMLKJIHGFEDCBA
Ind. Eng. Chem. Res., Vol. 31, No. 3, 1992~ ~ ~ T J - J - o * o q
nTHF, n-butyllllhlum
reduced lemperature
zyxwvutsrqponmlkjihgfedcbaZYXWVUTSRQPONMLKJIHGFEDCBA
Li
c
Reactive llthlated Intermediate
1. carbon dioxide 2. HCI COOH
!
N e o nzyxwvutsrqponmlkjihgfedcbaZYXWVUTSRQPONMLKJIHGFEDCBA
1,
H C 1to@Q-o&soq
AH3 - nfo+yDo&soa
Carboxylated polysulfone-
acid formn
COONa
Carboxylated polysulfone
-
base formFigure 2. Synthesis route to carboxylate polysulfone. Table 111. Average Pore Size for Set B Membranes in the COOH Form before and after Exposure to Acid
initial pore size pore size after % change mem- (in COOH form)/ exposure to difference/ from initial brane nm acid/nm nm pore size
B1 1.66 1.34 -0.32 -19.3
B2 1.87 1.61 -0.26 -13.9
B3 2.41 1.80 -0.61 -25.3
B4 1.52 1.35 -0.17 -11.2
membranes used in this study. The average pore size of these membranes after the initial characterizations was 1.89
*
0.15 nm (95% CI), as seen in Table 11. This average pore size accounts for the uncertainty associated with the reproducibility of individual membrane sheets and the location of a coupon on a sheet.Effect of Acid on the
COOH
a n d COO-Na+ Mem- branes. A comparison of the separation curve for a membrane before and after exposure to acid is shown in Figure 4. Solute separation increased slightly after the membrane, already in the COOH form, was exposed to acid. Table I11 lists the change in average pore size of allmembranes in set B after exposure to acid. Accounting for experimental uncertainties, the change in average pore size was significant but small, in the order of -0.3 nm. The effect of acid on the COO-Na+ form membrane was determined by examining the results obtained for set C.
a
L
100 1000 10000 101
PEG Molecular Weight
Figure 3. PEG separation and average pore sizes for five repeat characterizations performed on membrane A4. Curves represent a
least squares fit of eq
zyxwvutsrqponmlkjihgfedcbaZYXWVUTSRQPONMLKJIHGFEDCBA
1 to the separation data generated in a char- acterization run. 0 0, 8 " 0 - co h 0 0 - 5 1 0E -
(nm). C
-
8
zyxwvutsrqponmlkjihgfedcbaZYXWVUTSRQPONMLKJIHGFEDCBA
Pore Sizee----+ 1.87
A 1.61
--
I
0
100 1000 10000 101 100
PEG Molecular Weight
Figure 4. PEG separation and average pore sizes for membrane B 2
in the COOH form (solid line, pore size = 1.87 nm) and as a result of exposure to acid (dotted line, pore size = 1.61 nm). Curves rep- resent a least squares fit of eq 1 to the separation data generated in a characterization run.
Membranes in the COOH form were first converted to the COO-Na+ form by exposure to NaOH and then charac- terized. The larger pore COO-Na+ form membranes were then converted to the COOH form by exposure to acid. The final characterizations for this set showed an initial slight increase in membrane pore size, as seen in Table
IV.
However, after a 2-day period of testing, the pore size
Table IV. Average Pore Size for Set C Membranes in the COO-Na+ Form before and after Exposure to Acid
time after pore size of COO-Na+ pore size after difference from COO-Na+ %
membrane treatment/day membranelnm exposure to acidlnm formlnm change
c1 1 2.89 3.28 +0.39 +13.5 2 1.66 -1.23 -42.6 3 1.70 -1.19 -41.2 c 2 1 2.97 1.65 -1.32 -45.0 2 1.72 -1.26 -42.7 c3 1 2.64 3.94 +1.30 +49.2 2 1.72 -0.92 -34.9 c 4 1 2.51 3.34 +0.83 +33.1 2 1.57 -0.94 -37.5
Ind. Eng. Chem. Res., Vol.
zyxwvutsrqponmlkjihgfedcbaZYXWVUTSRQPONMLKJIHGFEDCBA
31, No. 3,1992 837 Table V. Pore Sizes for Set C Membranes in the COOHForm before and after Exposure to Base
initial pore size pore size after
zyxwvutsrqponmlkjihgfedcbaZYXWVUTSRQPONMLKJIHGFEDCBA
70 changeof C O O H exposure to difference/ from initial membrane form/nm base/nm nm pore size
c1 2.09 2.89 +0.80 +38.3
c2 1.91 2.97 +1.06 +55.5
c3 1.93 2.64 +0.71 +36.8
c4 1.71 2.51 +0.80 +46.8
decreased to values below those initially obtained in the first characterization. In general, membranes in the COO-Na+ form had a 1-nm decrease in average pore size after immersion in acid. This decrease in pore size is clearly illustrated in Figure 5.
Effect of Base on the COOH Membranes. Table V contains a summary of the change in pore size as a result of exposure to base. This increase in pore size is shown in Figure 5. A substantial increase of a t least 0.7 nm in the average pore size was observed after the COOH mem- branes were exposed to NaOH.
The same increase in membrane pore size was observed for acid membranes from group B. Table VI shows that membranes first exposed to acid and then to base have a larger increase in average pore size (at least 1 nm).
Ethanol. One coupon was selected from each mem-
brane set and immersed in 20 w t %
zyxwvutsrqponmlkjihgfedcbaZYXWVUTSRQPONMLKJIHGFEDCBA
aqueous ethanol. Theresults, summarized in Table VII, show that ethanol treatment had no effect on CPS in either the COOH or COO-Na+ forms.
Chlorine. One coupon was selected from each mem-
brane set and immersed in a solution of 0.05
zyxwvutsrqponmlkjihgfedcbaZYXWVUTSRQPONMLKJIHGFEDCBA
w t % NaOClfor 24 h. No sign of physical deterioration of the mem- brane in either form was apparent. The change in average pore size after exposure is shown in Table VIIL The pore size increased by 0.63 and 0.89 nm for the polymer in the COOH form (sets A and C), which are greater than the limits of experimental uncertainty. In the COO-Na+ form (set
B)
the average pore size showed a negligible change with exposure to chlorine.Discussion
The basic premise of this work is that the change in solute separation is a direct measure of the change in morphology of the membrane. This premise is based on two initial assumptions: (1) Concentration polarization has been minimized so that bulk solution concentration is approximately the same as the concentration a t the membrane solution interface, and (2) only steric interac- tions exists between PEG and the membrane. The validity of these initial assumptions can be supported from both experimental data and theoretical considerations.
Concentration polarization is the result of the accumu- lation of solute on the high-pressure side of the membrane. Consequently, the bulk concentration may not be repre- sentative of the actual pore inlet concentration. Concen- tration polarization effects can be minimized by increasing the mass-transfer coefficient of the test cell. Long and Anderson (1984) used the mechanical action of a Teflon bar to eliminate concentration polarization. In their ex-
100 1000 10000 10(
PEG Molecular Weight
300
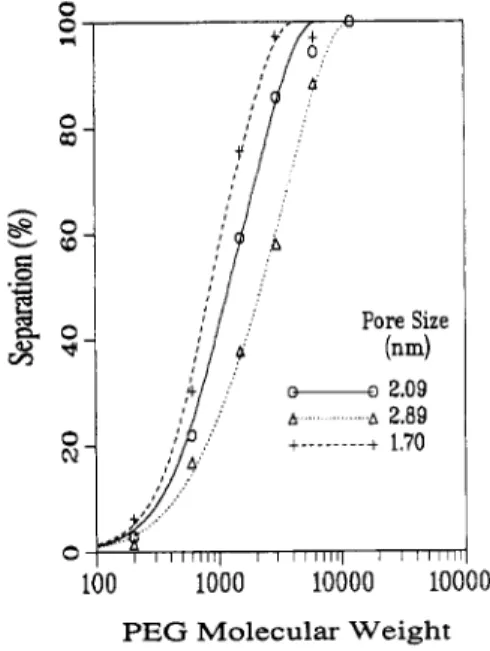
Figure 5. PEG separation and average pore sizes for membranes
C1 in the COOH form (solid l i e , pore size = 2.09 nm) and aa a result
of exposure to base (dotted line, pore size = 2.89 nm) and then acid (dashed line, pore size = 1.70 nm). Curves represent a least squares fit of eq 1 to the separation data generated in a characterization run.
periment, they used a stirring speed of 240 rpm over a track-etched mica membrane of 1.6 cm in diameter. This translated to a maximum surface velocity of 0.2 m/s. The cross-flow velocity of 0.8 m/s in our test cell is 4 times greater. The average pore fluid velocity in Long and An-
derson was reported to be 5.5 X cm/s. On the basis of a conservative estimate of 0.25 I.cm for the selective layer of the membranes used in this work, the average pore fluid velocity for a 1.89-nm pore radius was calculated to be 3.02
X
lo4
cm/s. This velocity is 1 order of magnitude lower than that reported in Long and Anderson. The cross-flow velocity and pore fluid velocity are comparable to that of Long and Anderson. Accordingly, we can justify the as-sumption of negligible concentration polarization. Tremblay et al. (1991) compared the pore size of hy- drophilic polysulfone membranes evaluated using solute sieving experiments and permoporometry. Excellent agreement was obtained between sieving curves predicted from permoporometry and those obtained by fitting the separation data. The experimental test conditions of high cross-flow velocity and low pore fluid velocity and agree- ment between both characterization techniques indicates that concentration polarization had a negligible effect. Purely steric solute-membrane interactions are adequate to determine the membrane pore size in these experiments. In this work, no apparent physical deterioration of the membrane occurred in the alternating exposure to acid or base environments. However, changes in membrane per- formance linked to membrane morphology were observed. The pore size of CPS membranes was affected by the ionization of the carboxylate groups on the polymer backbone. CPS membranes in the COO-Na+ form had
Table VI. Average Pore Size for the Acidified Set B Membranes before and after Exposure to Base
time after pore size after pore size after pore size 7O
membrane treatment/days exposure to acid/nm exposure to base/nm change/nm change
B1 1 1.34 2.42 +1.08 +80.6 2 2.54 +1.20 +89.6 B2 1 1.61 2.43 +0.82 +50.9 2 1.80 +0.19 +11.8 B3 1 1.80 2.85 +1.05 +58.3 2 2.48 +0.68 +37.8 B4 1 1.35 2.76 +1.41 +104.4 2 2.33 +1.00 +72.6 3 2.77 +1.42 +105.2
838 Ind. Eng. Chem. Res., Vol. 31, No. 3, 1992
Table VII. Pore Size of Membranes a f t e r Immersion i n 20
zyxwvutsrqponmlkjihgfedcbaZYXWVUTSRQPONMLKJIHGFEDCBA
wt
zyxwvutsrqponmlkjihgfedcbaZYXWVUTSRQPONMLKJIHGFEDCBA
% Aqueous Ethanolmembrane pore size before pore size after difference/ 90
designation " ethanolhm ethanolhm nm chanee I
A2 (initial) 1.65 1.64 -0.01 0.0
B2 (base) 1.80 1.75 -0.05 +2.8 C4 (acid) 1.57 1.58 +0.01 +0.6
Table VIII. Pore Size of Membranes Tested a f t e r Immersion i n Chlorine
membrane pore size before pore size after difference/ 90
designation NaOCl/nm NaOCl/nm nm change
A1 (initial) 1.83 2.46 +0.63 +34.5
B1 (base) 2.54 2.39 -0.15 -6.3 C3 (acid) 1.72 2.61 +0.89 +51.7
larger pore sizes than CPS membranes in the acid COOH form. This change in pore size was found to be completely reversible. Reversible changes in pore size suggest that the polymer networks which form a membrane have some degree of mobility. Immersion of CPS membrane in base results in a localization of charge on the polymer chain. We believe the negatively charged carboxyl groups on the polysulfone backbone induce an electrostatic repulsion to neighboring groups. This is an equivalent effect to swelling, as the distance between polymer chains of the polymer network forming the membrane pores increased. Osmotic pressure effects may also have a role in polymer swelling. Upon exposure to base, the concentration of cations within the polymer network is greater than in the bulk solution due to the attracting power of the fixed anionic charge. Thus, the osmotic pressure within the network is greater than the external solution which swells the polymer network. The effects of the carboxylate group
in polysulfone can
zyxwvutsrqponmlkjihgfedcbaZYXWVUTSRQPONMLKJIHGFEDCBA
be compared to the behavior of chargedgroups in a space network polyelectrolyte gel, as described by Flory (1953).
Aromatic polysulfones are not soluble in nor attacked by aqueous acids (Johnson, 1969). Udel polysulfone is extremely tolerant to strong alkaline conditions, remaining stable in 40% NaOH solution a t 70-80 OC for 300 h with no sign of cracking (Zmhocke and Quellmalz, 1985). Such physical properties have been attributed to a combination of the ether linkage and the rigid phenyl sulfone portion of the polymer backbone (Cheryan, 1986). Additions of carboxylate groups onto the phenyl rings should have little effect on chain rigidity. Carboxyl functional groups pro- vide additional sites for hydrogen bonding and conse- quently increase the hydrophilicity of the material.
Udel itself is resistant to both chlorine and aqueous ethanol. Our results indicate that chlorine had a small effect on the CPS membrane in the COOH form. A neg- ligible change in pore size was observed on exposure to chlorine when the membrane was in the COO-Na+ form. Conclusion
The pore size of membranes cast from carboxylated polysulfone were compared to the COOH and COO-Na+ forms. Acid treatment led to a slight decrease in pore size while the base treatments led to large increases in pore size.
The changes in pore size were completely reversible, im- plying that membranes in the COOH form could be sub- jected to caustic cleaning cycles and re-acidified with minimal change in separation characteristics. This re- versibility could eventually be exploited in areas where the pore size of a membrane must be changed in situ, such as
application in sensors and controlled release devices. The performance of carboxylated polysulfone mem- branes was not affected by aqueous ethanol solutions. This
property is important in the separation of certain organics from water and in applications such as pervaporation. There is a demand for membrane materials which can tolerate exposure to chlorine, especially in point of use potable water treatment. Carboxylated polysulfone mem- branes were found to have resistance to chlorine, making this material a potential candidate for use in reverse os- mosis and nanofiltration applications.
Nomenclature
D = diffusivity of solute in the pore
zyxwvutsrqponmlkjihgfedcbaZYXWVUTSRQPONMLKJIHGFEDCBA
D, = diffusivity of solute in solution
f(A) = solute separation
AP = system pressure
zyxwvutsrqponmlkjihgfedcbaZYXWVUTSRQPONMLKJIHGFEDCBA
Pe = pore Peclet number R = gas constant
r p = pore radius
rB = solute radius
( V ) = velocity inside the pore
Greek Letters
6 = length of the membrane pore
7 = viscosity of water
X = ratio of solute radius to pore radius
E = ratio of restricted diffusion
zyxwvutsrqponmlkjihgfedcbaZYXWVUTSRQPONMLKJIHGFEDCBA
within the pore to free diffusionx
= in bulk solution global steric parameterRegistry No. PEG, 25322-68-3; NaOH, 1310-73-2; EtOH,
64-17-5; NaOC1,7681-52-9; (-OC6H4-p-S02CsH4-p-OCGH,-p-C-
( C H S ) ~ C ~ H ~ - P - ) , 25135-51-7.
Literature Cited
Amu, T. C. The Unperturbed Molecular Dimensions of Poly(ethy1- ene oxide) in Aqueous Solutions from Intrinsic Viscosity Mea- surements and the Evaluation of the Theta Temperature. Poly-
mer 1982,23, 1775-1779.
Anderson, J. L.; Quinn, J. A. Restricted Transport in Small Pores.
J. Biophys. 1974,14, 140-150.
Bungay, P. M.; Brenner, H. The Motion of a Closely Fitting Sphere
in a Fluid-Filled Tube. Znt. J. Multiphase Flow 1973, I ,
zyxwvutsrqponmlkjihgfedcbaZYXWVUTSRQPONMLKJIHGFEDCBA
25-56.Cheryan, M. Ultrafiltration Handbook; Technomic: Lancaater, PA,
1986; p 42.
Flory, P. J. Principles of Polymer Chemistry; Cornel1 University Press: Ithaca, NY, 1953.
Guiver, M. D.; Croteau, S.; Hazlett, J. D.; Kutowy, 0. Synthesis and Characterization of Carboxylated Polysulfones. Br. Polym. J. 1990a, 23, 29-39.
Guiver, M. D.; Tremblay, A. Y.; Tam, C. M. Method of Manufac- turing a Reverse Osmosis Membrane and the Membrane so Pro- duced. U.S. Patent 4,894,159, 1990b.
Johnson, R. N. Polysulfone Resins. In Encyclopedia of Polymer Science and Technology; Wiley: New York, 1969; Vol. 11, pp
447-463.
Long, T. D.; Anderson, J. L. Flow Dependent Rejection of Poly- styrene from Microporous Membranes. J. Polym. Sci., Part B Polym. Phys. 1984, 22, 1261-1281.
Reid, R. C.; Prausnitz, J. M.; Poling, B. E. The Properties of Gases
& Liquids, 4th ed.; McGraw-Hill: New York, 1987.
Sourirajan, S. Lectures on Reverse Osmosis; National Research Council of Canada: Ottawa, Ontario, Canada, 1983.
Tremblay, A. Y. The Role of Structural Forces in Membrane TransDort: Cellulose Membranes. Ph.D. Thesis. Universitv of Ottawa, 1989.
Tremblay, A. Y.; Tam, C. M.; Guiver, M. D.; Dal-Cin, M. Studies on Hydrophilic Polysulfone Ultrafiltration Membranes. Can. J. Chem.-Eng. 1991,69, 1348-1351.
on an Aromatic Polyethersulfone.
Zschocke, P.; Quellmalz, D. Novel Ion Exchange Membranes Baaed J. Mernbr. Sci. 1985, 22,
Received f o r review July 30, 1991
Accepted November 2, 1991