Official URL
https://doi.org/10.1109/AIVR46125.2019.00021
Any correspondence concerning this service should be sent
to the repository administrator:
[email protected]
This is an author’s version published in:
http://oatao.univ-toulouse.fr/26427
Open Archive Toulouse Archive Ouverte
OATAO is an open access repository that collects the work of Toulouse
researchers and makes it freely available over the web where possible
To cite this version: Knote, Andreas and Fischer, Sabine and
Cussat-Blanc, Sylvain and Niebling, Florian and Bernard, David
and Cogoni, Florian and Von Mammen, Sebastian Immersive
Analysis of 3D Multi-Cellular In-Vitro and In-Silico Cell Cultures.
(2019) In: IEEE International Conference on Artificial Intelligence
and Virtual Reality (AIVR 2019), 9 December 2019 - 11 December
2019 (San Diego, CA, United States).
Immersive Analysis of 3D Multi-Cellular In-Vitro
and In-Silico Cell Cultures
(Invited Paper)
Andreas Knote
∗, Sabine C. Fischer
†, Sylvain Cussat-Blanc
‡, Florian Niebling
§,
David Bernard
‡, Florian Cogoni
‡, Sebastian von Mammen
∗∗Games Engineering, W¨urzburg University, W¨urzburg, Germany {andreas.knote, sebastian.von.mammen}@uni-wuerzburg.de
†CCTB, W¨urzburg University, W¨urzburg, Germany [email protected]
‡{IRIT, ITAV}, CNRS, Universit´e de Toulouse {1, 3}, Toulouse, France {sylvain.cussat-blanc, david.bernard, florian.cogoni}@irit.fr § Human-Computer-Interaction, W¨urzburg University, W¨urzburg, Germany
Abstract—Immersive visualization has become affordable for many laboratories and researchers with the advent of consumer virtual reality devices. This paper introduces two according scenarios, (1) modeling biological simulations of multi-cellular tumor spheroids, and (2) analysing spatial features in fluorescence microscopy data of organoids. Based on these, we derive a list of functional requirements for an immersive workbench that integrates both image data analysis and modeling perspectives. Three existing, exploratory prototypes are presented and dis-cussed. Finally, we propose two specific applications of immersive technology for the support of the targeted user groups’ research, one for the collaborative definition of segmentation “ground truth”, and one for the analysis of spatial features in organoids. Index Terms—Immersive analytics, cell biology, spheroids, organoids
I. INTRODUCTION
Cell biology is a highly active research area that deepens the understanding of the multitude of mechanisms that drive cellular life. It is fundamental to the discovery and devel-opment of new drugs and treatment plans. 3D cell cultures are gaining in importance as experimental systems, because they resemble the spatial arrangement of cells and tissue structures more closely than traditional 2D cell cultures in Petri dishes [1]. They come in different flavours: Multi-cellular tumor spheroids (MCTS) are 3D aggregates of tumor cells that are used (a) for drug screening [2] or (b) to investigate fundamental processes in tumor biology [3]. Organoids are formed from stem cells and mature to exhibit features of their tissue of origin [4]. The quantitative analysis of 3D in-vitro cell cultures is often accompanied by agent-based in-silico modeling [5]. In both model categories, the spatial arrange-ment of cells and tissue structures is a very relevant feature that has to be included in the data analysis. Biologists often retrieve large sets of volumetric data generated by a range of microscopy or tomography methods. The raw data is often analyzed in a layer-based fashion on typical flat screens. The data sets are further commonly segmented, where the intensity
values of the image channels are used to extrapolate or infer the original features of the specimen, such as cell nuclei, boundaries, different types of tissue, etc. The exploration of this data is still usually tedious although various commercial and non-commercial applications exist [6].
The main goal of our work is to support the analysis of empirical, segmented, and simulated data on MCTS and organoids by means of computational tools for the immersive, interactive visualisation and immersive analysis. Immersive visualization has been implemented successfully in many ap-plications that require spatial understanding [7]. Furthermore, immersive analysis can aid in understanding complex and abstract relations in large data sets [8]. The specific analytical objectives include the exploration of the external and internal structure of the data, i.e. the exterior shape of the cell culture or the occurrence of cavities or structured features of the interior, and especially the classification and quantification of any 3D spatial patterns which arises during cell differentiation. In numerous conversations, biologists expressed their interest in visualizing and interacting with simulated data in the same way as with empirical data. We therefore aim to integrate interactive simulations with our applications whenever suit-able and possible. The effectiveness and the success of such tools highly depends on the support of the domain experts’ established workflows, to provide intuitive ways of using the tools to effectively harness the experts’ knowledge and the tools’ analytical functionality.
In Section II, we present related work on tools for the analysis of biological image data and immersive analytics applications. Section III is devoted to the introduction of the two target user groups, their use cases and a systematic requirements analysis. Section IV presents a set of exploratory, immersive visualization and analysis prototypes. Their impact is discussed in V. Finally, Section VI outlines the next steps and applications, before we conclude the paper in Section VII.
II. RELATEDWORK
Eliceiri et al. [9] provide a review of the state-of-the-art in biological imaging software tools. Among the tools available, Fiji [6] is one of the standard tools for the analysis of cell structures. It provides an easy-to-set-up distribution of ImageJ [10], making the image processing pipeline for multi-dimensional data accessible. Fiji and ImageJ are extensible through a plugin architecture and enjoy large community support. However, 3D visualization – especially immersive visualization – is not a focus of the platform. BioImageXD [11] is a visual analysis platform for the exploration of 3D image data with a focus on 3D interactive visualization. It further includes segmentation, filtering, and tracking features and aims to be user-friendly by not requiring programming skills. However, its code repository appears not to have been updated since 2012. Vaa3D [12] also provides spatio-temporal image visualization and analysis tools with a focus on 3D rendering. It supports virtual reality (VR) hardware and large image data sets. Furthermore, it includes various analysis tools such as segmentation, annotation, and quantitative mea-surements. It is still under active development. In contrast to the aforementioned tools, we aim to make simulation a first-class citizen of our applications. VTK [13] is a proven visualization toolkit for scientific applications, providing a framework for the development of many state-of-the-art appli-cations. It is open-source and has a vivid community. Recently, some competition emerged from game engine technology [14]. Game engines are often significantly less efficient at rendering large-scale data sets and volumetric data and at providing data processing pipelines and built-in scientific visualizations. However, they typicslly provide accessible, GUI-driven in-tegrated development environments, special features for the creation of rich user interfaces, and support for state-of-the-art consumer hardware. D¨aschinger et al. [15] presented a prototype for a full workflow-oriented pipeline for integrated modeling and simulation of cell-centered biological assays based on the Unreal game engine. VisNEST [8], [16] is a visual analysis tool for neuroscientists to explore the results of a multi-scale simulation of a macaque monkey brain. [17] used VR head-mounted displays (HMD) to visualize molecular dynamics, using ray tracing algorithms for optimized perfor-mance and quality. [18] provided a case study on analysing the structure and function of blood vessels using 3D and immersive visualization, highlighting the benefits of VR for understanding spatial relations.
III. REQUIREMENTSANALYSIS
In this section, we analyze two scenarios: (a) Agent-based simulation of MCTS, and (b) Fluorescence microscopy images of organoids. We introduce them from the points of view of the domain specialists, extract the supported research tasks, and infer according software requirements.
A. Targeted Use Cases and User Groups
Although spheroids and organoids are quite different in their specifics, the methods used in their analysis are often quite
TABLE I
MECACELL SIMULATION DATA CHANNELS(PER CELL).
Attribute Description
Oxygen Oxygen level measured in the cells DNA DNA content during cell cycling Phase Phase of the cell during its cycle EdU Positivity Simulated biomarker of cell division Position X,Y,Z position data
Id Unique ID of the cell over the simulation runtime.
TABLE II
SELECTION OF FEATURES EXTRACTED FOR A WHOLE CELL AGGREGATE AND INDIVIDUAL CELLS. [19] (SUPPLEMENTS)
Cell Aggregate Features
Spheroid Surface Constructed from cell nuclei centroid (alpha shape). Shape, volume and sur-face area of the aggregate.
Proximity Cell Graph Edge exists if Euclidean distance be-tween two vertices is less than a prede-fined threshold. Measure of cell density. Delauny Cell Graph Edge exists if Euclidean distance be-tween two vertices is less than a pre-defined threshold and it is part of the Delaunay triangulation. Approximation of which cells are direct neighbours. Cell Nuclei Features
Count Total number of voxels of a nucleus. Provides its volume.
Centroid Geometric center of a nucleus. Surface Distance Minimal distance of cell nucleus to
aggregate surface.
Intensity measures Total, average, standard deviation, min-imum and maxmin-imum intensity level of cell nucleus.
Cell Neighborhood Features
Neighbour Count Vertex degree for individual nucleus extracted from Proximity Cell Graph or Delaunay Cell Graph.
similar. In the following, the two according analysis scenarios are described.
Scenario A: Agent-Based Simulation of MCTS: MecaCell [20] provides an efficient, flexible and accessible platform to implement agent-oriented cell-based models. It provides plugins for cell physics, molecular diffusion, visualization, statistics, etc. Biological cells are represented as spheres, and the cells’ behaviors are, per default, driven by a model cell cycle based on Bernoulli processes representing cell phases and checkpoints. This allows, e.g., for considering cells in optimal or degraded conditions due to environmental factors, such as lack of oxygen or the presence of drugs [5]. A mathe-matical mass-spring-damper equation system models adhesion between pairwise cells, whereas the neighbouring cells are efficiently identified relying on Delaunay triangulation of the virtual space. This provides an efficient physics representation sufficiently realistic to represent spatial features such as the spherical aggregation of cells in MCTS. The cells’ behaviors
are calibrated using empirical biological data of spheroids cultured in physioxia (5% of oxygen) in order to have a condition limited only by the availability of oxygen and not other nutriments. The models fit the empirical data in the simulations both quantitatively and qualitatively. The model evolution is retraced by means of the visualization of the biomarker 5-ethynyl-2’-deoxyuridine (EdU) which identifies proliferating cells. In a joint effort with experts in cell cycle dynamics, this calibrated model will be used both to under-stand complex dynamics in spheroids which are technically difficult to explore in-vitro, and as a predictive tool to explore and optimize experimental protocols. It is further planned to use stochastic optimization (e.g. genetic algorithms) and white-box artificial intelligence algorithms (such as genetic programming) in order to generate new protocols using sim-ulations to calculate fitness scores. Furthermore, the spatial simulation capabilities of MecaCell can support exploratory studies in the underlying processes of morphogenesis.
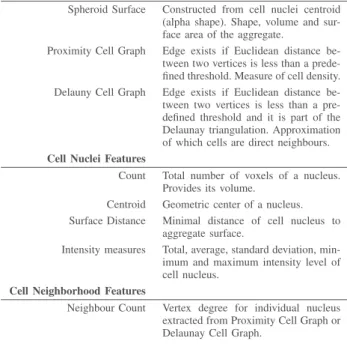
Scenario B: Fluorescence Microscopy Images of Organoids: Early on during mammalian embryo development, cells of the central part of the embryo (inner cell mass, ICM), differ-entiate into embryonic or extra-embryonic tissue. In mouse, the common model system, this occurs around day 3.5 after fertilisation. The decision of the cells can be inferred from the expression of the two transcription factors NANOG and GATA6 [22]. Quantification of the 3D spatial pattern which arises during cell differentiation is of major interest, as the results provide a basis for further studies of the mechanisms underlying cell differentiation. Current approaches of quan-tifying the pattern include 3D fluorescence microscopy, 3D segmentation of the cell nuclei and measuring the intensities of NANOG and GATA6 in the segmented nuclei [21], see Figure 1. As a result of the image analysis pipeline, more than 30 features for the individual cells and the whole organoid can be extracted [19], a selection of which you can find in Table II. For ICM organoids, the quantitative analysis indicates a local clustering of cells expressing NANOG and GATA6. The details of this clustering and its underlying mechanisms need further investigation. Simulations rely on agent-based models [23], [24]. These models incorporate physical interactions of the cells, cell signalling, cell division and cellular rearrange-ment. Testing and further improvement of these models relies on comparison of the modeling results with a quantitative description of the 3D protein expression patterns.
Based on the descriptions presented, we now proceed to formalize the requirements.
B. Task Extraction
In this subsection, we extract tasks and requirements of an immersive analysis platform for organoids and spheroids. [8] describe their development efforts for an immersive analysis workbench for multi-scale simulations capturing both low-level neural activity and large-scale interactions between re-gions of a macaque brain. They present their requirements analysis and extract a task-oriented list of functional require-ments (such as “Relate a geometric representation to activity
data”, “Control simulation playback”). [25] developed goal-oriented taxonomies for the analysis of immersive analytics applications. Goal-based tasks contain search, pattern recog-nition, spatial understanding, quantitative estimation and shape description. Supporting tasks contain segmentation and filter-ing, navigation, manipulation and view navigation, selection, and path following. In addition, they suggest the extraction of data visualization parameters, i.e. technique and algorithms, and display platform, and the characterisation of a data set in terms of dimensionality and temporal nature. [26] present a “5-questions framework” for the classification of immersive analytics applications based on locality, user composition, hardware, and subject matter, and apply a similar goal-based categorization. Considering these preceding works, we found providing both a high-level and goal-oriented descriptions as well as functional requirements closer related to software engineering to be most apt to our case.
C. Goals
Both groups of users who are interested in scenarios A and B, respectively, expressed the desire to compare simulated and empirical data into their analysis. Based on the analysis of the outlined use cases and user groups, we have identified the following high-level goals that our application has to support. G1 Gaining understanding of morphology and inner structure Both scenarios require the analysis of spatial structure of 3D data with explicit spatiality. Interior and exterior spatial features are relevant.
G2 Gaining understanding of derived/abstract features Other features of the data – such as measures based on local density, Delauny neighborhood graphs and Delauny triangulations – also need to be analysed. Many of these have a direct link to specific regions of the cell culture. G3 Gaining understanding of change over time Organic
systems are not static, and e.g. the differentiation process must be observed at multiple time steps.
G4 Communication and documentation of findings The ability to document, communicate, share, and collaborate upon findings is essential to the scientific work. G5 Collaborating locally / remotely / (a-)synchronously
Teams of scientists do not always work in close prox-imity, and current technology can easily be designed to overcome these constraints.
D. Functional Requirements
To facilitate the implementation of future functional proto-types and also to prioritize work, we extracted several func-tional requirements for an immersive biological workbench. Although we arrive at a slightly refined taxonomy, our results are in agreement with existing literature [8], [25], [27].
Rendering: We identified the following requirements that relate to the rendering facilities that have to be provided.
RR1 Render to immersive HMDs
RR2 Render cells based on segmented/simulated data RR3 Render volumetric data
Fig. 1. Current approach for studying spatial patterns of protein expression in ICM organoids. (A) Images of a central plane of an organoid for three different channels: nuclei staining and transcription factors GATA6 and NANOG (Confocal microscope, scale bar: 20 µm). (B) 3D image analysis pipeline including segmentation and cell graph approximation of cellular neighbourhood. (C) Quantification of the population composition of organoids as a whole and of the neighbourhood of individual cells. (D) Example visualisation of 3D expression patterns in organoids. For further details, see [21].
RR5 Provide interactive abstract visualizations
The application needs to provide spatial, scientific visualiza-tions of the data, with output capability to an HMD (RR1). This includes raw, volumetric empirical data, segmented data, and simulated data (RR2, RR3). For the analysis of data that is not inherently spatial (e.g. development of population counts), more abstract visualizations need to be provided, ranging from flat 2D plots (RR4) to 3D plots or graphs (RR5). The free or assisted arrangement of various views on the same data (e.g. different perspective) has already shown to be a well-received feature of immersive workbenches (RV1).
Views and Visualizations: The following capabilities relate to views on data, and the integration of such views.
RV1 Provide multiple views on one/multiple data set(s) RV2 Integrate and render data from different sources in a
consistent and comparable way
RV3 Allow for the selective visualization of one or multiple data channels
The desire to compare simulated with real-world data re-quires unified visualizations in terms of consistent symbolic semantics as well as arrangements and highlighting, etc. The application should allow to provide consistent visualizations for data sets that either have the same origin (e.g. segmented data and the volumetric source data sets) or show related subjects (e.g. data obtained from different sources), between which the user may choose as desired (RV2). Each data set provides multiple channels of data, e.g. position, size, color, translucency, gray value, or marker type which the user needs to be able to select and compare (RV3).
Control: The following capabilities relate to the control of time and (automated) control of the application based on user preferences or choices.
RC1 Provide means to select one/multiple time step(s)
RC2 Provide means for the tracking of individual cells or groups of cells over time
Visualization can further be aided by the placement of static or tracked (e.g. attached to a cell) markers or the visualization of gradients as vector flow fields. The choice of visualization is determined by the required measures that are used to derive new channels from the input data. As the data will often be available as time series, temporal navigation is required (RC1). Tracking or querying for information about a cell – when time series are available – is also a requirement (RC2).
Metrics and Transformations: The following capabilities relate to the transformation of data values and measures.
RM1 Provide appropriate metrics
RM2 Provide for the easy generation of data channel trans-formations (e.g. sum, max, average, accumulated sum) Additional measures include neighborhood densities and ab-stract information such as interaction graphs (RM1). In gen-eral, the user should be able to easily create new channels based on existing ones using standard analytical tools (RM2), e.g. through rolling averages or accumulative sums. However, it is highly dependent on the research question which specific tools the system should implement to avoid cluttering or ineffectiveness.
Filtering and Linking: The following capabilities relate to filtering and grouping of data.
RF1 Provide spatial filtering based on the position of cells RF2 Provide feature-based filtering based on data channels
of individual cells or groups of cells
RF3 Allow to identify cells (or data points to which cells contribute) across different views and facets
Considering individual visualizations, channels or measures, it is often necessary to filter, reduce, and query the data (RF1,RF2). The user should be able to create labels (groups)
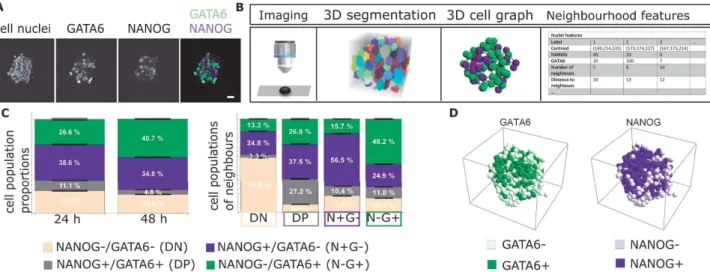
Fig. 2. Prototype I visualized MCTS simulation data as a larger-than-life spheroid (center). Cell colors (spheres, green to red) reflect oxygen saturation. Modification of the culling volume (corners depicted by white tripods) and time control is done using handheld controllers (bottom-right).
based on thresholds over one or multiple data channels. When crossing the boundaries between data set or visualization variants, different channels can also be used to hide, isolate or highlight the corresponding volumes or points in related views - e.g. volumetric data could be exposed based on the segmented data, or even simulated results (RF3).
Data Access: The following capabilities relate to the import, processing, and export of data.
RD1 Provide interfaces with data sources RD2 Provide interfaces with data sinks
The system needs to be able to import data from existing sources (RD1). The data can be categorized broadly by its origin, being either obtained by simulation or empirically in-cluding post-processing and segmentation to provide more data channels. Depending on the source, the fidelity will invariably be inconsistent even between data sets of the same category. Time series – which will provide most of the input data – are of different lengths and densities, with lower numbers of sample points for empirically obtained data and higher numbers for simulations. We make no assumptions about the source of the data, as it might be locally stored, remotely retrieved from a database, computed at runtime or on-demand by a simulation server. Furthermore, being able to export annotations and data in an open format is necessary to provide interoperability with established non-immersive systems (RD2).
This preliminary list of requirements inspires our future projects described in VI, and will be extended based on the insights gained.
IV. EXPLORATORYPROTOTYPES
In this section, we outline exploratory projects that we used to gather information about the potential use of immersive visualizations of biological models. Our first applications were tailored to the visualization of computationally simulated MCTS data, obtained by the MecaCell simulation. Simulation data could be received in real time, i.e. directly retrieved from a running simulation. Three major milestone applications have been singled out, each emphasizing slightly different require-ments and complementing features. Having observed a general interest in the scientific community in using off-the-shelf game
Fig. 3. Prototype II extended the scientific visualization with the ability to place multiple instances of the cell view in the scene. Additionally, plots of the overall development of the simulation could be added as a first step towards integrating more data channels.
Fig. 4. Prototype II: Multiple cut planes can be placed in the scene. Each cut plane defines a half-space to be culled. Cells are culled as a whole as soon as their center enters any such half-space. As an example of means to support the analysis of internal structure, an exploded view was added.
engines due to simplicity, availability and high visual fidelity they provide, we decided to pursue this direction despite the availability of powerful and proven frameworks, e.g. [13], [28]. Therefore, all three applications have been developed using the Unity game engine [29]. Rendering facilities provided by Unity3D have been exploited to allow the high number of spherical glyphs required to visualize MCTS [30].
Prototype I: Immersive Scientific Visualization of MCTS Sim-ulation Data
To visualize the results of an MCTS simulation, we imple-mented an immersive scientific visualization [31]. We used the tethered HTC Vive VR HMD [32] with two tracked handheld Vive wand controllers. The user’s point of view is depicted in Figure 2. Two thumb-controlled pie menus attached to the wand allowed to switch between different variables for visualization and to navigate through time. The user could scroll through simulation steps using VCR-style controls as well as a jog-dial thumb control that allowed to quickly sift through the simulated steps. Data is received from a remotely
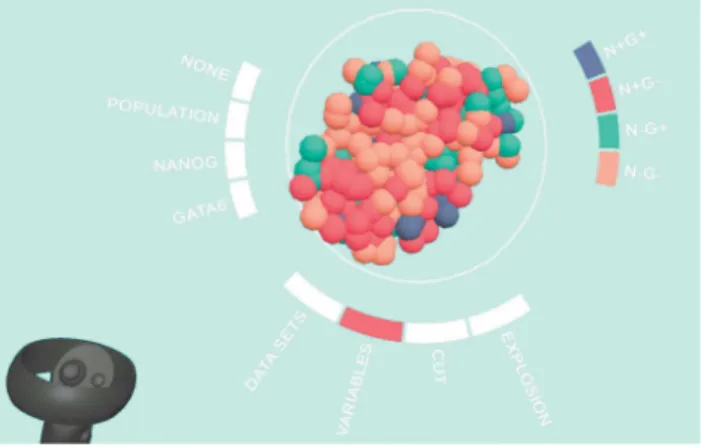
Fig. 5. Prototype III: Interactions were streamlined to a single, radial menu. Selecting between different data channels is done using auto-generated menus, activated by touching and clicking the menu with a handheld controller.
run simulation by means of a TCP connection. The system also supported replaying previously computed, stored simulation data. The available data channels, listed in Table I, were mapped to simulated cells (illustrated as spherical glyphs) using a simple color scheme. Growth was represented by scaling the spheres. To expose the interior of the spheroid, a culling volume could be modified by manipulating virtual widgets at the corners of the spheroid view using the handheld controllers and ’grab’ by holding a button. Even though rendering options for a plain cut surface – cutting through cells at the precise intersection with the volumes’ boundaries – had been applied, a simple culling of all cells whose centers lay outside of the volume was used for later versions. Prototype II: Immersive Analysis Workbench for MCTS Simu-lation Data
Based on our experience with Prototype I, and considering the functional priorities of the involved domain experts, we decided to support comparing different stages in the growth of a spheroid [30]. Following the taxonomy from [33], the system is a multi-view and multi-form visualization of a single simulation. Multi-views are available through independently configurable and controlled spatial visualizations of individual steps in the simulation. Multi-form visualization is realized by adding a set of global plots. Essentially, this allows to connect detailed information about one or several time steps with global information about the complete simulation run, fitting the focus+context category. This second prototype was inte-grated with data from a web-based extension to the previously used simulation. As a result, simulation control, simulation data and analysis interfaces were provided by a tandem of a web server and web application developed with NodeJS. Analytical views where provided using a VueJS single-page application that could serve a web-based interface. The result-ing plots were directly integrated in the VR application usresult-ing HTML pages rendered on a texture. In order to minimize the complexity of user interaction tasks, we decided to pursue a “single-button” approach to operating the simulation, where
the user only has to use a single button on the controller (akin to the left mouse button in traditional WIMP interfaces), and all interaction modalities should be either explicit (e.g. buttons displayed in VR) or natural (e.g. touch to grab or two-handed scale gesture to resize). The user could duplicate a view (scientific visualization of a spheroid, including spatial control widgets) by dragging the copy widget (on the left of the VCR controls) onto the view, thus creating a copy of the visualisation, and lastly, dropping it at the desired location. Each one of the integrated visualization views could be individually moved, scaled, and rotated. Below each view, a floating control panel allowed the user to interact with the visualization. Replay (play, pause, to first step, to latest step, slider-based time selection), and selection of the visualized data channel was integrated in this spatial interface. To support the analysis of the interior of the spheroid, we added an exploded view (slider, right side of the control panel), which modifies a position gain and scales down the radius of the cells [34]. Furthermore, to support the analysis of multiple spheroids, cut planes could be placed arbitrarily in space, moved, and scaled. When placing a spheroid in contact with a cut plane, the cells within the half-space of the cut plane would be culled.
Prototype III: Accessible Immersive Viewer for Segmented Fluorescence Microscopy Data
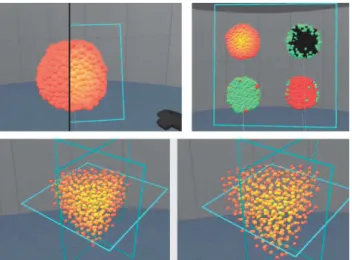
The third prototype (unpublished) was designed for the visualization of segmented fluorescence microscopy data and also to simplify setup costs and interactions. A representative screenshot is seen in Figure 5. We have been developing this application for the Oculus Quest standalone HMD, in contrast to the more powerful, but also less accessible, tethered HTC Vive HMD, which depends on a powerful PC workstation, limiting mobility. The data format of the provided segmented empirical data differs only slightly from the simulation data available of prototypes I and II, and the infrastructure for the visualization of arbitrary categorical data (population types) and continuous data (concentration of oxygen) could easily be adapted. Data can be imported from CSV files, a com-mon exchange format for segmented data in daily use. The mapping between the source file and the target variables (i.e. how the column headers are matched) can be configured to adapt to variations across data sets. A simple interface for the configuration of data channel properties (e.g. positional, categorical, or continuous; allows values, value ranges, desired color mappings, ...) was added. This allows for the automated generation of menus and parameterization of shaders. A uni-fied interface allows to choose between the interaction modes, which are the selection of data sets, the selection of visualized data channels, the placement of cut planes, and the selection of explosion gain level. This minimizes conflicts between input modalities. Especially the selection, translation, scaling of the spheroid, and the placement of cut planes interfered often with the manipulation of the cut plane. Therefore, when cut plane manipulation is selected, transformation of the spheroid is disabled. This shows the limits of a single-button approach and
conflicts in a spatial interface. In a traditional WIMP interface, additional modifier keys (alt, shift, ctrl) might be used to overload the mouse pointer and efficiently select between move, scale, explosion gain or cut plane placement.
V. DISCUSSION
In an iterative, incremental design and implementation pro-cess, we have created three prototypes for immersive analytics of cell-based biological data. Although the prototypes were praised by the domain experts, many of them struggled to explain how they would integrate this technology in their research routine. Also, technological expertise is required to set up the first two prototypes, making it prohibitively time consuming and tedious. Domain experts tend to use a multitude of tools to analyze their data, and spatiality has not been a major concern, so far. However, the sheer amount of data, the tedious slice-based analysis of 3D data and the lack of a unified framework for the different tasks renders immersive approaches appealing. When presenting prototype III, some users were surprised to find that many of the internal spatial features they expected to see in plain view were hardly noticeable using a non-augmented view. One example is the density of the neighborhood of cells, one of the interesting features of multi-cellular assemblies discovered through light-sheet microscopy [19]. Colorization of the model in 2D made differentiated regions obvious, while the actual differences in the relative distances of the cells are too small to be observable by the naked eye. Still, the 2D representation captures the true nature of the structure of these regions only in a limited way.
VI. NEXTSTEPS
Based on the experience gained from the prototypes de-scribed in Section IV and discussions with domain experts, we propose concepts for two specific projects. In general, we see the desire for remote, asynchronous, or face-to-face cooperation. Besides all potential benefits, the simple fact that head-mounted VR by purpose creates an isolated experience requires the developer to provide means of communicating the results to bystanders in one way or another [35], [36]. Domain experts and literature agree that it can contribute significantly to the usefulness of an immersive analysis application as a tool for communicating one’s findings. The creation of narratives using visual storytelling, i.e. to provide a clear, potentially inspiring rationale for the individual steps in an analytical process, supports the communication of discoveries to peers and stakeholders [8], [27]. Therefore, we plan to include appropriate means to combine visualized findings and messages with temporal or causal relations.
a) Immersive Workbench for Fluorescence Microscopy Data Analysis: Schmitz et al. [19] describe a current state-of-the-art analysis workbench for the structural analysis of spheroids using traditional desktop-based applications. How-ever, the presented measures can still not fully capture the 3D spatial expression patterns. We would like to support their ongoing efforts in the identification of novel quantitative measures for 3D spatial patterns. We plan to combine different
kinds of visualisation modes with filtering of cells by different features. The selected information can be saved in CSV files for further analysis. Integration of the organoid visualisations with plots or other data formats will foster a thorough un-derstanding. We expect the immersive application to extend, not replace the traditional desktop suite of applications. The latter is unlikely, as the high precision and resolution offered is still unmatched. We believe that such a cooperation can (a) benefit the domain experts through the addition of immersive scientific visualization and analysis tools of the data sets, and (b) provide a well-suited test- and benchmark-situation for such an immersive analytics workbench, due to the availability of existing tools and workflows to be used as reference.
b) Immersive Segmentation Ground-Truth Definition: We furthermore pursue an immersive, collaborative annotation tool for fluorescence microscopy data for the creation of “ground-truth” segmentations which form the benchmark for subse-quent automated segmentation. The tool that is currently most widely used for annotating fluorescence microscopy data is Fiji [6]. Image stacks from 3D microscopy are loaded into Fiji and are annotated slice by slice. For annotation of structures that extend over several slices, the plugin Segmentation Editor in Fiji provides a more efficient method. In this editor, the structure does not have to be annotated in every slice, but the annotation of intermediate slices is obtained by interpolating the information from surrounding slices. Due to the restriction of the data to 2D image slices, annotating a nucleus centroid or identifying all neighbours of a given cell is particularly difficult. For this application domain there is a special interest in collaborative features, as validity of ground-truth is of utmost importance for the accuracy of automated segmentation that may be used for years of research.
VII. CONCLUSION
Based on two scenarios provided by domain experts in computational modeling and theoretical biology, we elaborated on the requirements of an immersive analytical workbench that can span the bridge between in-silico simulated and in-vitro obtained data on the structure of multi-cellular compounds, specifically organoids and spheroids. We summarized three prototypes that evolved and explored different approaches to the interaction with immersive visualization of such data sets and immersive workbenches, and introduce two applications that we currently pursue. We are convinced that VR technology can benefit the “everyday” work of biologists if applied to apt tasks. We selected user scenarios where spatial data is at the center, yet the raw spatial visualization does not make the relevant features obvious. At this point, all augmentation and the support by immersive analytics tools, the linking of different views and forms on a data set can bridge the gap in understanding. We see growing importance in the seamless integration of analysis tools with interactive simulations to improve both accessibility as well as efficiency.
REFERENCES
[1] K. Duval, H. Grover, L.-H. Han, Y. Mou, A. F. Pegoraro, J. Fredberg, and Z. Chen, “Modeling physiological events in 2d vs. 3d cell culture,”
Physiology, vol. 32, no. 4, pp. 266–277, Jul 2017. [Online]. Available: http://dx.doi.org/10.1152/physiol.00036.2016
[2] S. Kessel, S. Cribbes, O. D´ery, D. Kuksin, E. Sincoff, J. Qiu, and L. L.-Y. Chan, “High-throughput 3d tumor spheroid screening method for cancer drug discovery using celigo image cytometry,” SLAS TECHNOLOGY:
Translating Life Sciences Innovation, vol. 22, no. 4, pp. 454–465, Jun 2016. [Online]. Available: http://dx.doi.org/10.1177/2211068216652846 [3] I. Smyrek, B. Mathew, S. C. Fischer, S. M. Lissek, S. Becker, and E. H. K. Stelzer, “E-cadherin, actin, microtubules and fak dominate different spheroid formation phases and important elements of tissue integrity,” Biology Open, vol. 8, no. 1, p. bio037051, Dec 2018. [Online]. Available: http://dx.doi.org/10.1242/bio.037051
[4] H. Clevers, “Modeling development and disease with organoids,”
Cell, vol. 165, no. 7, pp. 1586 – 1597, 2016. [Online]. Available: http://www.sciencedirect.com/science/article/pii/S0092867416307292 [5] D. Bernard, O. Mondesert, A. Gomes, Y. Duthen, V. Lobjois,
S. Cussat-Blanc, and B. Ducommun, “A checkpoint-oriented cell cycle simulation model,” Cell Cycle, vol. 18, no. 8, pp. 795–808, Apr 2019. [Online]. Available: http://dx.doi.org/10.1080/15384101.2019.1591125 [6] J. Schindelin, I. Arganda-Carreras, E. Frise, V. Kaynig, M. Longair,
T. Pietzsch, S. Preibisch, C. Rueden, S. Saalfeld, B. Schmid, J.-Y. Tinevez, D. J. White, V. Hartenstein, K. Eliceiri, P. Tomancak, and A. Cardona, “Fiji: an open-source platform for biological-image analysis,” Nature Methods, vol. 9, no. 7, pp. 676–682, 2012. [Online]. Available: https://doi.org/10.1038/nmeth.2019
[7] B. Laha, K. Sensharma, J. D. Schiffbauer, and D. A. Bowman, “Effects of immersion on visual analysis of volume data,” IEEE Transactions on
Visualization and Computer Graphics, vol. 18, no. 4, pp. 597–606, Apr 2012. [Online]. Available: http://dx.doi.org/10.1109/TVCG.2012.42 [8] C. Nowke, M. Schmidt, S. J. van Albada, J. M. Eppler, R. Bakker,
M. Diesrnann, B. Hentschel, and T. Kuhlen, “Visnest - interactive analysis of neural activity data,” 2013 IEEE Symposium on Biological
Data Visualization (BioVis), Oct 2013. [Online]. Available: http: //dx.doi.org/10.1109/BioVis.2013.6664348
[9] K. W. Eliceiri, M. R. Berthold, I. G. Goldberg, L. Ib´a˜nez, B. S. Manjunath, M. E. Martone, R. F. Murphy, H. Peng, A. L. Plant, B. Roysam, N. Stuurman, J. R. Swedlow, P. Tomancak, and A. E. Carpenter, “Biological imaging software tools,” Nature
Methods, vol. 9, no. 7, pp. 697–710, 2012. [Online]. Available: https://doi.org/10.1038/nmeth.2084
[10] C. T. Rueden, J. Schindelin, M. C. Hiner, B. E. DeZonia, A. E. Walter, E. T. Arena, and K. W. Eliceiri, “Imagej2: Imagej for the next generation of scientific image data,” BMC Bioinformatics, vol. 18, no. 1, Nov 2017. [Online]. Available: http://dx.doi.org/10.1186/s12859-017-1934-z [11] P. Kankaanp¨a¨a, L. Paavolainen, S. Tiitta, M. Karjalainen, J. P¨aiv¨arinne, J. Nieminen, V. Marjom¨aki, J. Heino, and D. J. White, “Bioimagexd: an open, general-purpose and high-throughput image-processing platform,”
Nature Methods, vol. 9, no. 7, pp. 683–689, Jun 2012. [Online]. Available: http://dx.doi.org/10.1038/nmeth.2047
[12] H. Peng, Z. Ruan, F. Long, J. H. Simpson, and E. W. Myers, “V3d enables real-time 3d visualization and quantitative analysis of large-scale biological image data sets,” Nature Biotechnology, vol. 28, no. 4, pp. 348–353, Mar 2010. [Online]. Available: http://dx.doi.org/10.1038/nbt.1612
[13] W. Schroeder, K. Martin, and B. Lorensen, The Visualization Toolkit, 4th ed. Kitware, 2006.
[14] Z. Lv, A. Tek, F. Da Silva, C. Empereur-Mot, M. Chavent, and M. Baaden, “Game on, science - how video game technology may help biologists tackle visualization challenges,” PLoS ONE, vol. 8, no. 3, p. e57990, Mar 2013. [Online]. Available: http: //dx.doi.org/10.1371/journal.pone.0057990
[15] M. D¨aschinger, A. Knote, R. Green, and S. Von Mammen, “A human-in-the-loop environment for developmental biology,” Proceedings of the
14th European Conference on Artificial Life ECAL 2017, Sep 2017. [Online]. Available: http://dx.doi.org/10.7551/ecal a 078
[16] T. W. Kuhlen and B. Hentschel, “Towards an explorative visual analysis of cortical neuronal network simulations,” Brain-Inspired
Computing, pp. 171–183, 2014. [Online]. Available: http://dx.doi.org/ 10.1007/978-3-319-12084-3 14
[17] J. E. Stone, W. R. Sherman, and K. Schulten, “Immersive molecular visualization with omnidirectional stereoscopic ray tracing and remote rendering,” 2016 IEEE International Parallel and Distributed
Processing Symposium Workshops (IPDPSW), May 2016. [Online]. Available: http://dx.doi.org/10.1109/IPDPSW.2016.121
[18] C. J. Daly, “Examining vascular structure and function using confocal microscopy and 3d imaging techniques,” Biomedical Visualisation, pp. 97–106, 2019. [Online]. Available: http://dx.doi.org/10.1007/ 978-3-030-06070-1 8
[19] A. Schmitz, S. C. Fischer, C. Mattheyer, F. Pampaloni, and E. H. K. Stelzer, “Multiscale image analysis reveals structural heterogeneity of the cell microenvironment in homotypic spheroids,” Sci Rep, vol. 7, p. 43693, 03 2017.
[20] J. Disset, S. Cussat-Blanc, and Y. Duthen, “Mecacell: an open-source efficient cellular physics engine,” 07/20/2015-07/24/2015, Jul 2015. [On-line]. Available: http://dx.doi.org/10.7551/978-0-262-33027-5-ch014 [21] B. Mathew, S. Mu˜noz-Descalzo, E. Corujo-Simon, C. Schr¨oter,
E. H. Stelzer, and S. C. Fischer, “Mouse icm organoids reveal three-dimensional cell fate clustering,” Biophysical Journal, vol. 116, no. 1, pp. 127–141, Jan 2019. [Online]. Available: http: //dx.doi.org/10.1016/j.bpj.2018.11.011
[22] C. S. Simon, A.-K. Hadjantonakis, and C. Schr¨oter, “Making lineage decisions with biological noise: Lessons from the early mouse embryo,”
Wiley Interdisciplinary Reviews: Developmental Biology, vol. 7, no. 4, p. e319, Apr 2018. [Online]. Available: http://dx.doi.org/10.1002/wdev.319 [23] P. Krupinski, V. Chickarmane, and C. Peterson, “Simulating the mammalian blastocyst - molecular and mechanical interactions pattern the embryo,” PLoS Computational Biology, vol. 7, no. 5, May 2011. [Online]. Available: http://dx.doi.org/10.1371/journal.pcbi.1001128 [24] A. Tosenberger, D. Gonze, S. Bessonnard, M. Cohen-Tannoudji,
C. Chazaud, and G. Dupont, “A multiscale model of early cell lineage specification including cell division,” npj Systems Biology
and Applications, vol. 3, no. 1, Jun 2017. [Online]. Available: http://dx.doi.org/10.1038/s41540-017-0017-0
[25] B. Laha, D. A. Bowman, D. H. Laidlaw, and J. J. Socha, “A classification of user tasks in visual analysis of volume data,” 2015
IEEE Scientific Visualization Conference (SciVis), Oct 2015. [Online]. Available: http://dx.doi.org/10.1109/SciVis.2015.7429485
[26] K. Marriott, J. Chen, M. Hlawatsch, T. Itoh, M. A. Nacenta, G. Reina, and W. Stuerzlinger, “Just 5 questions: Toward a design framework for immersive analytics,” in Immersive Analytics, K. Marriott, F. Schreiber, T. Dwyer, K. Klein, N. H. Riche, T. Itoh, W. Stuerzlinger, and B. H. Thomas, Eds. Springer, Cham, 2018.
[27] T. W. Kuhlen and B. Hentschel, “Towards the ultimate display for neuro-scientific data analysis,” Brain-Inspired Computing, pp. 157–168, 2016. [Online]. Available: http://dx.doi.org/10.1007/978-3-319-50862-7 12 [28] F. Niebling, A. Kopecki, and M. Aum¨uller, “Integrated simulation
workflows in computer aided engineering on hpc resources.” in
Advances in Parallel Computing. IOS Press, 2011, pp. 565–572. [Online]. Available: http://dx.doi.org/10.3233/978-1-61499-041-3-565 [29] Unity Technologies Inc., “Unity3D,” https://unity.com.
[30] A. Knote, D. Bernard, S. von Mammen, and S. Cussat-Blanc, “Interactive visualization of multi-cellular tumor spheroids,” Poster, Visualizing Biological Data VIZBI 2019, Heidelberg, Germany, 2019. [Online]. Available: http://vizbi.org/Posters/2019/A14
[31] A. Fenies, A. Knote, D. Bernard, S. von Mammen, V. Lobjois, B. Ducommun, and S. Cussat-Blanc, “Exploring multi-cellular tumor spheroids in virtual reality,” Poster, Abstract, 14´eme Journ´ees Canc´eropˆole Sud-Ouest, Toulouse, France, 2018. [Online]. Available: http://www.canceropole-gso.org/download/fichiers/ 4099/JGSO2018-Booklet def.pdf
[32] HTC Corporation, “HTC Vive,” https://www.vive.com.
[33] J. C. Roberts, “State of the art: Coordinated & multiple views in exploratory visualization,” Fifth International Conference on
Coordinated and Multiple Views in Exploratory Visualization (CMV 2007), Jul 2007. [Online]. Available: http://dx.doi.org/10.1109/CMV. 2007.20
[34] I. Viola and M. E. Gr¨oller, “Smart visibility in visualization,” in
Computational Aesthetics, 2005, pp. 209–216.
[35] P. Isenberg, B. Lee, H. Qu, and M. Cordeil, “Immersive visual data stories,” Lecture Notes in Computer Science, pp. 165–184, 2018. [Online]. Available: http://dx.doi.org/10.1007/978-3-030-01388-2 6 [36] B. Lee, N. H. Riche, P. Isenberg, and S. Carpendale, “More than
telling a story: Transforming data into visually shared stories,” IEEE
Computer Graphics and Applications, vol. 35, no. 5, pp. 84–90, Sep 2015. [Online]. Available: http://dx.doi.org/10.1109/MCG.2015.99 [37] K. Marriott, F. Schreiber, T. Dwyer, K. Klein, N. H. Riche, T. Itoh,
W. Stuerzlinger, and B. H. Thomas, Eds., Immersive Analytics. Springer, Cham, 2018.