HAL Id: hal-03006176
https://hal.archives-ouvertes.fr/hal-03006176
Submitted on 15 Nov 2020
HAL is a multi-disciplinary open access
archive for the deposit and dissemination of
sci-entific research documents, whether they are
pub-lished or not. The documents may come from
teaching and research institutions in France or
abroad, or from public or private research centers.
L’archive ouverte pluridisciplinaire HAL, est
destinée au dépôt et à la diffusion de documents
scientifiques de niveau recherche, publiés ou non,
émanant des établissements d’enseignement et de
recherche français ou étrangers, des laboratoires
publics ou privés.
Anke van Dijck, Susana Barbosa, Patricia Bermudez-Martin, Olfa Khalfallah,
Cyprien Gilet, Emanuela Martinuzzi, Ellen Elinck, R Kooy, Nicolas
Glaichenhaus, Laetitia Davidovic
To cite this version:
Anke van Dijck, Susana Barbosa, Patricia Bermudez-Martin, Olfa Khalfallah, Cyprien Gilet, et al..
Reduced serum levels of pro-inflammatory chemokines in fragile X syndrome. BMC Neurology, BioMed
Central, 2020, 20, �10.1186/s12883-020-01715-2�. �hal-03006176�
R E S E A R C H A R T I C L E
Open Access
Reduced serum levels of pro-inflammatory
chemokines in fragile X syndrome
Anke Van Dijck
1†, Susana Barbosa
2†, Patricia Bermudez-Martin
2, Olfa Khalfallah
2, Cyprien Gilet
3,
Emanuela Martinuzzi
2, Ellen Elinck
1, R. Frank Kooy
1, Nicolas Glaichenhaus
2and Laetitia Davidovic
2*Abstract
Background: Fragile X syndrome (FXS) is the most frequent cause of inherited intellectual disability and the most commonly identified monogenic cause of autism. Recent studies have shown that long-term pathological consequences of FXS are not solely confined to the central nervous system (CNS) but rather extend to other physiological dysfunctions in peripheral organs. To gain insights into possible immune dysfunctions in FXS, we profiled a large panel of immune-related biomarkers in the serum of FXS patients and healthy controls.
Methods: We have used a sensitive and robust Electro Chemi Luminescence (ECL)-based immunoassay to measure the levels of 52 cytokines in the serum of n = 25 FXS patients and n = 29 healthy controls. We then used univariate statistics and multivariate analysis, as well as an advanced unsupervised clustering method, to identify combinations of immune-related biomarkers that could discriminate FXS patients from healthy individuals.
Results: While the majority of the tested cytokines were present at similar levels in FXS patients and healthy individuals, nine chemokines, CCL2, CCL3, CCL4, CCL11, CCL13, CCL17, CCL22, CCL26 and CXCL10, were present at much lower levels in FXS patients. Using robust regression, we show that six of these biomarkers (CCL2, CCL3, CCL11, CCL22, CCL26 and CXCL10) were negatively associated with FXS diagnosis. Finally, applying the K-sparse unsupervised clustering method to the biomarker dataset allowed for the identification of two subsets of individuals, which essentially matched the FXS and healthy control categories.
Conclusions: Our data show that FXS patients exhibit reduced serum levels of several chemokines and may therefore exhibit impaired immune responses. The present study also highlights the power of unsupervised clustering methods to identify combinations of biomarkers for diagnosis and prognosis in medicine. Keywords: Fragile X syndrome, Cytokines, Chemokines, Biomarkers, Clustering, Autism spectrum disorders, Intellectual disability
Background
Fragile X syndrome (FXS) is the most frequent cause of inherited intellectual disability (ID) and the most com-monly identified monogenic cause of autism spectrum dis-orders (ASD) [1,2]. This X-linked genetic disease is caused by the silencing of the Fragile X Mental Retardation 1
(FMR1) gene positioned in Xq27.3 [3]. FXS is more preva-lent in males (1.4:1000) than in females (0.9/10,000) and females tend to display milder impairments [4]. In FXS pa-tients, a dynamic mutation abnormally increases the num-ber of CGG repeats in the first exon of the FMR1 gene, above the premutation threshold of 200 repeats, leading to their hypermethylation and the subsequent absence of its gene product FMRP, an RNA-binding protein controlling translation [5,6]. Although a monogenic disorder, FXS is a disease of complex aetiology. FXS prominent phenotypes © The Author(s). 2020 Open Access This article is licensed under a Creative Commons Attribution 4.0 International License, which permits use, sharing, adaptation, distribution and reproduction in any medium or format, as long as you give appropriate credit to the original author(s) and the source, provide a link to the Creative Commons licence, and indicate if changes were made. The images or other third party material in this article are included in the article's Creative Commons licence, unless indicated otherwise in a credit line to the material. If material is not included in the article's Creative Commons licence and your intended use is not permitted by statutory regulation or exceeds the permitted use, you will need to obtain permission directly from the copyright holder. To view a copy of this licence, visithttp://creativecommons.org/licenses/by/4.0/. The Creative Commons Public Domain Dedication waiver (http://creativecommons.org/publicdomain/zero/1.0/) applies to the data made available in this article, unless otherwise stated in a credit line to the data.
* Correspondence:davidovic@ipmc.cnrs.fr
†Anke Van Dijck and Susana Barbosa contributed equally to this work. 2Université Côte d’Azur, CNRS, Institut de Pharmacologie Moléculaire et
Cellulaire, Valbonne, France
notably include intellectual disability, epilepsy, anxiety linked to sensory hyperarousal, attention deficits and hyper-activity disorder [7]. Furthermore, stereotypies and social interaction deficits lead to ASD diagnosis in 60% of boys and 25% of girls with FXS [8]. FXS is also accompanied by physical and anatomical abnormalities (macroorchidism, elongated face, hyperextensible finger joints) and recur-rent health problems such as gastro-intestinal dysfunc-tions [7, 9]. Recurrent media otites are frequent in FXS patients (52.6% versus 12.6% in neurotypical controls), as well sinusitis, although the incidence of other types of infections is not different in FXS patients [9, 10]. This suggests that the long-term pathological conse-quences of this neurodevelopmental disorder are not solely confined to the central nervous system and could extend to other physiological dysfunctions in peripheral systems.
To study possible peripheral consequences of FMR1-deficiency, some authors have compared the levels of serum and plasma biomarkers between FXS patients and healthy controls. Prior studies have focused on metabolic markers and have highlighted reduced levels of choles-terol [11–13] and abnormal abundances of the metabolic hormones leptin and adiponectin [14]. In a translational study addressing metabolic consequences of FMR1-defi-ciency both in a FXS mouse model and in FXS patients, we have recently shown that FXS patients display reduc-tions in circulating glucose and increases in both free fatty acids and insulin, underlining metabolic anomalies in FXS [15]. Regarding possible immune dysfunctions in FXS, only a few studies have characterized FXS patients for immune biomarkers such as cytokines. These small circulating molecules are secreted by both immune and non-immune cell types and include notably interleukins (IL), chemokines, interferons (IFN) and members of the Tumour Necrosis Factor (TNF) family. Cytokines regu-late the differentiation, activation and effector function of all immune cell types [16]. While inflammatory che-mokines attract immune cells to inflammatory sites, homeostatic chemokines control cell migration during development. To our knowledge, only two studies have investigated possible immune dysfunction in FXS pa-tients. In a first study, Ashwood et al. have assessed plasma samples from FXS male patients (n = 40 FXS with ASD; n = 64 FXS without ASD) and typically devel-opping controls (n = 19) for the levels of 22 cytokines. Compared to healthy controls, the authors found that FXS patients exhibited higher plasma levels of the pro-inflammatory cytokine IL-1α and IL-12p40, and lower levels of the chemokines CCL2, CCL5, CCL11 and CXCL10 [17]. In a second study, Careaga et al. com-pared peripheral blood mononuclear cells (PBMC) from FXS children (n = 27) and healthy age-matched individ-uals (n = 8) for their ability to secrete pro-inflammatory
cytokines in response to lipopolysaccharides (LPS) and Phytohemagglutin (PHA) [18]. While the basal immune responsiveness of PBMC to LPS and PHA was not im-pacted, PBMC from FXS patients secreted higher levels of the pro-inflammatory cytokines IL-6 and IL-12p40 compared to those from healthy controls in the presence of the group I mGluR agonist DHPG. Taken together, these two studies suggested that FXS patients may ex-hibit immune dysfunction. To further investigate this issue, we have used a highly sensitive and robust multi-plex immunoassay to assess serum samples from FXS patients (n = 25) and age- and sex-matched controls (n = 29) for the level of 52 immune-related biomarkers. We then analysed this dataset using both standard uni-variate statistical method, robust Elastic Net regression and an advanced unsupervised clustering method.
Methods Study sample
This study entitled“Identification of Fragile X Syndrome soluble biomarkers” was approved by the medical ethics committee of the University of Antwerp in Belgium Protocol agreement #: B300201523589) and conducted in accordance with statutes and regulations regarding the protection of the right and welfare of human sub-jects’ participation in biomedical research (World Dec-laration of Helsinki). In a previous study which found significant alterations in circulating cytokine levels in FXS patients compared to healthy controls [17], the exact effect sizes were not indicated and we therefore could not use previous knowledge to compute power. We therefore conducted a power analysis to determine the sample size required to identify differences for a the-oretical large effect size (Cohen’s δ > 0.75) with a power of 80% and an error rate set at 5%. Since we had no a priori knowledge regarding the normality of the to be obtained data, we computed the sample sizes under two comparison conditions and found that n = 26 individ-uals/group would be required for Student’s T-test com-parisons, while n = 30/group would be required for Mann & Whitney non-parametric comparisons between the two groups. Based on this, we aimed to recruit n = 30 patients and n = 30 matching controls, at the Centre for Medical Genetics of the University of Antwerp (Ant-werp, Belgium), at which patients are regularly received for a yearly consultation.
As a result, 29 healthy subjects (24 males, 5 females) and 25 fragile X patients (20 males, 5 females) of matching ages and ethnicity were enrolled (Table 1). The absence/ presence of the fragile X mutation was confirmed in all participants by an accredited laboratory, using a CGG-repeat PCR and Southern Blotting on DNA isolated from blood. Inclusion criteria were age 6–18 and a stable medi-cation regimen for the previous 8 weeks. Out of the 54
subjects enrolled, 2 FXS patients were actually under Rita-line treatment (X12 and X25) and were advised not to take the drug on the day of sampling. The other subjects were not under any type of medication. Clinical examin-ation and parental questionnaire confirmed that none of the enrolled subjects presented with a recent infection episode on the day of sampling. Exclusion criteria were: recent history of seizure, epilepsy, blackouts, clinically un-stable medical disease, progressive CNS disease/disorder, history of psychiatric disorders, behavioural dysfunction to the point that subject cannot cooperate for testing and history of pathologies which could modify blood biochem-istry. Written informed consent was obtained from each participant or his/her legal guardian before research par-ticipation. To avoid stress induced by fasting to Fragile X patients, individuals involved in the study were not ad-vised to fast prior sampling. Blood was withdrawn in serum collection tubes (BD Vacutainer Serum Separ-ator Tubes), incubated for at least 30 min at room temperature then centrifuged at 2000 rpm, 10 min, at room temperature. Serum was collected, aliquoted and immediately snapped-frozen in liquid nitrogen prior storage at − 80 °C until use. Information regarding sex, age, body mass index (BMI) and time of blood sampling were also retrieved.
Biomarkers measurements
Serum samples were assessed for biomarker levels using the V-plex® kits for the Meso Scale Discovery (MSD)
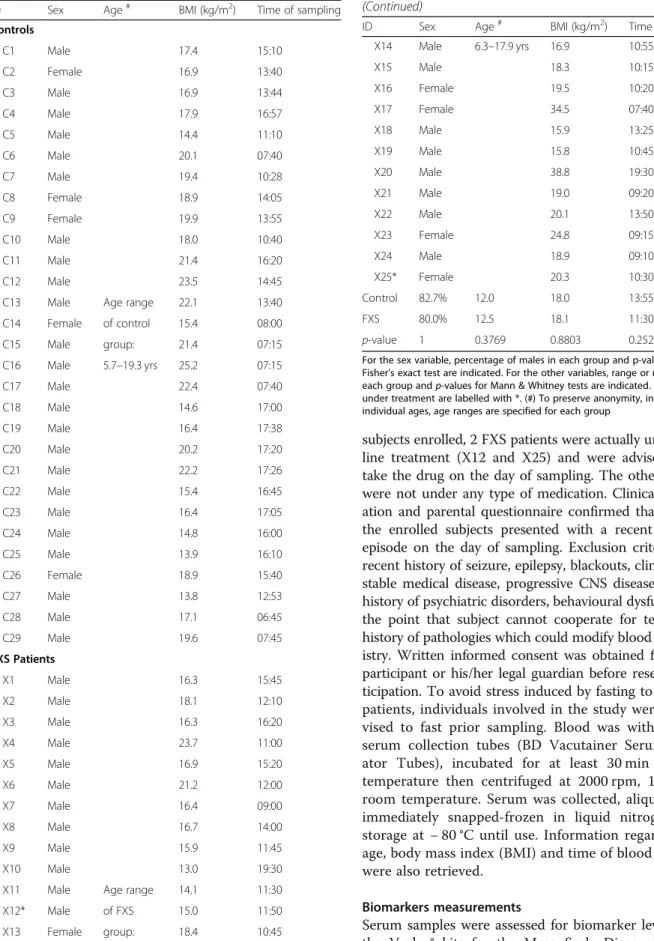
Table 1 Characteristics of FXS patients and healthy controls
ID Sex Age# BMI (kg/m2) Time of sampling Controls C1 Male 17.4 15:10 C2 Female 16.9 13:40 C3 Male 16.9 13:44 C4 Male 17.9 16:57 C5 Male 14.4 11:10 C6 Male 20.1 07:40 C7 Male 19.4 10:28 C8 Female 18.9 14:05 C9 Female 19.9 13:55 C10 Male 18.0 10:40 C11 Male 21.4 16:20 C12 Male 23.5 14:45 C13 Male Age range 22.1 13:40 C14 Female of control 15.4 08:00 C15 Male group: 21.4 07:15 C16 Male 5.7–19.3 yrs 25.2 07:15 C17 Male 22.4 07:40 C18 Male 14.6 17:00 C19 Male 16.4 17:38 C20 Male 20.2 17:20 C21 Male 22.2 17:26 C22 Male 15.4 16:45 C23 Male 16.4 17:05 C24 Male 14.8 16:00 C25 Male 13.9 16:10 C26 Female 18.9 15:40 C27 Male 13.8 12:53 C28 Male 17.1 06:45 C29 Male 19.6 07:45 FXS Patients X1 Male 16.3 15:45 X2 Male 18.1 12:10 X3 Male 16.3 16:20 X4 Male 23.7 11:00 X5 Male 16.9 15:20 X6 Male 21.2 12:00 X7 Male 16.4 09:00 X8 Male 16.7 14:00 X9 Male 15.9 11:45 X10 Male 13.0 19:30 X11 Male Age range 14.1 11:30 X12* Male of FXS 15.0 11:50 X13 Female group: 18.4 10:45
Table 1 Characteristics of FXS patients and healthy controls (Continued)
ID Sex Age# BMI (kg/m2) Time of sampling
X14 Male 6.3–17.9 yrs 16.9 10:55 X15 Male 18.3 10:15 X16 Female 19.5 10:20 X17 Female 34.5 07:40 X18 Male 15.9 13:25 X19 Male 15.8 10:45 X20 Male 38.8 19:30 X21 Male 19.0 09:20 X22 Male 20.1 13:50 X23 Female 24.8 09:15 X24 Male 18.9 09:10 X25* Female 20.3 10:30 Control 82.7% 12.0 18.0 13:55 FXS 80.0% 12.5 18.1 11:30 p-value 1 0.3769 0.8803 0.2527
For the sex variable, percentage of males in each group and p-value for Fisher’s exact test are indicated. For the other variables, range or medians of each group and p-values for Mann & Whitney tests are indicated. Patients under treatment are labelled with *. (#) To preserve anonymity, instead of individual ages, age ranges are specified for each group
analytical platform, according to manufacturer’s instruc-tions. We used the following kits: Human Cytokine 30-Plex, V-PLEX Plus Th17 Panel 1, Human Chemokine Panel 2 and Vascular Injury Panel 2 to measure immune-related biomarkers: CCL1, CCL2, CCL3, CCL4, CCL11, CCL13, CCL15, CCL17, CCL19, CCL20, CCL22, CCL26, CCL27, CXCL1, CXCL5, CXCL10, CXCL11, CXCL12, CX3CL1, GM-CSF, IFN-γ, IL-1α, IL-1β, IL-2, IL-4, IL-5, IL-6, IL-7, IL-8, IL-10, IL-12p40, IL-12p70, IL-13, IL-15, 16, 17A, 17B, 17E, 17A/F, 21, 22, IL-23, IL-27, IL-31, IL-33, TNF-α, TNF-β, C-reactive protein (CRP), Macrophage Migration Inhibitory Factor (MIF), SAA, sICAM-1, sVCAM-1 and VEGF-A. All 54 samples (sera from n = 29 controls and n = 25 FXS patients) were systematically analysed on the same plate to limit mea-surements biases. The concentration of each marker was calculated using the MSD software. The 0 value was im-puted for concentrations which appeared below the lower limit of detection as determined by the MSD software.
Statistical analysis
The distribution of biomarkers levels appeared non-normal in both groups, even when log-transformation was applied. Therefore, comparison analyses were per-formed using the non-parametric Mann & Whitney U-test with Bonferroni’s multiple U-test correction. Statistical significance was set according to a corrected p-value (p) < 0.05. Only significant differences are displayed on the graphs. We computed the r effect size statistic for the Mann–Whitney U-test, which corresponds to the Z value from the test divided by the total number of obser-vations. Statistics of effect size for the Mann–Whitney U-test assesses the degree to which one group has data with higher ranks compared to the other group and un-like p-values, they are not affected by sample size.
Elastic Net logistic regression models were implemented with the aim of performing variable selection, leading to sparser final model, in agreement with previous recom-mendations [19]. To study the association between 9 dysregulated chemokines identified by univariate analysis (CCL2, CCL3, CCL4, CCL11, CCL13, CCL17, CCL22, CCL26 and CXCL10) and FXS diagnosis, adjusting for age, BMI and time of sampling, we used robust regression with 2000 subsampling steps. We used the recent R pack-age enetLTS: Robust and Sparse Methods for High Di-mensional Linear and Logistic Regression developed by Kurnaz et al. [20,21]. As this method currently does not handle categorical variables such as sex, the analysis was also rerun on a reduced dataset consisting of male subjects only.
Correlations between cytokine pairs identified in the clustering analysis were computed using the Spearman’s ρ correlation coefficient rank test with Benjamini & Hochberg’s multiple test correction.
Statistical analyses were performed using R and graphs generated using GraphPad Prism version 6.00 for iOS (GraphPad Software, USA).
Over-representation analysis
To generate the chemokine receptor interaction table (Additional file 1: Fig. S1), we used the InnateDB data-base [22], the expert-curated reference database in the IUPHAR/BPS Guide to Pharmacology [23] and a recent review of literature [16]. The webtool from the InnateDB database [22] was used to determine over-represented pathways within the set of 9 dysregulated chemokines.
Clustering analysis
Clustering analysis was performed using K-sparse algo-rithm [24]. K-sparse clustering aims at identifying dis-criminated clusters, by transforming the space of the features’ (biomarkers concentration) and removing the features which appear the less pertinent for the identifi-cation of clusters. As an input dataset, we enter the raw values of concentrations for each feature and each sub-ject in the K-sparse algorithm. A pre-processing step is embedded in the K-sparse algorithm, which allows the automated normalization of the features to guarantee the convergence of the algorithm, as described in [24]. Then, for some initial labels Y, the first step of K-sparse computes a weighted projection matrix W which linearly combines the features such that most samples are pro-jected close to the centroid of their associated cluster. The clustering computed by K-sparse therefore con-siders the possible presence of outliers or extreme values through the weighted linear combination of the selected features. A sparsity constraint on W allows removal of features which are not sufficiently relevant to discrimin-ate these clusters according to the fixed labels Y. The second step aims to fix this optimized weighted matrix W and to minimize the Within Cluster Sum of Squares (WCSS) by running the k-means algorithm in the pro-jected space. In other words, this second step aims to update the labels according to the previously weighted and combined features. By repeating these two alternat-ing steps, K-sparse algorithm converges to a solution. Fi-nally, the t-Distributed Stochastic Neighbour Embedding (t-SNE) method is used to render a graphical output of clustering. Complete code of the K-sparse algorithm will be made available upon request.
Results
Immune markers analysis
We have analysed serum samples of 25 FXS patients (n = 20 males; n = 5 females) and 29 healthy controls (n = 24 males; n = 5 females) (Table 1). The two groups did not differ in terms of sex proportions, age, BMI or time of sampling (Table 1). Fifty-two cytokines and
inflammation and tissue damage markers were quantified. Out of these biomarkers, 6 cytokines (IL-1α, IL-1β, IL-2, IL-4, IL-5 and IL-13) were below the lower limit of detec-tion in more that 20% of control samples (Addidetec-tional file2: Table S1) and were therefore not retained for downstream analysis. We then used univariate statistical methods to compare the levels of the remaining biomarkers in FXS patients and healthy controls. The majority of these biomarkers were present at similar levels in patients and controls (Additional file3: Table S2). In contrast, 10 bio-markers were differentially expressed between FXS patients and controls (p-value < 0.05, Additional file 3: Table S2): CCL2, CCL3, CCL4, CCL11, CCL13, CCL17, CCL22,
CCL26, CXCL10 and IL-15. After multiple testing correc-tion, only the 9 chemokines appeared significantly de-creased in FXS patients, as compared to controls (adjusted p-value < 0.05, Additional file3: Table S2, Fig.1). Large ef-fect sizes (0.5 < r coefficient < 0.8) were observed for all dys-regulated chemokines except for CCL4 in which the effect size was medium (0.2 < r coefficient < 0.5) (Additional file3: Table S2). The same 10 biomarkers were significantly dys-regulated in the dataset reduced to male subjects (p-value < 0.05, Additional file 3: Table S2). After multiple testing correction, seven out of the 9 chemokines identified in the full dataset (CCL2, CCL11, CCL13, CCL17, CCL22, CCL26 and CXCL10) were also significantly reduced in FXS male
Fig. 1 Levels of chemokines downregulated in FXS patients as compared to controls. Data are presented as a box-and-whiskers plot; n = 29 controls, n = 25 FXS patients. The box plots the first quartile, median and third quartile of the values. The whiskers are drawn down to the 10th percentile and up to the 90th. Points below and above the whiskers are drawn as individual dots. Statistical significance of differences was measured using the Mann–Whitney U-test based on adjusted p-values. *: p < 0.01; ***: p < 0.001; ****: p < 0.0001
patients as compared to male controls (adjusted p-value < 0.05, Additional file3: Table S2). Although the small num-ber of females in our dataset (N = 10 out of N = 54 subjects) precluded a clear analysis of the effect of sex, the later re-sults suggest a minimal impact of sex on chemokine levels.
To ascertain the results of univariate statistics, we con-ducted a multivariate analysis using robust Elastic Net penalized regression to evaluate the association between chemokine levels and FXS diagnosis, adjusting for covar-iates possibly impacting the levels of chemokines (age, BMI, time of sampling). As compared to non-robust Elastic Net regression, robust regression presented the advantage of downweighing the effect of extreme values and potential outliers in terms of biomarkers’ concen-trations, which could affect the stability of the analysis (Fig. 1, Additional file 3: Table S2). This analysis re-vealed that the levels of CCL2, CCL3, CCL11, CCL22, CCL26 and CXCL10 were negatively associated with in-creased odds of FXS diagnosis, while the covariates age, BMI and time of sampling were not (Table2). Sex be-ing another possible confoundbe-ing factor and as robust regression currently does not handle categorical variables, we rerun the robust regression analysis on a sample re-stricted to male individuals. We confirmed that 5 chemo-kines CCL2, CCL11, CCL22, CCL26 and CXCL10 remained stably associated with increased odds of FXS diagnosis in the dataset restricted to male subjects, reflecting a minimal impact of sex on these associations (Table 2). However,
CCL4, CCL13 and CCL17 appeared associated with FXS diagnosis only in the dataset restricted to males. This sup-ports the stability of our results for CCL2, CCL11, CCL22, CCL26 and CXCL10 and possible sex differences in the expression of chemokines for CCL3, CCL4, CCL13 and CCL17.
While some chemokines bind to several receptors, some chemokine receptors bind different chemokines [16]. To gain further insight into the immune pathways that could be impacted by chemokine dysregulation, we constructed an interaction map using available databases (see Material & Methods for extensive list of sources). We identified six chemokine receptors, CCR1, CCR2, CCR3, CCR4, CCR5 and CXCR5, whose signalling could be impacted (Additional file 1: Fig. S1A). We then per-formed a pathway over-representation analysis on the list of the nine downregulated chemokines in FXS patients (Additional file 1: Fig. S1B, Additional file 4: Table S3). Biological processes related to chemotaxis of innate and adaptive immune cell types were over-represented: CCL2 and CCL3 for lymphocytes, monocytes, macrophages and neutrophils, CCL3, CCL11 and CCL13 for eosinophils, neutrophils, granulocytes, CCL3 and CXCL10 for T cells, CCL3 and CCL4 for NK cells. Several chemokines were also involved in response to viral infection (CCL4, CCL11, CXCL10), bacterial infection (CCL2, CCL3, CXCL10), as well as to toxic substances insults (CCL3, CCL4).
Clustering analysis
In contrast to univariate methods that assess the differ-ential expression of cytokines at the single feature level, unsupervised clustering methods allows for identifying combinations of variables with the best joint discrimina-tive ability to separate the classes of samples. We there-fore applied unsupervised classification to the dataset encapsulating the levels of the studied biomarkers for each of the 54 individuals included in our study. To par-tition the samples in two clusters, we used the K-sparse algorithm which not only identifies underlying homoge-neous clusters but also selects the combination of bio-markers relevant to discriminate each cluster. We have previously proven the superior efficacy of K-sparse clus-tering towards more classical PCA k-means clusclus-tering [24]. In order to assess the quality of this K-sparse parti-tioning in two clusters, we computed the silhouette value for each patient. Silhouette value measures how similar a patient is to the patients in its own cluster (i.e. the intra-cluster cohesion), compared to patients in other clusters (i.e. the inter-cluster separation). The closest the silhouette coefficient (average of all the silhouette values) ap-proaches 1, the better the intra-cluster consistency is. The mean silhouette coefficient associated to our clustering was equal to 0.892 and most of the individual silhouette values were close to 1 (Fig.2a, Additional file5: Table S4), which
Table 2 Associations between chemokines and FXS diagnosis adjusted for age, BMI and time of sampling
Dataset
Males + Females (N = 54) Males (N = 44) Covariates Age 0 0 Time of sampling 0 −0.04093 BMI 0 −0.15352 Chemokines CCL2 −0.03703 −0.05208 CCL3 −0.01263 0 CCL4 0 0.06623 CCL11 −0.01220 −0.01161 CCL13 0 −0.05315 CCL17 0 −0.00101 CCL22 −0.00060 −0.00743 CCL26 −0.04703 −1.04540 CXCL10 −0.01051 −0.03173
Coefficients were obtained using robust Elastic Net regression with 2000 subsampling steps on the whole dataset (males and females subjects: N = 54, n = 25 FXS patients, n = 29 controls) and in a dataset reduced to male subjects (N = 44, n = 20 FXS patients, n = 24 controls). Coefficients distinct from zero are shaded in grey and convergent associations across the two datasets are bolded
indicated the appropriateness of our clustering and which revealed that the 2 clusters are well distinct in the projected space (Fig. 2b). Since clustering analysis was unsupervised, the model was not a priori informed of the samples class
(i.e. Control or FXS). We therefore compared our clusters labels to these class’ labels (Fig.2b). Among the 29 individ-uals in Cluster 1, 26 were healthy controls and 3 were FXS patients. In contrast, among the 25 individuals in Cluster 2, 22 were FXS patients and 3 were healthy controls. This revealed that our partitioning matches well with the two classes Control and FXS.
The procedure of features selection proposed by K-sparse algorithm allowed for identifying relevant bio-markers that could discriminate the two clusters using the weighted projection matrix W associated to this clus-tering (Additional file 6: Table S5). K-sparse clustering discriminated healthy controls from FXS patients on the basis of the combination of 16 cytokines (Fig. 2c). This combination of biomarkers overlaps with the list of chemokines displaying the largest significant changes (CCL2, CCL3, CCL4, CCL11, CCL17, CCL22, CCL26, CXCL10, Fig. 1) to the exception of CCL13 which was not selected (Fig.1, 2c). It also highlighted that CCL19, CXCL11, IL-12p40, IL-12p70, IL-17A/F, IL-21, INF-γ and SAA have discriminative capacities, although these markers were not differentially expressed between FXS and controls in univariate analysis (Fig.2c).
To identify potential relationships between these 16 bio-markers, we performed correlation analyses in healthy con-trols and FXS patients respectively (Fig.3, Additional file7: Table S6). IL-12p70, IL-17A/F, IL-21 and SAA did not dis-play significant correlations with any of the markers in both controls and patients, to the exception of the IL-17A/F and IL-21 interleukin pair (Fig. 3). Similar correlation patterns were observed in control individuals and in FXS patients for combinations of the chemokines CCL2, CCL3, CCL4, CCL11, CCL17, CCL22 and CXCL10. In contrast, CCL19, CCL26, IL-12p40 and IFN-γ displayed divergent patterns of correlation. Medium to strong positive correlations were ob-served in FXS patients for the combinations of 7 chemo-kines (CCL2, CCL3, CCL4, CCL17, CCL19, CCL22 and CXCL10) and IFN-γ correlated with CCL3, CCL4 and CXCL10. This suggests the presence of coordinated variations in the levels of those biomarkers in FXS patients (Fig. 3).
Discussion
Reduced levels of pro-inflammatory chemokines in FXS patients
Compared to healthy individuals, Ashwood et al. found that FXS patients with ASD exhibited higher plasma levels of IL-1α and IL-12p40 and reduced levels of CCL2, CCL5, CCL11 and CXCL10, but similar levels of 1β, 2, 3, 4, 5, 6, 7, 8, 10, IL-12p70, IL-13, IL-15, GM-CSF, IFN-γ, TNF-α and CCL3 [17]. They also found that FXS patients without ASD ex-hibited higher plasma levels of IL-1α and reduced levels of CCL5 and CXCL10, but similar levels of the other
Fig. 2 K-sparse clustering analysis reveals clear discrimination of FXS patients from healthy controls based on biomarkers levels. a t-Distributed Stochastic Neighbour Embedding (t-SNE) graphical output of K-sparse clustering analysis with 2 clusters. b Performance of the model evaluated using the individual silhouette scores. Each column represents one individual and its individual silhouette value evaluating its parenthood with underlying cluster. c Combination of discriminating features for K-sparse clustering, with their
corresponding norm of weights (norm of their associated row in the W matrix, see Additional file6: Table S5)
biomarkers [17]. While seven interleukins, i.e. IL-1α, IL-1β,
IL-2, IL-4, IL-5 and IL-13 were readily detected in plasma samples by Ashwood et al. using a different immunoassay, these IL were below the lower level of detection in our serum samples. In agreement with this previous study, we found that 6, 7, 8, 10, 12p40, 12p70, IL-15, GM-CSF, IFN-γ and TNF-α were present at similar levels in FXS patients and healthy controls. However, we did not highlight an increase in IL-12p40 in FXS patients and we show a decrease in CCL3. These apparent discrep-ancies could be explained by the type of matrix used (plasma versus serum), the analytical platform used (bead-array versus ECL assay) or differences in the statistical methods used. However, both our study and the one by Ashwood et al. suggest that FXS patients do not exhibit a clear low-grade pro-inflammatory profile that would be characterized by higher levels of multiple pro-inflammatory cytokine and acute phase proteins such as CRP. In agree-ment with this observation in FXS patients, serum levels of the two pro-inflammatory cytokines TNF-α and IFN-γ were reported to be identical in Fmr1-KO mice and their non-transgenic littermates [25].
Chemokines are well known for their ability to induce directed chemotaxis in nearby responsive cells. Here, we
have found that FXS patients exhibit reduced serum levels of CCL2, CCL3, CCL4, CCL11, CCL13, CCL17, CCL22, CCL26 and CXCL10. Furthermore, CCL2, CCL3, CCL11, CCL22, CCL26 and CXCL10 were nega-tively associated with FXS diagnosis in a robust regres-sion model in which we adjusted for age, BMI and time of sampling. Five of these chemokines (CCL2, CCL11, CCL22, CCL26 and CXCL10) were also retained in a dataset reduced to male subjects, strengthening our find-ings for these chemokines. Finally, CCL2, CCL3, CCL11, CCL22, CCL26 and CXCL10 are also selected by our K-sparse clustering as features discriminating the clusters, in combination with 10 additional biomarkers. Import-antly, a previous report highlighted that the plasmatic levels of CCL2, CCL11 and CXCL10 were significantly decreased in a larger sample of male FXS patients [17]. All these data support the fact that dysregulation of at least a subset of specific pro-inflammatory chemokines could contribute to FXS.
The subset of chemokines exhibiting reduced levels in FXS patients indicated possible decreased signalling from six chemokine receptors: CCR1, CCR2, CCR3, CCR4, CCR5 and CXCR3. This could possibly impact the chemotaxis of a number of cell types and pathways
Fig. 3 Correlation analysis of the serum levels of the 16 discriminating cytokines identified by K-sparse clustering in healthy controls and FXS patients. Mirror heatmap representation of correlations. Spearman’s ρ coefficients are color-coded and proportional to dot area. Only significant correlations are displayed (adjusted p-value < 0.05)
ontologically related to“inflammatory response”, includ-ing “response to viral infection”, “response to LPS” or “response to toxic insults”. CXCR3 is expressed primar-ily by activated NK cells and T lymphocytes, and by epi-thelial cells [26]. Th1 cells co-express CXCR3 and CCR5 while Th2 cells express CCR3 and CCR4. CXCR3 li-gands that attract Th1 cells can concomitantly block the migration of Th2 cells in response to CCR3 ligands, thus enhancing the polarization of effector T cell recruitment [26]. Reduced serum levels of CXCL10 might dampen CXCR3 signalling, while decreased levels of CCL3 and CCL5 could reduce CCR3 and CCR4 signalling. This could ultimately cause T cell dysfunction in FXS pa-tients. CCL2 is the most strongly dysregulated chemo-kine in FXS patients as compared to controls. Through signalling via CCR2 and CCR4 receptors, CCL2 mediates chemotaxis of monocytes and dendritic cells, as well as memory T cells to the sites of inflammation upon tissue injury or infection [27,28]. Decreased levels of circulat-ing CCL2 could therefore contribute to reduce the local immune response to infection in FXS patients.
A general health survey on FXS patients highlighted an increased occurrence of ear, throat and nose infec-tions such as sinusitis and otitis in FXS patients [9, 10]. However, anatomical particularities and malformations of the ear conducts and sinuses are likely to explain the specificity of these infections [9], as FXS patients do not appear more sensitive to other types of infections. This would have been expected, if there was a general defect-ive chemokine receptor signalling during infection in FXS patients. Nevertheless, it may be envisioned that re-duced chemokine levels in FXS patients may be associ-ated with a reduced capacity of the immune system of FXS patients to respond to specific pathogens. Of note, one study in the Drosophila melanogaster model of FXS showed that the dfmr1 mutants exhibit increased sensi-tivity to bacterial infection and decreased phagocytosis of bacteria by systemic immune cells [29], suggesting that dfmr1 gene is required for the activation of phago-cytic immune cells and therefore for their immune responsiveness.
Although immune responsiveness to LPS and PHA of PBMC from FXS patients did not differ from those of healthy controls [18], a few studies have been performed in asymptomatic individuals carrying the FMR1 premuta-tion. Notably, an increase in IL-10 secretion by PBMC in the absence of immune challenge was described in FMR1 premutation carriers [30]. Furthermore, a decreased cyto-kine secretion response was observed in LPS-stimulated PBMC from individuals carrying the FMR1 premutation [31]. This suggests that dysregulation in the FMR1 gene could alter immune responsiveness under yet to be de-fined conditions. FMRP, the FMR1 gene product, is an RNA-binding protein and a translational regulator [6].
Although majorly described as a translational repressor, some studies suggest that FMRP can activate the transla-tion of some of its mRNA targets [6]. Further work would be required to determine whether the mRNAs encoding the six dysregulated cytokines are bona fide mRNA targets for translational activation by FMRP or whether their decreased levels indirectly result from compensatory or adaptive mechanisms.
Possible neuro-immune alterations in FXS
Interactions between the nervous and the immune sys-tem are critical not only during early neurodevelopment but also in adolescence and adulthood [32]. As a conse-quence, immune dysfunction may cause changes in brain connectivity associated with neurodevelopmental disor-ders and this has been mostly studied in the context of ASD [33]. Chemokine and their cognate receptors are widely expressed in the developing and adult CNS and disruption of their patterns of expression have been in-volved in CNS disorders, including ASD [34]. Notably, CCL2, CCL3, CCL4, CCL5 and CCL11 are required, via signalling through CCR2, CCR3 and CCR5 receptors, for microglia chemotaxis [35–37]. In addition, CCL2 regu-lates migration of neural stem cells in the brain [38]. Al-though peripheral levels of those chemokines might not reflect their actual levels in the CNS, alterations in CCL2, CCL3, CCL4, CCL5 and CCL11 signalling could participate to the defects in CNS patterning observed in FXS patients. In addition, alterations in chemokine se-cretion or immune response could enhance the sensitiv-ity of FXS patients to neurological damages induced by environmental sources, including infections and xenobi-otics exposure. In line with this, and although chemo-kines were not assessed, one study has shown that cortical astrocytes derived from the brain of FXS mouse model secreted more IL-6 in response to LPS stimula-tion. Furthermore, the authors provide evidence that the abnormal elevation of IL-6 in the cortex of Fmr1-KO mouse could be linked to the synaptic phenotypes [39].
Immune-related biomarkers enable clustering of samples in FXS and control cases
The K-sparse clustering strategy we applied to the bio-markers’ dataset enabled discrimination of FXS samples from control samples relying principally on a combin-ation of 16 immune-related markers. A number of effi-cient methods already exist to perform unsupervised classification of samples based on datasets encapsulating biological features. It is common practice to use PCA k-means to perform clustering analysis. k-k-means does not perform both clustering and feature selection, therefore providing minimal insights into the discriminating fea-tures and therefore into the underlying biology. The K-sparse method we have used alternates k-means with
projection-gradient minimization to promote sparsity and enable features selection, with significant improvements in clustering performances as compared to k-means standard algorithm in terms of clustering performances [24]. By con-sidering the weighted linear combination of the selected features, the clustering computed by K-sparse also pre-sented the advantage of handling extreme values and out-liers which are frequently observed in biomarker datasets. The K-sparse clustering highlighted that 8 of the 9 signifi-cantly dysregulated chemokines contribute to separation between controls and FXS cases. It further identified add-itional immune-related molecules with discriminative abil-ities: CCL19, CXCL11, IL-12p40, IL-12p70, IL-17F, IL-21, INF-γ and SAA. K-sparse highlights the contribution of biomarkers which do not differ in univariate analysis and regression analysis. This can be explained by the fact that K-sparse relies on weighted linear combination of the se-lected features and not on the individual distribution of values among each class. Correlations are observed between a subset of the 16 biomarkers selected by K-sparse, showing that relationships between biomarkers can be of biological relevance. Our study supports that K-sparse clustering can complement classical univariate and regression analyses to identify relevant biomarkers of disease. It paves the way for the use of K-sparse clustering analysis for the identification of combinations of disease biomarkers, but also for the stratification of patients in homogenous subtypes bearing similar biological patterns.
Limitations of the study
Our study has some limitations. First, the sample size is relatively small (n = 25 FXS patients; n = 29 sex and age-matched controls), which may lead to an overestimation of the effect size owing to reduced power, but also limit the generalization of our findings. Second, the methodo-logical choices we have made based on out dataset con-straints, e.g. the use of robust Elastic Net regression instead of classical logistic regression, may limit the inter-pretation of the identified associations. Indeed, coefficients are shrunk and computation of confidence interval and asymptotically valid p-values are not yet available in the robust regression framework. However, among the six chemokines that we have shown here to be negatively as-sociated with FXS, three (CCL2, CCL11, CXCL10) have already been demonstrated to be present at lower levels in an independent cohort of FXS patients (n = 64) compared to healthy controls (n = 19) [17], therefore strengthening the validity of our conclusions. Third, although we have adjusted the associations between specific chemokines and FXS diagnosis for a number of covariates which could impact serum cytokines (age, BMI and time of sampling), we cannot rule out the contribution of additional unmeas-ured covariates. Fourth, we acknowledge that the present study provides limited insight into possible underlying
mechanisms. However, it is noteworthy that almost noth-ing is known on possible immune-related dysfunctions in FXS patients. Exploratory studies are therefore needed to provide the rationale for new studies investigating specific underlying mechanisms.
Conclusions
Our data suggest that immune dysfunction could partici-pate to the physio-pathological processes involved in FXS. The dysregulated immune markers are pro-inflammatory chemokines which are reduced, suggesting that inflamma-tion is not a hallmark of FXS. Further studies are required to decipher the possible role played by immune molecules, and in particular chemokines, in the pathophysiology of FXS and other neurodevelopmental disorders.
Supplementary information
Supplementary information accompanies this paper athttps://doi.org/10. 1186/s12883-020-01715-2.
Additional file 1: Figure S1. Pathways associated with significantly dysregulated chemokines in FXS patients. (A) Interaction map for the subset of chemokines dysregulated in FXS patients and their cognate receptors CCR1, CCR2, CCR4, CCR5 and CXCR10. (B) Selection of GO terms significantly over-represented in the list of dysregulated chemokines pre-sented in Fig.1.
Additional file 2: Table S1. Percentage of detection of biomarkers in FXS patients vs. healthy controls and inclusion of analytes
Additional file 3: Table S2. Comparison analysis of serum biomarkers levels in FXS patients and controls in the whole dataset (N = 54) and in a reduced dataset consisting of male individuals (N = 44). Minimum (Min), first quantile (Q1), median, third quantile (Q3), maximum (Max), mean, standard deviation (SD) are indicated for each group. The r effect size statistic, raw p-values (p-value) and adjusted p-values for the Mann– Whitney U-test, are indicated both for the full dataset (N = 54, n = 25 FXS patients, n = 29 controls) and for the dataset reduced to male individuals (N = 44, n = 20 FXS patients, n = 24 controls).
Additional file 4: Table S3. Over-represented pathways based on the list of significantly downregulated chemokines in FXS patients Additional file 5: Table S4. Silhouette values for each individual in the K-sparse clustering analysis with k = 2 and clustering accuracy based on samples class
Additional file 6: Table S5. W matrix highlighting the respective discriminative weight of each feature in the 4 dimensions of the K-sparse model
Additional file 7: Table S6. Correlations and associated adjusted p-values for each biomarker pair among the 16 features identified by K-sparse clustering in healthy controls and FXS patients. For each biomarker pair, correlations r coefficients and the corresponding adjusted p-values are presented in upper triangle and lower triangle, respectively. Adjusted p-values < 0.05 are highlighted in bold.
Abbreviations
FXS:Fragile X Syndrome; CNS: central nervous system; FMR1: Fragile X Mental Retardation 1 gene; IL: interleukin; LPS: lipopolysaccharides; PBMC: peripheral blood mononuclear cells; ASD: autism spectrum disorder; TNF: Tumor Necrosis Factor; IFN: interferon
Acknowledgements
We acknowledge H. Van Esch for help with patient recruitment and are very grateful to the families and patients who have participated in this study.
Authors’ contributions
AVD, FK and EE recruited patients and controls and performed serum sampling. LD, PBM, OK and EM performed experiments. LD and SB performed statistical analysis. CG performed clustering analysis. LD, OK and NG wrote the manuscript. LD designed the study. All authors read and approved the final manuscript.
Funding
LD thanks the generous support of FRAXA Research Foundation, l’Agence Nationale de la Recherche (ANR JCJC SVE6 MetaboXFra). RFK and AVD have received grants from FRAXA Research Foundation and Jérôme Lejeune Foundation. Funding bodies were not involved in the design of the study and collection, analysis, and interpretation of data and in writing the manuscript.
Availability of data and materials
The datasets used and analysed during the current study as well as the complete code for K-sparse clustering are available from the corresponding author on reasonable request.
Ethics approval and consent to participate
Collection of samples and data from Fragile X patients and healthy controls was approved by the medical ethics committee of the University of Antwerp in Belgium (Agreement #B300201523589). The study was conducted in accordance with statutes and regulations regarding the protection of the right and welfare of human subjects’ participation in biomedical research (World Declaration of Helsinki). Written informed consent was obtained from each participant or his/her legal guardian before research participation. Consent for publication
Not applicable. Competing interests
The authors declare that they have no competing interests. Author details
1
Department of Medical Genetics, University and University Hospital of Antwerp, Edegem, Belgium.2Université Côte d’Azur, CNRS, Institut de
Pharmacologie Moléculaire et Cellulaire, Valbonne, France.3Université Côte d’Azur, CNRS, Laboratoire Informatique Signaux et Systèmes de Sophia Antipolis, Valbonne, France.
Received: 31 July 2019 Accepted: 1 April 2020
References
1. Chelly J, Khelfaoui M, Francis F, Cherif B, Bienvenu T. Genetics and pathophysiology of mental retardation. Eur J Hum Genet. 2006;14(6):701–13. 2. Gecz J, Shoubridge C, Corbett M. The genetic landscape of intellectual
disability arising from chromosome X. Trends Genet. 2009;25(7):308–16. 3. Verkerk AJ, Pieretti M, Sutcliffe JS, Fu YH, Kuhl DP, Pizzuti A, et al.
Identification of a gene (FMR-1) containing a CGG repeat coincident with a breakpoint cluster region exhibiting length variation in fragile X syndrome. Cell. 1991;65(5):905–14.
4. Hunter J, Rivero-Arias O, Angelov A, Kim E, Fotheringham I, Leal J. Epidemiology of fragile X syndrome: a systematic review and meta-analysis. Am J Med Genet A. 2014;164A(7):1648–58.
5. Davidovic L, Tournier B, Khandjian EW. The fragile X syndrome. Encyclopedia of Life Sciences: John Wiley & Sons; 2007.
6. Banerjee A, Ifrim MF, Valdez AN, Raj N, Bassell GJ. Aberrant RNA translation in fragile X syndrome: From FMRP mechanisms to emerging therapeutic strategies. Brain Res. 2018;1693(Pt A):24–36.
7. Hagerman RJ, Berry-Kravis E, Hazlett HC, Bailey DB Jr, Moine H, Kooy RF, et al. Fragile X syndrome. Nat Rev Dis Primers. 2017;3:17065.
8. Kaufmann WE, Kidd SA, Andrews HF, Budimirovic DB, Esler A, Haas-Givler B, et al. Autism Spectrum disorder in fragile X syndrome: Cooccurring conditions and current treatment. Pediatrics. 2017;139(Suppl 3):S194–206. 9. Kidd SA, Lachiewicz A, Barbouth D, Blitz RK, Delahunty C, McBrien D, et al.
Fragile X syndrome: a review of associated medical problems. Pediatrics. 2014;134(5):995–1005.
10. Hagerman RJ, Altshul-Stark D, McBogg P. Recurrent otitis media in the fragile X syndrome. Am J Dis Child. 1987;141(2):184–7.
11. Berry-Kravis E, Levin R, Shah H, Mathur S, Darnell JC, Ouyang B. Cholesterol levels in fragile X syndrome. Am J Med Genet. 2015;167A(2):379–84. 12. Lisik MZ, Gutmajster E, Sieron AL. Low levels of HDL in fragile X syndrome
patients. Lipids. 2016;51(2):189–92.
13. Caku A, Seidah NG, Lortie A, Gagne N, Perron P, Dube J, et al. New insights of altered lipid profile in fragile X syndrome. PLoS One. 2017;12(3):e0174301. 14. Lisik MZ, Gutmajster E, Sieron AL. Plasma levels of Leptin and Adiponectin
in fragile X syndrome. Neuroimmunomodulation. 2016;23(4):239–43. 15. Leboucher A, Pisani DF, Martinez-Gili L, Chilloux J, Bermudez-Martin P, Van
Dijck A, et al. The translational regulator FMRP controls lipid and glucose metabolism in mice and humans. Mol Metab. 2019;21:22–35.
16. Hughes CE, Nibbs RJB. A guide to chemokines and their receptors. FEBS J; 2018. 17. Ashwood P, Nguyen DV, Hessl D, Hagerman RJ, Tassone F. Plasma cytokine
profiles in fragile X subjects: is there a role for cytokines in the pathogenesis? Brain Behav Immun. 2010;24(6):898–902.
18. Careaga M, Noyon T, Basuta K, Van de Water J, Tassone F, Hagerman RJ, et al. Group I metabotropic glutamate receptor mediated dynamic immune dysfunction in children with fragile X syndrome. J Neuroinflammation. 2014;11:110.
19. Pavlou M, Ambler G, Seaman S, De Iorio M, Omar RZ. Review and evaluation of penalised regression methods for risk prediction in low-dimensional data with few events. Stat Med. 2016;35(7):1159–77.
20. Kurnaz FS, Hoffmann I, Filzmoser P. Robust and sparse estimation methods for high-dimensional linear and logistic regression. Chemometr Intell Lab Syst. 2018;172:211–22.
21. Kurnaz FS, Hoffmann I, Filzmoser P. enetLTS: robust and sparse methods for high dimensional linear and logistic regression. R package version 0.1.0 https://CRANR-projectorg/package=enetLTS. 2018.
22. Breuer K, Foroushani AK, Laird MR, Chen C, Sribnaia A, Lo R, et al. InnateDB: systems biology of innate immunity and beyond--recent updates and continuing curation. Nucleic Acids Res. 2013;41(Database issue):D1228–33. 23. Sharman JL, Harding SD, Southan C, Faccenda E, Pawson AJ, Davies JA, et al. Accessing Expert-Curated Pharmacological Data in the IUPHAR/BPS Guide to PHARMACOLOGY. Curr Protoc Bioinformatics. 2018;61(1):1 34 1 1 46. 24. Gilet C, Deprez M, Caillau JB, Barlaud M. Clustering with feature selection
using alternating minimization, Application to computational biology. arXiv. 2017;1711:02974v3.
25. Yuskaitis CJ, Beurel E, Jope RS. Evidence of reactive astrocytes but not peripheral immune system activation in a mouse model of fragile X syndrome. Biochim Biophys Acta. 2010;1802(11):1006–12.
26. Qin S, Rottman JB, Myers P, Kassam N, Weinblatt M, Loetscher M, et al. The chemokine receptors CXCR3 and CCR5 mark subsets of T cells associated with certain inflammatory reactions. J Clin Invest. 1998;101(4):746–54. 27. Fantuzzi L, Borghi P, Ciolli V, Pavlakis G, Belardelli F, Gessani S. Loss of CCR2
expression and functional response to monocyte chemotactic protein (MCP-1) during the differentiation of human monocytes: role of secreted MCP-1 in the regulation of the chemotactic response. Blood. 1999;94(3): 875–83.
28. Andrew DP, Ruffing N, Kim CH, Miao W, Heath H, Li Y, et al. C-C chemokine receptor 4 expression defines a major subset of circulating nonintestinal memory T cells of both Th1 and Th2 potential. J Immunol. 2001;166(1):103–11. 29. O'Connor RM, Stone EF, Wayne CR, Marcinkevicius EV, Ulgherait M, Delventhal
R, et al. A Drosophila model of fragile X syndrome exhibits defects in phagocytosis by innate immune cells. J Cell Biol. 2017;216(3):595–605. 30. Marek D, Papin S, Ellefsen K, Niederhauser J, Isidor N, Ransijn A, et al.
Carriers of the fragile X mental retardation 1 (FMR1) premutation allele present with increased levels of cytokine IL-10. J Neuroinflammation. 2012;9:238.
31. Careaga M, Rose D, Tassone F, Berman RF, Hagerman R, Ashwood P. Immune dysregulation as a cause of autoinflammation in fragile X premutation carriers: link between FMRI CGG repeat number and decreased cytokine responses. PLoS One. 2014;9(4):e94475.
32. Dantzer R. Neuroimmune interactions: from the brain to the immune system and vice versa. Physiol Rev. 2018;98(1):477–504.
33. Meltzer A, Van de Water J. The role of the immune system in autism Spectrum disorder. Neuropsychopharmacology. 2017;42(1):284–98. 34. Stuart MJ, Singhal G, Baune BT. Systematic review of the
neurobiological relevance of chemokines to psychiatric disorders. Front Cell Neurosci. 2015;9:357.
35. Cross AK, Woodroofe MN. Chemokines induce migration and changes in actin polymerization in adult rat brain microglia and a human fetal microglial cell line in vitro. J Neurosci Res. 1999;55(1):17–23.
36. Skuljec J, Sun H, Pul R, Benardais K, Ragancokova D, Moharregh-Khiabani D, et al. CCL5 induces a pro-inflammatory profile in microglia in vitro. Cell Immunol. 2011;270(2):164–71.
37. Selenica ML, Alvarez JA, Nash KR, Lee DC, Cao C, Lin X, et al. Diverse activation of microglia by chemokine (C-C motif) ligand 2 overexpression in brain. J Neuroinflammation. 2013;10:86.
38. Widera D, Holtkamp W, Entschladen F, Niggemann B, Zanker K, Kaltschmidt B, et al. MCP-1 induces migration of adult neural stem cells. Eur J Cell Biol. 2004;83(8):381–7.
39. Krasovska V, Doering LC. Regulation of IL-6 secretion by astrocytes via TLR4 in the fragile X mouse model. Front Mol Neurosci. 2018;11:272.
Publisher’s Note
Springer Nature remains neutral with regard to jurisdictional claims in published maps and institutional affiliations.