Publisher’s version / Version de l'éditeur:
Indoor Environment : The Journal of Indoor Air International, 2, 5-6, pp. 344-349,
1993-09
READ THESE TERMS AND CONDITIONS CAREFULLY BEFORE USING THIS WEBSITE. https://nrc-publications.canada.ca/eng/copyright
Vous avez des questions? Nous pouvons vous aider. Pour communiquer directement avec un auteur, consultez la première page de la revue dans laquelle son article a été publié afin de trouver ses coordonnées. Si vous n’arrivez pas à les repérer, communiquez avec nous à PublicationsArchive-ArchivesPublications@nrc-cnrc.gc.ca.
Questions? Contact the NRC Publications Archive team at
PublicationsArchive-ArchivesPublications@nrc-cnrc.gc.ca. If you wish to email the authors directly, please see the first page of the publication for their contact information.
NRC Publications Archive
Archives des publications du CNRC
This publication could be one of several versions: author’s original, accepted manuscript or the publisher’s version. / La version de cette publication peut être l’une des suivantes : la version prépublication de l’auteur, la version acceptée du manuscrit ou la version de l’éditeur.
Access and use of this website and the material on it are subject to the Terms and Conditions set forth at
The Potential for energy conservation through air tightening of new
Canadian houses
Swinton, M. C.; Reardon, J. T.
https://publications-cnrc.canada.ca/fra/droits
L’accès à ce site Web et l’utilisation de son contenu sont assujettis aux conditions présentées dans le site LISEZ CES CONDITIONS ATTENTIVEMENT AVANT D’UTILISER CE SITE WEB.
NRC Publications Record / Notice d'Archives des publications de CNRC:
https://nrc-publications.canada.ca/eng/view/object/?id=2b6ade12-d432-4cba-8d8a-682b4a894b14 https://publications-cnrc.canada.ca/fra/voir/objet/?id=2b6ade12-d432-4cba-8d8a-682b4a894b14
T he Pot e nt ia l for e ne rgy c onse rva t ion t hrough a ir t ight e ning of ne w
Ca na dia n house s
N R C C - 3 5 1 3 8
S w i n t o n , M . C . ; R e a r d o n , J . T .
S e p t e m b e r 1 9 9 3
A version of this document is published in / Une version de ce document se trouve dans:
Indoor Environment : The Journal of Indoor Air International,
2, (5-6), October
1992
http://www.nrc-cnrc.gc.ca/irc
The material in this document is covered by the provisions of the Copyright Act, by Canadian laws, policies, regulations and international agreements. Such provisions serve to identify the information source and, in specific instances, to prohibit reproduction of materials without written permission. For more information visit http://laws.justice.gc.ca/en/showtdm/cs/C-42
Les renseignements dans ce document sont protégés par la Loi sur le droit d'auteur, par les lois, les politiques et les règlements du Canada et des accords internationaux. Ces dispositions permettent d'identifier la source de l'information et, dans certains cas, d'interdire la copie de documents sans permission écrite. Pour obtenir de plus amples renseignements : http://lois.justice.gc.ca/fr/showtdm/cs/C-42
f
Michael c.lswinton James T f!:Jrdon
Institute for Research in Construction, National Research Council of Canada, Ottawa, Ont., Canada
• • • • • • • • • • • • • • • • • • • • 0 0 0 0 0 0 0 0 0 • • • • • • • • • • • • • • • • • • KeyWords House design Airtightness Ventilation Air leakage Air change Air quality Energy conservation Energy systems analysis Normalized leakage area
Introduction
Potential for Energy
Conservation through Air
Tightening of New Canadian
Houses
.
...
···
.... .
Abstract
The energy savings associated with the air-tightening of new houses equipped with exhaust-only ventilation systems are evaluated in this paper. Potential savings are identified that would result from reducing the leakage area of the envelopes of houses. For most regions of Canada, the air leakage through the envelopes is currently about the same order of magnitude as that needed for air quality. Further tightening would increase the need for supplementary ven-tilation in most houses. The increased cost of venven-tilation using exhaust-only fans would offset potential savings due to reduced air leakage with tighter envelopes. It is recommended that this analysis be repeated to evaluate the role of the tighter envelope as a complement to heat recovery ventilation and demand-control ventilation systems.
tion provisions of the NBC with exhaust-only fans- typi-cally kitchen and bathroom fan combinations.
The National Building Code (NBC) [I] currently re-quires that a 'barrier to air leakage' be incorporated in the envelope of new houses to control interstitial condensa-tion. In the last decade, construction practice has evolved in response to the need for trouble-free envelope design, and, as a result, new houses have been built more airtight [2]. In recognition of this fact, the NBC also requires a mechanical ventilation system capable of producing 0.3 air changes per hour (AC/h), thereby providing a mechan-ical means of achieving minimum levels of indoor air quality. With only a few regional exceptions, builders have been meeting the intent of the mechanical
ventila-Given these developments in NBC requirements and recent trends in house design and construction, how ener-gy-efficient is the current stock with respect to overall air change? As well, are there remaining opportunities for improving the energy efficiency of new houses equipped with exhaust-only systems through more systematic air-tightening of the envelope, without compromising indoor air quality? In this paper, energy budgets associated with various levels of airtightness are examined for 5 locations across Canada, and opportunities for improved energy efficiency are evaluated.
Accepted: March 15, 1993
Michael C. Swinton
Institute for Research in Construction National Research Council of Canada Ottawa, Ont. KIA OR6 (Canada)
© 1993 S. Karger AG, Basel 1016-4901193/0026-0344 $2.75/0
Approach
The key premise of the analysis developed for this study, and the underlying premise for the NBC provisions on mechanical ventilation, is that minimum levels of fresh air can be supplied by exhaust fans at any point in time when the air change rate due to air leakage is inade-quate to sustain air quality. Two scenarios of fan imple-mentation will be discussed.
Given that minimum levels of air quality can be assured by supplementary ventilation, some freedom is introduced in what the appropriate level of airtightness of the envelope should be. A tighter envelope would reduce waste due to uncontrolled ventilation during colder, win-dy periods but would introduce added energy costs due to additional fan operation during milder, calm conditions. As well, fan control systems that perfectly tailor air change to need are not readily available. Some inefficiencies due to greater reliance on poorly controlled fans would have to be expected. Thus, there appears to be a trade-off between the inefficiencies of uncontrolled air leakage and the inef-ficiencies of mechanically induced air change. The follow-ing method was developed to quantify, by way of exam-ples, how these trade-offs balance out for various levels of envelope airtightness.
A method developed at the National Research Council of Canada [3, 4] for predicting the total hourly air change of a house was implemented in a sensitivity analysis. The method uses the air leakage characteristics of the house and weather parameters to determine the air change rate for each hour of the year. The method also predicts the total air change of the house when fans are operated. This technique was implemented in a computer program to evaluate what the total air change rates with and without ventilation would be over a 7-month heating season. As well, the fan operating times and electricity requirements were accounted for.
Methods
Parameters
An average-sized reference house was defined for this study.
Based on a survey of characteristics of 194 houses built in 1989 [5], a
house with a volume of 656m3 and an envelope surface area of
500m2 was specified. Seven values of normalized leakage area
(NLA) [defined in 6] were investigated. These varied between 0.9
and 2.7 cm2fm2 in increments of0.3.
The performance evaluations were made for 5 cities: Halifax, Montreal, Toronto, Winnipeg and Vancouver. Electric heating was assumed for Halifax and Montreal, and gas heating was assumed for Toronto, Winnipeg and Vancouver.
Two exhaust fans were specified: a kitchen exhaust fan and a bathroom exhaust fan. Each fan was assigned an installed fan
capaci-ty of 30 lis to meet the 55 lis required to produce 0.3 AC/h for the
reference house.
Scenarios
The key unknown is the control of exhaust fans. The NBC does not call for sophisticated fan controls, and, usually, none are installed. In the absence of a typical control strategy, two scenarios were investigated for the deployment of the exhaust fans.
Case 1. It was assumed thai this house is occupied by 3 people 24 h per day, each needing l5l/soffresh air. for a total of 451/s. This
represents about 0.25 AC/h in the reference house. When the model predicts a shortfall in air change for a given hour, the first fan is turned on. If a shortfall still exists, the second fan is turned on over the hour. A minimum operating time of I his assumed once the fans are turned on.
Case 2. Case 2 is similar to case 1, with the exception that 2 occu-pants are assumed to be out of the house for 9 h during the day. Thus, during daytime hours, only 15 Us is assumed to be required to meet the air quality needs of the occupant. This would result in an air change rate of just under 0.2 AC/h, averaged over a 24-hour period. The same control strategy as case l is assumed.
The above two cases are the first of many examples that could be investigated. Other occupancies, such as a family of 4 with no one home during daytime hours, and other ventilation strategies incorpo-rating demand-control ventilation or heat recovery ventilators have been left for future investigation.
Other Assumptions
The house is assumed to be in a suburban setting, with sheltered surroundings. The fan motors are assumed to require 1.6 W of elec-tricity to exhaust each liter per second of air from the house. No heat recovery is assumed to occur with infiltration, i.e., the dynamic insu-lation effect is neglected in the energy analysis.
Analysis and Results
Frequency a/Occurrence of Air Change Rates
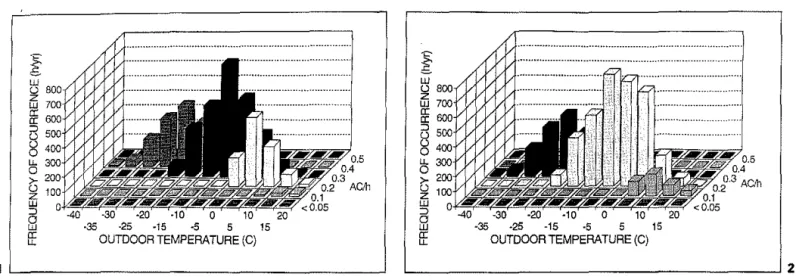
For each city and each envelope airtightness level, the air change rate was evaluated for each hour without the effect of mechanical ventilation. Figures I and 2 show example frequency distributions of these rates as a func-tion of outdoor temperature, for NLAs of 2.1 and 1.5 respectively, for the reference house in Winnipeg. It can be seen from figure I that the house with an NLA of 2.1 has a natural air change rate of 0.3 AC/h for the largest number of hours. At milder temperatures, when the driv-ing pressures are smaller, the natural air change rates were lower (0.2 AC!h).
Figure 2 shows a similar set of histograms of air change rates for a tighter envelope having an NLA of 1.5. Here, the majority of hours have air change rates below the 0.25 AC/h required in case I. Supplemental ventilation is
·35 ·25 -15 -5 5 15 -35 -25 -15 ·5 5 15
OUTDOOR TEMPERATURE (C) OUTDOOR TEMPERATURE (C)
1L---'
lMMMMMMMMMMMMMMMMMMMMMMMMMMMMMMMセR@fig. 1, 2. Distribution of air change rates in Winnipeg as a function of outdoor temperature. 1 NLA = 2.1 (average
tightness). 2 NLA = 1.5 (tighter house).
セ@
<sJ.+··· ...
= ..
セ@ セ@""""""]
5 @ ッッNjNセ@ ... , a:セゥ@
UJill
I•
AIR LEAKAGE 1!111 FAN OPERATION 0 VENTILATION3 ' - - - '
セ@
;;_w ...
:= ..
ffi
ool+·"""·:==: ..zzjャBOセ\ᄋセセQ@
..セ@
セ@ セセQBBBGQ@ a:セ@
UJ z UJ 0.9 1.2 1.5 1.8 2.1 2.4 2.7 NLA (cm2/m2 )I•
AIR LEAKAGE - FAN OPERATION 0 VENTILATIONGMMMMMMMMMMMMMMMMMMMMセT@
Fig. 3,4. Seasonal energy use attributed to air change as a function of NLA (Winnipeg) in case l (3), with a
daytime occupancy of 3 persons, and case 2 (4) with l person.
required more often, even for colder temperatures. Nev-ertheless, the bands of excessive air change are almost eliminated.
Energy Impact
For each hour, supplemental ventilation requirements are determined and the impact of mechanical ventilation on the overall air change rate is estimated using a model developed by Shaw (4]. The difference between the air change rate with fans and that without fans is attributed to the operation of fans. The resulting amount is usually less than the total flow through the fans, because fan
oper-346 Swinton/Reardon
ation affects the pattern of pressure differences across the envelope. In fact, because ofthese interactions, it was found that a single 30 1/s fan was rarely sufficient to in-crease the air change rate up to the desired amount, once the air leakage had fallen below that amount. The inter-action between fan exhaust, infiltration and exfiltration contributes to the inefficiency of the ventilation system.
The energy requirements were evaluated for each hour and summed over the heating season for the following three components: air leakage without fans, additional air flow with the fans, and the fan power. Examples of this evaluation are shown for Winnipeg in figures 3 and 4, for
Energy Conservation through Envelope Airtightness
120
:s
100 ., ... WINNIPEGz
セ@ 80-"-セ@
60 (f) (!) 40z
Mセ@
(f) VANCOUVER 1.5 2 2.5 3 3.5 4 4.5 5 NLA (cm2/m2)Fig. 5. Predicted savings associated with air-tightening the refer-ence houses in each location, case 1.
cases 1 and 2, respectively. The effect of air leakage (dark portion of the bar) decreases linearly with decreasing NLA. The fans' requirements for electricity increase as the house gets tighter, but this component is relatively small even for the lowest NLA, for which the fans operate continuously. The ventilation component increases dra-matically for NLAs ofless than 2.1. In fact, since the two fans are of a size to meet the NBC, and I fan alone is barely capable of increasing air change rates to the desired level, the greater use of fans with lower NLAs entails an energy penalty due to overventilation, as shown for case I in figure 3.
For case I, an ideal system which could provide exactly 45 Vs continuously would consume 28 GJ over the heat-ing season in Winnipeg. The NLA with the best energy performance shown in figure 3 (NLA = 1.8) has a seasonal total air leakage component that is just above the energy consumption of an ideal system. This NLA features a small inefficiency due to excessive air leakage during cold and windy periods and a small ventilation inefficiency during mild and calm periods: other NLAs feature higher inefficiencies.
Figure 4 shows the seasonal energy requirements for the same range of NLAs in Winnipeg, for case 2. The air leakage components without fans are the same as with case I; however, ventilation requirements are reduced because air leakage alone can satisfy the daytime require-ment of 15 Vs much of the time for envelopes having NLAs of 1.5 or more. Again, the inefficiency associated with the assumed control strategy results in diminished returns at an NLA ofless than 1.5.
12 10
"'
wg
a セ@ 6 a: ill"'
4 :::> z 2-0I•
WINNIPEG -VANCOUVERFig. 6. Distribution of the occurrence of NLAs for houses sur-veyed in Winnipeg and Vancouver.
Energy Costs and Savings
The annual energy requirements such as the ones shown for Winnipeg in figures 3 and 4 were evaluated for the other cities. The functional relationships between total energy and NLA followed similar patterns to those shown for Winnipeg.
The total energy requirement for each NLA and each location were costed using energy rates applicable in 1990 [Energy Mines and Resources Canada, unpubl. data]. The slopes ofthe total energy cost curve were calculated, yield-ing the energy cost savyield-ing as a function ofNLA, as shown
in figure 5 for case 1. Case 2 (not shown) differs from case I only with slightly higher savings at the lower end of each curve, where mechanical ventilation and the control strat-egy play more important roles.
Differences in climate and energy cost explain the regional variations shown in figure 5. The Vancouver results stand out as exceptionally low savings, and at much higher NLAs, which is due to the relatively mild and calm climate and low gas prices. Winnipeg, being both cold and windy in winter, shows the highest savings associated with envelope tightening.
The savings potentials indicated in figure 5 apply to the reference house in each location. To estimate the potential savings that might be associated with building new houses to tighter levels, the results of a survey of the airtightness of recently built houses were used [5]. The NLAs of approximately 20 houses were established for each of the cities studied. Almost 40 houses were surveyed in Toronto. The distributions of NLAs are shown in fig-ure 6 for Winnipeg and Vancouver. The NLAs of houses
Table 1. Savings potential identified in Location the analysis Halifax Montreal Toronto Winnipeg Vancouver
surveyed in Vancouver were more than twice those in Winnipeg on average.
More importantly, the distribution ofNLAs shown in figure 6 only overlaps the savings curve shown in figure 5 by a narrow range for NLAs of about 2. The large savings associated with tightening iu Winnipeg have already been realized. Considerable overlap was found between the albeit modest savings curve shown in figure 5 and the dis-tribution of NLAs in figure 6 for Vancouver.
A 'threshold NLA' was established for each location. This was defined as the NLA below which further tighten-ing would result in negligible savtighten-ings or even a loss. The overall savings potential was estimated by finding the dif-ference between the measured NLA and the threshold NLA. The difference was multiplied by the appropriate savings per unit reduction in NLA. The results are sum-marized in table 1, which shows the threshold NLA and the percent of houses surveyed with an NLA higher than the threshold. For the loosest houses with NLAs higher than the threshold, the savings potential was estimated using the calculated savings curves, proportioned accord-ing to the volumes of the houses in the survey.
Finally, a present worth factor of 18 was applied to the energy savings to obtain the present worth of energy sav-ings as shown in the table. A present worth factor of 18 was used in the development of the Measures for Energy Conservation in New Buildings 1983 [7]. The present worth of savings is an indication of how much money could be spent air-tightening the house to break even with the savings, assuming a 2.9% discount rate for a 25-year investment.
In Halifax and Montreal, the overlap between savings potential and occurrence of NLA is so small that the pre-dicted savings are insignificant for both cases. In Toronto and Winnipeg, the overlap is greater; however, only the second scenario of ventilation requirements (case 2) re-sults in significant savings. In Vancouver, more than 50%
348 Swinton/Reardon
Threshold Houses Case 1, per house Case 2, per house
NLA, tightened
cm2/m2 % annual present annual present
savings worth savings worth
2.1 no overlap - no overlap
-2.1 5 no overlap
-
$7 $1262.1 33 $5 $90 $12 $216
1.5 21 $1 $18 $18 $324
2.7 55 $22 $396 $27 $486
of the houses in the survey could be tightened to a moder-ate level of airtightness, i.e., an NLA of 2.7, which would result in reasonably high savings- up to $60 per year for the loosest houses, and averaging $22 and $27 per year for cases 1 and 2. These levels of savings could be enough to justify expenditures of $400 or more to tighten each house.
Conclusions
(1) Although air change rates vary considerably over the year, the model predicts that they tend to occur in a relatively narrow distribution about the mean. With de-creasing envelope leakage area, the air change rate falls below what is needed to assure good air quality over a long time period. Supplemental ventilation is needed for a greater proportion of the time.
(2) With the exception of Vancouver, most of the sur-veyed houses appear to have NLAs close to or tighter than the threshold NLAs identified in this study. If the as-sumptions and survey data used in this study were found to be representative of current practice, it could be con-cluded that there is little incentive for builders using exhaust-only ventilation strategies to improve currently successful air-tightening techniques for the sake of energy efficiency. For new houses equipped with exhaust-only ventilation systems, further tightening below identified thresholds could entail more energy waste or worsen air quality if corrective action is not taken during periods of low air change.
(3) There appears to be considerable room for addi-tional air-tightening in Vancouver, in spite ofthe fact that the savings per unit change in NLA are relatively small and the identified NLA threshold is high. Many of the surveyed Vancouver houses had very high NLAs.
Energy Conservation through Envelope Airtightness
I
I
(4) Electricity requirements to power fans do not appear to be a major component of the overall energy requirement for air change, even when there is greater reliance on mechanical ventilation.
Acknowledgments
This work was funded in part by the Provincial Ministries of Energy, Energy Mines and Resources Canada, and the Institute for Research in Construction, National Research Council of Canada. The authors gratefully acknowledge Dan Sander and Dr. C.Y. Shaw for their guidance and constructive discussion, and 」ッセッー@ student
Siku Adam's efforts in setting up and executing portions of the
sensi-tivity analyses.
(5) The role of the tighter envelope as a complement to other ventilation strategies, e.g. heat recovery ventilation and demand-control ventilation, should be evaluated with the methodology described in this paper.
...
References··· ···
... .
National Building Code of Canada. Ottawa, National Research Council Canada, 1990. 2 Hamlin T, Forman J, Lubun M: Ventilation
and Airtightness in New Detached Canadian Housing. Ottawa, Canada Mortgage and Hous--ing Corporation, May 1990.
3 Reardon JT: Air Infiltration Modelling Study. Contract report No. CR5446.3, prepared for Energy Mines and Resources Canada. Ottawa,
May 1989.
4 Shaw CY: Methods for estimating air change rates and sizing mechanical ventilation systems for houses. ASHRAE Trans 1987;93(part 2):
2284-2302.
5 Consolidated Report on the 1989 Survey of Airtightness of New Merchant Built Houses. Draft contract report by Scanada Consultants Limited for Energy Mines and Resources c。ョセ@
ada. Ottawa, Aprill992.
6 Canadian General Standards Board: Detenni· nation of the Airtightness of Building Enve· lopes by the Fan Depressurization Method. Ot· tawa, National Standard of Canada CAN/
CGSB-149.10-86. Dec 1986.
7 National Research Council of Canada, Com· mittee on the National Building Code: m・。セ@
sures for Energy Conservation in New bオゥャ、セ@
ings 1983. Ottawa, NRCC No. 22432.