READ THESE TERMS AND CONDITIONS CAREFULLY BEFORE USING THIS WEBSITE. https://nrc-publications.canada.ca/eng/copyright
Vous avez des questions? Nous pouvons vous aider. Pour communiquer directement avec un auteur, consultez la première page de la revue dans laquelle son article a été publié afin de trouver ses coordonnées. Si vous n’arrivez pas à les repérer, communiquez avec nous à PublicationsArchive-ArchivesPublications@nrc-cnrc.gc.ca.
Questions? Contact the NRC Publications Archive team at
PublicationsArchive-ArchivesPublications@nrc-cnrc.gc.ca. If you wish to email the authors directly, please see the first page of the publication for their contact information.
NRC Publications Archive
Archives des publications du CNRC
This publication could be one of several versions: author’s original, accepted manuscript or the publisher’s version. / La version de cette publication peut être l’une des suivantes : la version prépublication de l’auteur, la version acceptée du manuscrit ou la version de l’éditeur.
Access and use of this website and the material on it are subject to the Terms and Conditions set forth at
Remote monitoring of a rehabilitated concrete highway bridge - 5 years
of results
Cusson, D.; Qian, S. Y.; Glazer, R.; Hoogeveen, T. J.
https://publications-cnrc.canada.ca/fra/droits
L’accès à ce site Web et l’utilisation de son contenu sont assujettis aux conditions présentées dans le site LISEZ CES CONDITIONS ATTENTIVEMENT AVANT D’UTILISER CE SITE WEB.
NRC Publications Record / Notice d'Archives des publications de CNRC:
https://nrc-publications.canada.ca/eng/view/object/?id=500ab57c-b6c0-4889-aa72-b3fb547b79de https://publications-cnrc.canada.ca/fra/voir/objet/?id=500ab57c-b6c0-4889-aa72-b3fb547b79de
Remote monitoring of a rehabilitated concrete
highway bridge - 5 years of results
Cusson, D.; Qian, S.; Glazer, R.; Hoogeveen, T.
A version of this document is published in / Une version de ce document se trouve dans : 2nd Material Specialty Conference of the Canadian Society for Civil Engineering,
Montréal, Québec, June 5-8, 2002, pp. 1-10
www.nrc.ca/irc/ircpubs
REMOTE MONITORING OF A REHABILITATED CONCRETE HIGHWAY
BRIDGE – 5 YEARS OF RESULTS
D. Cusson, S. Qian, R. Glazer, T. Hoogeveen
Institute for Research in Construction, National Research Council, Canada
ABSTRACT: As part of a major rehabilitation project, embedded instrumentation was installed in a
concrete bridge barrier wall to remotely monitor the key physico-chemical parameters influenced by the prevailing environmental conditions. The remote monitoring was part of a broader experimental program, in which different rehabilitation techniques used in the reconstruction of a bridge barrier wall were evaluated in the field and in the laboratory. The barrier wall was instrumented in 1996 with over a hundred embedded sensors for the measurement of temperature, relative humidity, electrochemical potential and longitudinal strain. The data was collected on an hourly basis with 5 data loggers equipped with cellular modems for data transmission. The bridge structure located near Montreal (Quebec) has experienced typical Canadian temperature extremes from -25°C in the winter to +30°C in the summer, several wet-dry and freeze-thaw cycles, as well as severe restrained shrinkage cracking in the new barrier wall at early-age. The paper presents data obtained from five years of remote monitoring of a bridge under harsh climatic conditions. The full evaluation of the long-term performance of the rehabilitation techniques based on corrosion surveys and testing conducted on-site and in the laboratory will be part of a separate paper.
1. INTRODUCTION
1.1 Overview of the rehabilitation project
Although many corrosion inhibiting systems are currently available on the market, there are many debates about their effectiveness under field conditions. A partnership was formed to evaluate the long-term performance of several proprietary corrosion-inhibiting systems under field conditions. The partnership included seven product manufacturers, two bridge owners and NRC. The test site selected for the study was a concrete barrier wall at the Vachon Bridge, which is a 21-span highway bridge near Montreal, Quebec. During the summer of 1996, ten 35-m long spans of the bridge barrier wall were reconstructed using standard medium-strength concrete including nine different corrosion inhibiting systems. One control span was similarly constructed with the same concrete and carbon steel reinforcement. The test spans included corrosion inhibiting admixtures, reinforcement coatings and/or concrete coatings/sealers. Periodic non-destructive field corrosion surveys and laboratory experiments were conducted over five years. In order to provide data to assist in the evaluation of the corrosion inhibiting systems in the field, the concrete barrier wall was also instrumented with over a hundred sensors embedded in the concrete for the measurement of temperature, relative humidity, electrochemical potential and longitudinal strain. The data was collected on an hourly basis using 5 data loggers equipped with cellular modems for data transmission. A description of the test sites, the concrete mixture design, the corrosion inhibiting systems, and the instrumentation and monitoring equipment used is given in Cusson and Mailvaganam (1999).
2e Conférence spécialisée en génie des matériaux
de la Société canadienne de génie civil
2nd Material Specialty Conference of the Canadian Society for Civil Engineering
Montréal, Québec, Canada 5-8 juin 2002 / June 5-8, 2002
1.2 Objective and scope of the paper
The objective of the paper is to present the results and findings obtained from five years of remote monitoring of a reconstructed bridge barrier wall subjected to harsh climatic conditions. Furthermore, techniques used for the calibration of the sensors and correction methods applied for the interpretation of the raw data will be discussed. The complete results of the broader experimental program on the performance evaluation of the different rehabilitation techniques will be published in a separate paper. Due to a confidentiality agreement with the product manufacturers participating in this study, no commercial names will be disclosed in the paper. Labels given arbitrarily and generic descriptions for the different rehabilitation techniques will be used thought out the paper.
2. RESULTS FROM THE REMOTE MONITORING
The use of embedded instrumentation in such a study serves two purposes: (i) to record the history of the exposure conditions to which the test sites were subjected during the study, and (ii) to assist in the evaluation of the field performance of the different rehabilitation techniques. In the following, selected data sets will be presented and major findings related to the remote monitoring component of the study will be discussed.
It is well known that reinforcement corrosion and the associated electrochemical reactions in concrete are significantly affected by the temperature and the moisture content of concrete. The half-cell potential of the reinforcement is directly related to the corrosion reactions in concrete. Monitoring these parameters is therefore important for the study of the long-term field performance of rehabilitation techniques, such as those using corrosion inhibitors.
2.1 Temperature data
Temperature influences all processes involved in corrosion. Shiessl and Raupach (1990) found that a two-fold higher corrosion rate could be reached by only a 10°C increase in temperature. Furthermore, it will be shown in the paper that seasonal variations of temperature have a strong effect on all field variables measured in this study, namely the relative humidity in concrete, the electrochemical potential of the reinforcement and the concrete strain.
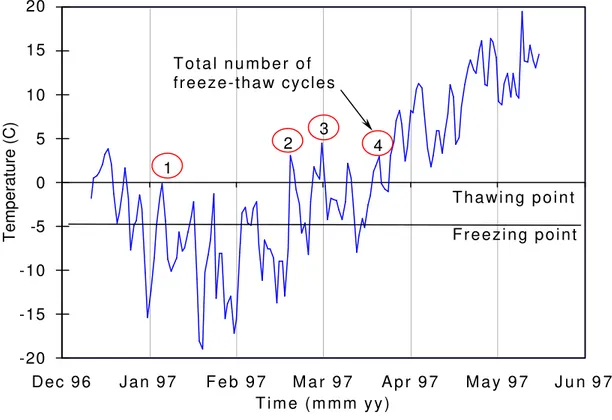
Figure 1 presents the temperature of the ambient air and the concrete temperature in Span 12 (plain concrete, epoxy-coated reinforcement) measured from May 1997 to December 2001. Typically, the ambient temperature measured at the bridge varied from –25°C in January to +30°C in August. The temperature in the concrete of Span 12 varied from –15°C in January to +40°C in August, and was found to be identical to the concrete temperature measured in all other test spans. This indicates that the presence or type of corrosion inhibitors had no effect on the thermal properties of concrete. Another observation was that the concrete temperature in the barrier wall was about 10°C warmer than the ambient temperature at any given time of the year, day or night. This was mainly due to two factors contributing towards increasing temperature in concrete: solar radiation and heat capacity of concrete. The temperature curves were analysed further to estimate the number of freeze-thaw cycles that the concrete was subjected to during the winter season. Neville (1996) indicated that normal concrete freezes at about -5°C due to impurities in water and the capillary pressure in concrete. Concrete will thaw at 0°C, provided that this temperature is maintained or exceeded long enough (few hours) to thaw concrete completely. Figure 2 illustrates the procedure used to calculate the number of freeze-thaw cycles. For instance, during the winter of 1997, 4 cycles were found to occur in Span 21. Over the 5-year duration of the study, 23 freeze-thaw cycles were estimated, with an average of 5 freeze-thaw cycles during a typical winter.
Figure 1: Temperature measured in Span 12 and in ambient air
Figure 2: Temperature and freeze-thaw cycles measured in Span 21 during the winter of 1997
-25 -20 -15 -10 -5 0 5 10 15 20 25 30 35 40
1 Jan 97 1 Jan 98 1 Jan 99 1 Jan 00 1 Jan 01 1 Jan 02
T i m e ( d m m m y y ) Temperature (C) Ambient air Span 12
-20
-15
-10
-5
0
5
10
15
20
D e c 9 6
J a n 9 7
F e b 9 7
M a r 9 7
A p r 9 7
M a y 9 7
J u n 9 7
T i m e ( m m m y y )
Temperature (C)
1
2
3
4
T o t a l n u m b e r o f
f r e e z e - t h a w c y c l e s
F r e e z i n g p o i n t
T h a w i n g p o i n t
2.2 Relative humidity data
The moisture level in concrete influences reinforcement corrosion, since it may affect the rate of both carbonation and chloride penetration as well as electrical resistivity and availability of oxygen (Pruckner and Gjorv, 2001). For the assessment of the moisture condition in concrete structures, measurements of relative humidity (RH) are often taken as an indirect method. Measured RH, however, should not be directly used for characterisation of the moisture content in concrete. Daily and seasonal temperature cycles strongly affect measured RH values. A procedure developed by Pruckner and Gjorv (2001) was therefore used to correct the RH data for the purpose of removing the influence of temperature as follows:
[1]
−
⋅
−
⋅
=
T
BT
A
RH
AT
RH
RH
T T K1
298
1
)
(
100
ln
exp
298λ
where RH298K (in %) is the corrected RH normalised to a temperature of 298K (25°C); RHT (in %) is the
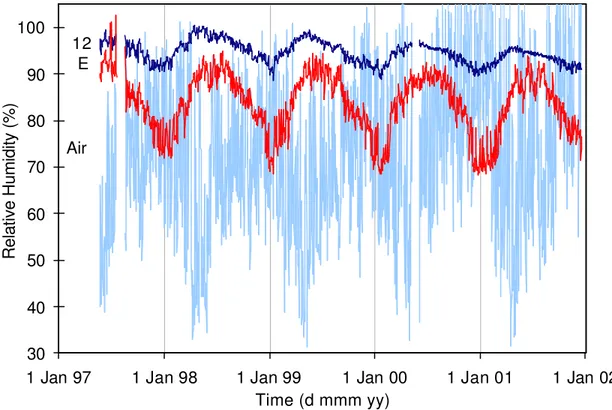
RH measured in concrete at a given temperature; T (in Kelvin) is the actual concrete temperature; parameters A (0.11784 N/m) and B (0.000154 N/m/K) are constants that define the surface tension of the pore water as a function of concrete temperature; and λ (0.93) is an empirical constant calibrated on the RH and temperature data measured at the bridge. Equation 1 was not used to correct the ambient air RH. Figure 3 illustrates the ambient relative humidity measured at the bridge from May 1997 to December 2001 and, for the same period of time, the corrected RH in the concrete of Span 12 (plain concrete, epoxy-coated reinforcement) and Span E (concrete with corrosion inhibiting admixture, plain reinforcement). The ambient relative humidity varied from 30% to 100% with the lower RH values occurring typically at the end of winter in April-May. Some values of RH exceeded 100% by about 5%, which is within the precision of the sensor for that high level of RH.
In general, the concrete RH followed a seasonal pattern with high RH values in May-June and low RH values in December-January, which was not in phase with the RH of the ambient air. The concrete RH is also seen to decrease over the years, as expected, from high RH values when the concrete was young and wet, to lower RH values 5 years later, as a result of drying and further hydration of cement.
The RH in concrete is also found to differ from span to span. For instance, the RH in Span E reached values as low as 70% during the winter 2001, while the RH in Span 12only went down to 90% during the same period. However, in the following summer, the concrete RH in the 2 spans went up to above 90%. Assessing the performance of concrete based on its rate of drying depends on the application for which the concrete was made. With regard to corrosion, it is usually accepted that reinforcement corrosion does not occur in concrete if the RH is kept under 70%. On the other hand, fully saturated concrete (100% RH) can also prevent initiation of corrosion because the oxygen level in the concrete pores is too low to initiate corrosion. Concrete with partially saturated pores where the RH is in the range of 75-95% is most vulnerable to corrosion formation on the reinforcement, since all required elements for its initiation are present in sufficient quantities (oxygen, water and steel). In this study, all concrete spans had concrete RH values in the critical range for long periods of time.
With regard to shrinkage cracking, the smaller the change in volume the better, especially in concrete structures where movement is severely restricted. Span 12 seems to have performed the best in that regard due to its apparently lower rate of wetting and drying. However, the different rates of wetting and drying may not be solely due to the type of rehabilitation techniques used. Other factors may have contributed such as the variation in quality of the base concrete from one pour to the next, and perhaps the distance between a given RH sensor and the nearest microcracks.
Figure 3: Relative humidity measured in Spans 12 and E, and in ambient air
2.3 Electrochemical potential data
In order to monitor the effectiveness of the different corrosion inhibiting systems over time, manganese dioxide reference electrodes and low-cost graphite reference electrodes were installed at the centre of all test spans to monitor the electrochemical potential of the reinforcement. It was found shortly after installation, however, that the graphite reference electrodes could not be relied upon due to unacceptable instability. The readings measured by the graphite electrodes were therefore ignored.
The stability of the manganese reference electrodes was verified on a yearly basis by taking several half-cell potential measurements with a calibrated standard reference electrode placed on the surface of the barrier wall near the location of each embedded manganese reference electrode. It was found that their reference potential shifted gradually over the years. The reference potential of MnO2 electrodes is known
to be stable in a constant environment. When the electrodes were embedded in concrete, however, the change in the environmental conditions caused their electrochemical potential to reach a new equilibrium with the surrounding concrete. As a result, the potential of MnO2 electrodes has been gradually shifting to
a new value.
2.3.1 Calibration procedure
Half-cell potential readings were taken annually in May-June at the surface of the barrier wall with a standard external reference electrode (Cu/CuSO4). The readings were used to correct the data measured
internally by the MnO2 electrodes. For each test span, a regression analysis was conducted on the
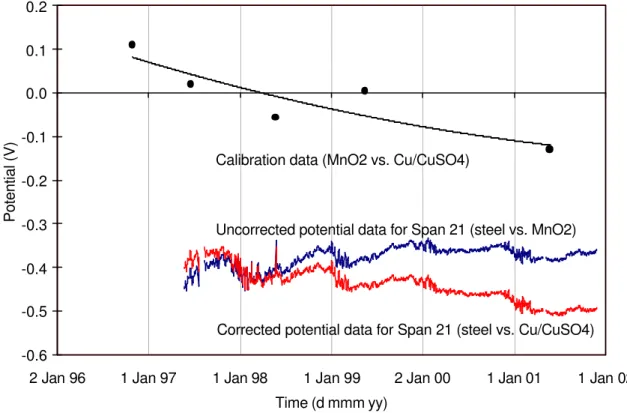
measured calibration data to fit a non-linear equation as a function of time. Figure 4 illustrates how the internal electrode data was corrected for Span 21 (plain concrete, plain reinforcement). The corrected half-cell potential data was obtained by subtracting the calibration data specific for Span 21 from the uncorrected readings measured by the MnO2 reference electrode in Span 21. One can see the change in
the overall slope from positive before correction to negative after correction, which is normally expected.
30
40
50
60
70
80
90
100
1 Jan 97
1 Jan 98
1 Jan 99
1 Jan 00
1 Jan 01
1 Jan 02
Time (d mmm yy)
Relative Humidity (%)
Air
12
E
Figure 4: Calibration procedure used to correct the electrochemical potential measured in Span 21
Figure 5: Corrected electrochemical potential measured in Spans 12, 21, A and F
-0.6 -0.5 -0.4 -0.3 -0.2 -0.1 0.0 0.1 0.2
2 Jan 96 1 Jan 97 1 Jan 98 1 Jan 99 2 Jan 00 1 Jan 01 1 Jan 02
Time (d mmm yy)
Potential (V)
Uncorrected potential data for Span 21 (steel vs. MnO2)
Corrected potential data for Span 21 (steel vs. Cu/CuSO4) Calibration data (MnO2 vs. Cu/CuSO4)
-0.55 -0.50 -0.45 -0.40 -0.35 -0.30 -0.25 -0.20 -0.15
1 Jan 97 1 Jan 98 1 Jan 99 1 Jan 00 1 Jan 01 1 Jan 02
Time (d mmm yy)
Potential vs. Cu/CuSO4 reference (V)
Span 12 Span A
Span F Span 21
2.3.2 Test data
Figure 5 presents the corrected half-cell potential data measured from May 1997 to June 2001 in 4 test spans. They are for Span 12 (plain concrete, epoxy-coated reinforcement), Span F (concrete with corrosion inhibiting admixture, plain reinforcement), Span A (plain concrete, cement-based coating on reinforcement), and Span 21 (plain concrete, plain reinforcement). All curves show a seasonal variation of the potential with the least negative values occurring during the cold winter months (November–February) and the most negative values of potential occurring in warmer weather. The half-cell potential curves for Spans 12 and A stand above those of Spans F and 21. The apparent difference in potential of Spans 12 and A from the potential of control Span 21 is due to the high electrical resistance induced by the presence of the coating on the reinforcement. In this case, the input impedance of the data acquisition system of 107 Ohms was not high enough. The current flow, which had to go through the highly resistive path between the reinforcement and the MnO2 reference electrode, caused a potential drop resulting in a
shift of the half-cell potential towards less negative values. These observations were validated by the potential readings taken during the annual corrosion surveys. It is therefore also important in the interpretation to consider the relative changes in half-cell potential over time. In this regard, the curve of Span A shows the smallest overall decrease in potential over the years.
2.4 Longitudinal strain data
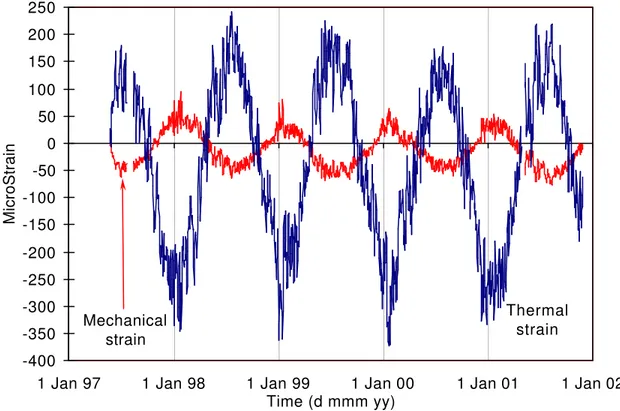
Strain gauges were embedded in the barrier wall since restrained shrinkage was anticipated, and the resulting cracking may be a cause of premature corrosion of the reinforcement. Furthermore, the rate of cement hydration and the development of some physico-mechanical properties of concrete (thermal expansion, modulus of elasticity, strength, etc.) may be affected by the use of admixtures in concrete. Figure 6 shows the measured mechanical strain along with the calculated thermal strain in the longitudinal direction of the barrier wall in the centre section of Span 21 (plain concrete, plain reinforcement). Strain measurements in the other test sections were found to follow similar patterns and be of the same range. The mechanical strain was measured directly by the embedded strain gauges, which were fully compensated against temperature and bending effects. The thermal strain was calculated based on the temperature history measured in the concrete.
The mechanical strain varied from approximately –50 to +50 microstrains over time, showing a pattern that appears to be 180° out-of-phase with the variation in concrete RH. A crack survey conducted on Span 21 revealed the presence of a crack in the concrete barrier wall at the location of the strain gauge, which in fact was monitoring the opening and closing of the crack as a function of the change in concrete RH. For instance, when concrete dried, the resulting shrinkage increased the crack opening, and when concrete swelled the opposite effect took place.
The thermal strain varied from approximately -350 µε to +250 µε. One can observe that the mechanical strain was relatively small compared to thermal strain. This is especially true when initial strains are not considered or measured. This was the case in this study because the remote monitoring system became fully operative only in May 1997, which was about half a year after construction. As a result, it was therefore not possible to measure the initial shrinkage strain. However, a detailed analysis was conducted using a 2D numerical model along with field and estimated input data to estimate what could have been the extent of deformations shortly after construction of the barrier wall. It was found that strain due mainly to thermal contraction and autogenous shrinkage developed rapidly within 36 hours after construction, and resulted in high tensile stresses in the barrier wall causing it to crack prematurely. The detailed analysis, findings and conclusions were reported in Cusson and Repette (2000).
Figure 6: Longitudinal strains measured and calculated in Span 21
2.5 Discussion on sensor calibration
All sensors used in this project were calibrated before installation in the barrier wall sections. Calibration should normally be checked at the end of a project to validate the data measured during the study. Since the sensors were embedded in concrete, they could not be removed from the barrier wall for the calibration check. There are indirect means, however, to assess the validity of the results by further analysis of the data or by additional measurements with different instruments. For instance, the analysis of the temperature data such as that shown in Figure 1 indicates that the temperature measurements were valid since the values measured in the concrete of this span were very close to values measured in other spans. The temperature data also followed a trend that was consistent with the ambient temperatures that prevailed during the study.
Relative humidity measurements fall within expected ranges and are believed to be reasonably accurate. It was seen from the data shown in Figure 3 that the RH in concrete varied from approx. 70% to 100 % as a function of seasonal changes in RH and temperature and the gradual drying of concrete. In this range, moisture and oxygen were present in sufficient quantities to allow initiation of corrosion on the reinforcement under normal conditions.
The electrochemical potential measurements were calibrated by periodic measurements using an alternative measurement technique. The calibration procedure and the data correction method were described in Section 2.3.1 and illustrated in Figure 4.
The strain gauge measurements could not be validated directly. From the data presented in Figure 6, it can be seen that thermal strain accounted for a very large part of the total strain in concrete. Since the thermal strain is the result of a calculation as described earlier, a possible lack of precision in the measurement of the mechanical strain by the embedded gauges is not likely to affect the deduced total
-400 -350 -300 -250 -200 -150 -100 -50 0 50 100 150 200 250
1 Jan 97 1 Jan 98 1 Jan 99 1 Jan 00 1 Jan 01 1 Jan 02
Time (d mmm yy) MicroStrain Thermal strain Mechanical strain
3. OVERVIEW OF THE FINDINGS FROM THE FIELD CORROSION SURVEYS
In addition to the remote monitoring, non-destructive field corrosion surveys and laboratory experiments were conducted in parallel. The field corrosion surveys included annual measurements of half-cell potential, corrosion rate, and electrical resistivity conducted on 10 test spans of the barrier wall.
The analysis of the results obtained from several field tests revealed that the relative performance of a given corrosion inhibiting system varied widely from one test to another. In fact, each corrosion inhibiting system was found to perform very well in some tests, but not so well in others. This obviously makes the identification of the best corrosion inhibiting systems difficult. In order to allow a meaningful performance ranking of the different systems tested, a systematic approach was developed using both a relative performance index and an absolute performance index. The details of the approach and the complete set of performance results will be published in a separate paper (Qian and Cusson, 2002).
The analysis of the performance results obtained from the annual field corrosion surveys indicated that the system with a nitrite-based corrosion-inhibiting admixture and the system with epoxy-coated reinforcement offered the best field performance within the 5-year period of testing. It is important, however, to mention that the field performance results obtained so far were based on measurements taken during a relatively short period of time. It is certain that the performance of the different corrosion inhibiting systems will change after a longer period of time. Further monitoring is therefore needed to confirm these results.
4. SUMMARY AND CONCLUSIONS
In this 5-year study, ten spans of a reinforced concrete barrier wall were reconstructed, in which nine different rehabilitation techniques were applied, and one span was used as a control for comparison purposes. Embedded instrumentation was used to record the physico-chemical changes of the rehabilitated concrete barrier wall and the exposure conditions in order to assist in the evaluation of the field performance of different corrosion inhibiting systems. The main findings and conclusions related to the remote monitoring aspect of the study are outlined below.
1. Temperature data indicated that the corrosion inhibiting systems applied in the barrier wall had no significant effect on the thermal properties of concrete. It was also shown that seasonal variations of temperature had strong effects on all field variables measured in the study, namely the relative humidity in concrete, the electrochemical potential of the reinforcement and the concrete strain. 2. A procedure was successfully used to remove the temperature influence in the RH measurements for
a better assessment of the moisture state in concrete. The internal relative humidity for most rehabilitation techniques varied annually from 90-100% down to 70-90%, a range of RH favourable to corrosion initiation. It was found that the level of RH in concrete at a given time might have been influenced by a combination of many factors. They are: type of corrosion inhibitors, quality of the concrete, which varied from one pour to the next, and perhaps the distance between a given RH sensor and the nearest microcracks.
3. It was found that embedded graphite reference electrodes could not be relied upon due to unacceptable stability. On the other hand, embedded manganese dioxide electrodes were found relatively stable over the 5-year period but some gradual shifting of the potential was detected. The electrochemical potential measurements were successfully corrected by alternative measurements taken periodically with an external reference electrode. Half-cell potential curves show a seasonal variation with the most negative values occurring in warmer weather and a gradual overall change towards more negative values over time, indicating possible initiation of reinforcement corrosion. In cases where coatings were applied on the reinforcement, it was found that the measured potential was significantly less negative due to the high electrical resistance of the coated reinforcement. 4. The analysis conducted using a 2D numerical model and input data from the field indicated that
within 36 hours after construction, and resulted in high tensile stresses in the barrier wall causing it to crack prematurely. The long-term longitudinal strain monitored in the barrier wall indicated that the total strain and the related cracking were found to be independent of the presence or type of corrosion inhibiting systems used.
5. The analysis of the performance results obtained from the annual field corrosion surveys indicated that the system with a nitrite-based corrosion-inhibiting admixture and the system with epoxy-coated reinforcement offered the best field performance within the 5-year period of testing. It is important, however, to mention that the field performance results obtained so far were based on measurements taken during a relatively short period of time.
5. ACKNOWLEDGEMENTS
The Institute for Research in Construction of the National Research Council of Canada wishes to thank its partners for their contributions to the project: the Ministry of Transportation of Quebec, Axim Concrete Technology, Caruba Holdings, Euclid Admixture Canada, Israel Richler Trading, Master Builders Technologies, Sika Canada, W.R. Grace & Co, and the Regional Municipality of Peel. The authors wish to thank the following people at NRC for their scientific and technical contributions to the project: Noel Mailvaganam, Bruce Baldock, Nathalie Chagnon, Gordon Chan, Glendon Pye, Mark Arnott and IRAP’s Roger Willoughby. The sustained assistance of Louis Marie-Bélanger and Daniel Vézina from MTQ is also gratefully acknowledged.
6. REFERENCES
Cusson, D. and Mailvaganam, N. (1999) Monitoring Techniques for the Evaluation of Corrosion Inhibiting Systems in Reinforced Concrete Bridge Barrier Walls, Concrete International, ACI, 21(8), 41-47.
Cusson, D. and Repette, W. (2000) Early-age Cracking in Reconstructed Concrete Bridge Barrier Walls, Materials Journal, ACI, 97(4), 438-446.
Neville, A. M. (1996) Properties of Concrete, 4th ed., Editor: John Wiley & Sons Inc., New-York, USA, 844pp.
Pruckner, F. and Gjorv, O.E. (2001) Measurements of Relative Humidity in Concrete, 3rd Int. Conference on Concrete Under Severe Conditions, Editors: N. Banthia, K. Sakai and O.E. Gjorv, Vancouver, Canada, 1489-1496.
Qian, S. and Cusson, D. (2002) Electrochemical Evaluation of the Performance of Corrosion Inhibiting Systems in Concrete Bridges, Cement and Concrete Composites (accepted).
Shiessl, P. and Raupach, M. (1990) Influence of Concrete Composition and Microclimate on the Critical Chloride Content in Concrete, In: Corrosion of Reinforcement in Concrete, Editors: C.L. Page, K.W.J. Treadaway, and P.B. Bamforth, Society of Chemical Industry, Elsevier Applied Science, London, UK, 49-58.