Carbon Dioxide Capture by Chemical Absorption:
A Solvent Comparison Study
by
Anusha Kothandaraman B. Chem. Eng.
Institute of Chemical Technology, University of Mumbai, 2005 M.S. Chemical Engineering Practice
Massachusetts Institute of Technology, 2006
SUBMITTED TO THE DEPARTMENT OF CHEMICAL ENGINEERING IN PARTIAL FULFILLMENT OF THE REQUIREMENTS FOR THE DEGREE OF
DOCTOR OF PHILOSOPHY IN CHEMICAL ENGINEERING PRACTICE AT THE
MASSACHUSETTS INSTITUTE OF TECHNOLOGY
ARCHNES
JUNE 2010 MASSACHUSETTS INSTITUTEOF TECHNOLOGY @ 2010 Massachusetts Institute of Technology
JUN 30 2010
All rights reserved.
LIBRARIES
Signature of
Author... ...
Department of Chemical Engineering May 20, 2010
Certified v v J
b y ...
Gregory J. McRae Hoyt C. Hottel Professor of Chemical Engineering Thesis Supervisor Accepted
b y ...
William M. Deen Carbon P. Dubbs Professor of Chemical Engineering Chairman, Committee for Graduate Students
Carbon Dioxide Capture by Chemical Absorption:
A Solvent Comparison Study
by
Anusha Kothandaraman
Submitted to the Department of Chemical Engineering on May 20, 2010 in partial fulfillment of the requirements of the Degree of Doctor of Philosophy in
Chemical Engineering Practice
Abstract
In the light of increasing fears about climate change, greenhouse gas mitigation technologies have assumed growing importance. In the United States, energy related CO2
emissions accounted for 98% of the total emissions in 2007 with electricity generation accounting for 40% of the total'. Carbon capture and sequestration (CCS) is one of the options that can enable the utilization of fossil fuels with lower CO2 emissions. Of the
different technologies for CO2 capture, capture of CO2 by chemical absorption is the technology that is closest to commercialization. While a number of different solvents for use in chemical absorption of CO2 have been proposed, a systematic comparison of performance of different solvents has not been performed and claims on the performance of different solvents vary widely. This thesis focuses on developing a consistent framework for an objective comparison of the performance of different solvents. This framework has been applied to evaluate the performance of three different solvents
-monoethanolamine, potassium carbonate and chilled ammonia.
In this thesis, comprehensive flowsheet models have been built for each of the solvent systems, using ASPEN Plus as the modeling tool. In order to ensure an objective and consistent comparison of the performance of different solvent systems, the representation of physical properties, thermodynamics and kinetics had to be verified and corrected as required in ASPEN Plus. The ASPEN RateSep module was used to facilitate the computation of mass transfer characteristics of the system for sizing calculations. For each solvent system, many parametric simulations were performed to identify the effect on energy consumption in the system. The overall energy consumption in the CO2 capture and compression system was calculated and an evaluation of the required equipment size for critical equipment in the system was performed. The degradation characteristics and environmental impact of the solvents were also investigated. In addition, different flowsheet configurations were explored to optimize the energy recuperation for each system.
Monoethanolamine (MEA) was evaluated as the base case system in this thesis. Simulations showed the energy penalty for CO2 capture from flue gas from coal-fired
power plants to be 0.01572 kWh/gmol CO2. The energy penalty from CO2 regeneration
accounted for 60% of the energy penalty while the compression work accounted for 30%. The process flexibility in the MEA system was limited by degradation reactions. It was found that different flowsheet configurations for energy recuperation in the MEA system did not improve energy efficiency significantly.
Chilled ammonia was explored as an alternative to MEA for use in new coal-fired power plants as well as for retrofitting existing power plants. The overall energy penalty for CO2
capture in chilled ammonia was found to be higher than in the MEA system, though energy requirements for CO2 regeneration were found to be lower. The energy penalty for
85% capture of CO2 in the chilled ammonia system was estimated to be 0.021 kWh/gmol CO2. As compared to the MEA system, the breakdown of the energy requirements was different with refrigeration in the absorber accounting for 44% of the energy penalty. This illustrates the need to perform a systemwide comparison of different solvents in order to evaluate the performance of various solvent systems.
The use of potassium carbonate as a solvent for CO2 capture was evaluated for use in
Integrated Reforming Combined Cycle (IRCC) system. With potassium carbonate, a high partial pressure of CO2 in the flue gas is required. Different schemes for energy recuperation in the system were investigated and the energy consumption was reduced by 22% over the base case. An optimized version of the potassium carbonate flowsheet was developed for an IRCC application with a reboiler duty of 1980 kJ/kg.
In conclusion, a framework for the comparison of the performance of different solvents for CO2 capture has been developed and the performance of monoethanolamine, chilled ammonia and potassium carbonate has been compared. From the standpoint of energy consumption, for existing power plants the use of MEA is found to be the best choice while for future design of power plants, potassium carbonate appears to be an attractive alternative. An economic analysis based on the technical findings in this thesis will help in identifying the optimal choices for various large, stationary sources of CO2.
Thesis Supervisor: Gregory J. McRae
Title: Hoyt C. Hottel Professor of Chemical Engineering
Acknowledgements
I would like to begin by sincerely thanking my advisor, Prof. Greg McRae for his constant support, guidance and mentorship over the course of this thesis. He gave me the freedom to define my thesis statement and always acted as a very helpful sounding board for my ideas. Whenever I was bereft of ideas, my discussions with him and his insights always helped me get back on the right track. He has always encouraged me to explore a wide variety of opportunities. I have truly learnt a lot from him over the past 5 years and for this, I am very grateful.
I would also like to thank my thesis committee members - Howard Herzog, Prof. William Green and Prof. Ahmed Ghoniem for their valuable suggestions and advice. My collaborators at NTNU - Prof. Olav Bolland and Lars Nord were always ready to help me in understanding the power cycles and power plant modeling and I thank them for their time and helpful discussions. I am also very thankful to Randy Field for all his help with the ASPEN modeling in this work.
I am very grateful to the Norwegian Research Council, StatoilHyrdo, the Henry Bromfield Rogers Fellowship at MIT and the BPCL scholarship for the funding they have provided that has aided me greatly in the completion of this work.
Past and present members of the McRae group have been great sources of cheer and comfort during the past 5 years and I am grateful to them for their support. I would like to thank Ingrid Berkelmans, Bo Gong, Alex Lewis, Mihai Anton, Ken Hu, Carolyn Seto, Adekunle Adeyemo, Arman Haidari, Chuang-Chung Lee, Sara Passone, Jeremy Johnson and Patrick deMan for their friendship over the years. I would also like to thank Joan Chisholm, Liz Webb and Mary Gallagher for their support over the years and for making my life at MIT so much easier.
On a personal note, I know that this work could not have been completed without the tremendous support of my friends and family. I would like to thank my friends at MIT for all the good memories they have provided over the past few years. Ravi has been a great source of strength and support for me through each step of the journey and I thank him for his constant encouragement, optimism and belief in me. Finally, my gratitude to my parents is beyond measure - all through my life, they have always sacrificed to ensure that I had the best opportunities possible and they have constantly believed in me and encouraged me to dream big and to pursue those dreams. I cannot put into words what their support has meant to me over the years and I dedicate this thesis to them.
Table of contents
CHAPTER 1: INTRODUCTION... 24
1.1 Motivation for carbon capture and sequestration... 24
1.2 Brief overview of CO2 capture systems... 26
1.2.1 Post-combustion capture... 27
1.2.2 O xyfuel com bustion... 29
1.2.3 Chemical looping combustion ... 32
1.2.4 Precombustion capture... 34
1.3 Current status of CO2 capture technology ... 40
1.4 Solvent systems for chemical absorption... 43
1.5 Thesis objectives... 44
1.6 Thesis Overview ... 46
1.7 R eferences... 47
CHAPTER 2: ASPEN THERMODYNAMIC AND RATE MODELS ... 52
2.1 Electrolyte NRTL model... 52
2.1.1 Long range contribution... 53
2.1.2 B orn expression ... 55
2.1.3 Local contribution... 55
2.2 Soave-Reidlich-Kwong equation of state ... 57
2.3 Reidlich-Kwong-Soave-Boston-Mathias equation of state... 59
2.4 Rate-based modeling with ASPEN RateSep... 59 6
2.4.1 F low m odels... 6 1
2.4 .2 F ilm reactions... 63
2.4.3 Column hydrodynamics... 65
2.5 Aspen Simulation Workbook... 65
2.6 References... 66
CHAPTER 3: MONOETHANOLAMINE SYSTEM... 68
3.1 Process description... 68
3.2 Chemistry of the MEA system... 73
3.2.1 Carbamate formation in the MEA system ... 74
3.3 Thermochemistry in the MEA system ... 77
3.4 VLE in the MEA-C0 2-H20 system ... 77
3.5 Degradation of MEA solvent... 80
3.5.1 Carbamate polymerization... 80
3.5.2 Oxidative degradation... 81
3.6 MEA flowsheet development ... 82
3.7 MEA system equilibrium simulation results... 84
3.8 Rate-based modeling of the MEA system... 89
3.8.1 Film discretization ... 89
3.8.2 Sizing of equipment ... 91
3.9 Results from rate-based simulations for the MEA system... 93
3.9.1 Effect of capture percentage ... 97
3.9.3 Effect of absorber height... 100
3.9.4 Effect of solvent tem perature... 101
3.9.5 Effect of desorber height... 102
3.9.6 Effect of desorber pressure ... 103
3.9.7 Breakdown of energy requirement in the reboiler ... 105
3.9.8 Effect of cross-heat exchanger... 106
3.9.9 Other methods of energy recuperation... 107
3.10 Calculation of work for the MEA system ... 108
3.11 Total work for CO2 capture and compression for NGCC plants... 109
3.12 Total work for CO2 capture and compression in coal-fired power plants .. 110
3.13 M EA conclusion ... 113
3.14 R eferences... 115
CHAPTER 4: POTASSIUM CARBONATE SYSTEM... 119
4.1 Process description... 119
4.2 Chemistry of the potassium carbonate system... 121
4.3 Vapor-liquid equilibrium in K2CO3-H20-CO2 system... 122
4.4 Difference in mode of operation between MEA and K2CO3 systems... 125
4.5 Flowsheet development for potassium carbonate system... 127
4.5.1 Effect of absorber pressure ... 128
4.6 Equilibrium results with 40 wt. % eq.K2CO3... ... 129
4.7 Rate-based modeling of the potassium carbonate system... 130
4.7.1 Film discretization ... 130 8
4.7.2 Definition of parameters used in the rate-based simulation... 131
4.8 Results from rate-based simulation of the potassium carbonate system... 132
4.8.1 E ffect of packing ... 133
4.8.2 Effect of desorber height... 134
4.8.3 Effect of desorber pressure ... 135
4.9 Energy recuperation in the K2C0 3 system... 136
4.9.1 Flashing of rich solution and heat exchange with lean solution... 136
4.9.2 U se of split-flow absorber... 137
4.10 Development of potassium carbonate model for Integrated Reforming Combined Cycle Plant ... 138
4.11 Use of potassium carbonate solvent with additives... 140
4.12 Potassium carbonate system conclusion ... 141
4.13 R eferences... 142
CHAPTER 5: CHILLED AMMONIA SYSTEM ... 144
5.1 Chemistry of the chilled ammonia system... 144
5.2 Thermodynamics of the chilled ammonia system... 145
5.3 Process description... 149
5.4 Thermochemistry in the chilled ammonia system ... 154
5.4.1 Thermochemistry from Clausius-Clapeyron equation... 154
5.4.2 Thermochemistry in ASPEN ... 156
5.5 Analysis of the absorber ... 157
5.5.2 Effect of lean loading... 161
5.5.3 Effect of molality of solution... 163
5.6 Analysis of the desorber ... 165
5.7 Discussion of mass transfer considerations ... 173
5.7.1 Intrinsic mass transfer coefficient... 173
5.7.2 Inhibition of mass transfer by precipitation... 177
5.8 Total energy utilization in the chilled ammonia system... 178
5.8.1 Coefficient of performance for refrigeration ... 179
5.8.2 C om pression w ork ... 179
5.8.3 Flue gas chiller w ork... 180
5.8.4 Steam extraction from power plant... 180
5.9 Conclusion for chilled ammonia system ... 184
5.10 References... 185
CHAPTER 6: SUMMARY, CONCLUSIONS AND FUTURE WORK... 187
6.1 Summary of research and thesis contributions... 187
6.2 Future work... 190
CHAPTER 7: PHD CEP CAPSTONE: CASE STUDY OF DIFFERENT ENVIRONMENTAL REGULATIONS IN THE US ... 192
7.1 Comparison of command-and-control environmental policies and market-based environmental policies ... 192
7.2 Phasedown of lead in gasoline in the United States ... 194
7.2.1 History of lead as a fuel additive and regulations on leaded gasoline... 194
7.2.2 Mechanics of the lead trading program in the US ... 196 10
7.2.3 How did refineries adopt to changing lead regulations?... 200
7.2.4 Conclusion on phasedown of lead usage in gasoline... 202
7.3 Chlorofluorocarbon (CFC) reduction in the US... 203
7.3.1 What are CFCs and why are they harmful?... 203
7.3.2 R egulation of CFC use... 203
7.3.3 Effectiveness of the regulatory system in decreasing CFC production... 209
7.3.4 Development of new technology and products... 211
7.4 Regulation of SO2 emissions from power plants in the US ... 212
7.4.1 Regulation of SO 2 in the 1970s... 212
7.4.2 Regulation of SO2 emissions from 1990... 216
7.4.3 Com pliance strategies of utilities... 218
7.4.4 Effects of Clean Air Act on S02 emissions ... 219
7.4.5 Technology innovation and diffusion under the Clean Air Act... 230
7.5 C onclusion ... 238
7.6 R eferences... 241
APPENDIX A: OTHER POST-COMBUSTION CAPTURE TECHNOLOGIES 244 A.1 Physical absorption... 244
A.2 M em brane separation... 244
A.3 Adsorption ... 245
A.4 References... ... 247
APPENDIX B: OXYFUEL CYCLES... ... 248
B.2 Oxyfuel fired gas turbine... 249
B.3 R eferences... 251
APPENDIX C: CHEMICAL LOOPING COMBUSTION AND REFORMING .. 252
C.1 Chemical looping steam reforming ... 254
C.2 Chemical looping autothermal reforming ... 255
C .3 R eferences... 258
APPENDIX D: CALCULATION OF MINIMUM WORK OF SEPARATION AND COMPRESSION... 259
D.1 Minimum work of separation ... 259
D.2 Minimum work of compression... 261
D .3 R eferences... 262
List of figures
Figure 1-1: Plot of global instrumental temperature anomaly vs. time (temperature
average from 1961-1990). Data for the figure from [1]... 24
Figure 1-2: Plot of atmospheric CO2 concentration (ppmv) vs. time as measured at Mauna Loa, H aw aii. D ata from [3]... 25
Figure 1-3: World Electricity Generation by Fuel, 2006-2030. Data from [5]... 26
Figure 1-4: Classification of CO2 capture systems ... 27
Figure 1-5: Schematic of post-combustion capture ( Adapted from [2])... 27
Figure 1-6: Schematic of oxyfuel combustion. Adapted from [2]... 30
Figure 1-7: Schematic of chemical looping combustion. Adapted from [11] ... 33
Figure 1-8: Schematic of chemical looping combustion system integrated with a power cycle. A dapted from [13] ... 34
Figure 1-9: Schematic of precombustion decarbonization. Adapted from [2] ... 35
Figure 1-10: Flowsheet of autothermal reforming process. Adapted from [13]... 37
Figure 1-11: Block diagram of IGCC power plant. Adapted from [15]... 38
Figure 2-1: ASPEN representation of a stage (Adapted from [16]) ... 61
Figure 2-2: Mixed flow model in ASPEN RateSep (Adapted from [16])... 62
Figure 2-3: Concurrent flow model in ASPEN Plus (Adapted from [16])... 62
Figure 2-5: VPlugP flow model in ASPEN Plus ... 63
Figure 3-1: Schematic of CO2 capture by use of MEA solvent (Adapted from [7]) ... 69
Figure 3-2: Zwitterion mechanism for carbamate formation... 74
Figure 3-3: Termolecular mechanism for carbamate formation... 76
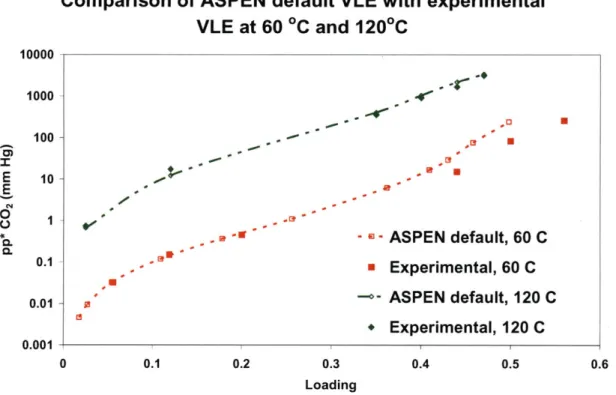
Figure 3-4: Comparison of ASPEN default VLE with experimental VLE at 60'C and 120'C. Experim ental data from [17]... 78
Figure 3-5: Comparison of modified ASPEN VLE with experimental VLE at 60'C and 120'C. Modified interaction parameters from [18] and experimental data from [17]... 79
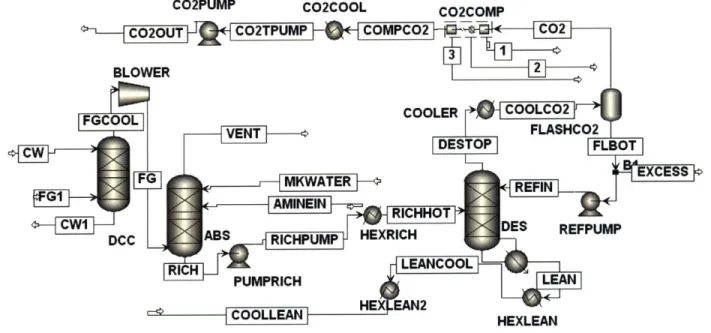
Figure 3-6: Process flow diagram of MEA system as developed in ASPEN Plus ... 82
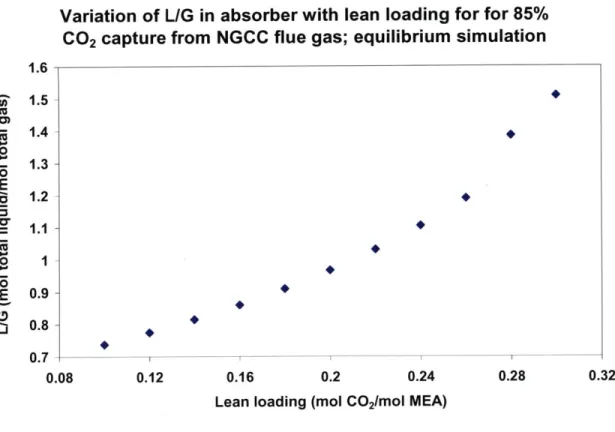
Figure 3-7: Variation of L/G with lean loading for 85% CO2 capture from NGCC flue gas; equilibrium sim ulation... 85
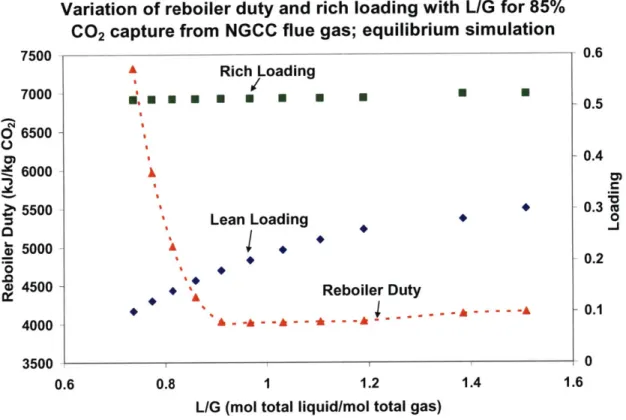
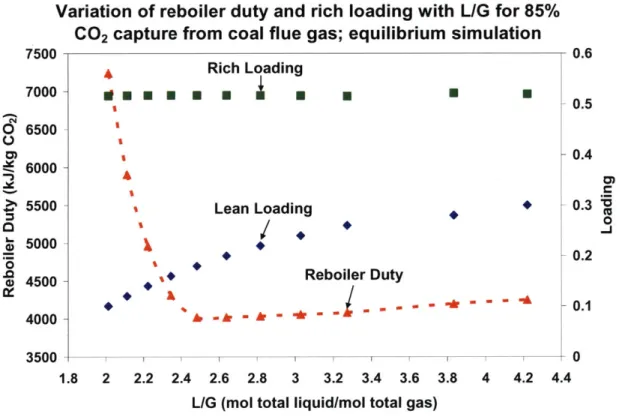
Figure 3-8: Variation of reboiler duty and rich loading with L/G for 85% CO2 capture from NGCC flue gas; equilibrium simulation ... 86
Figure 3-9: Variation of L/G with lean loading for 85% CO2 capture from coal flue gas; equilibrium sim ulation ... 87
Figure 3-10: Variation of reboiler duty and rich loading with L/G for 85% CO2 capture from coal flue gas; equilibrium simulation... 88
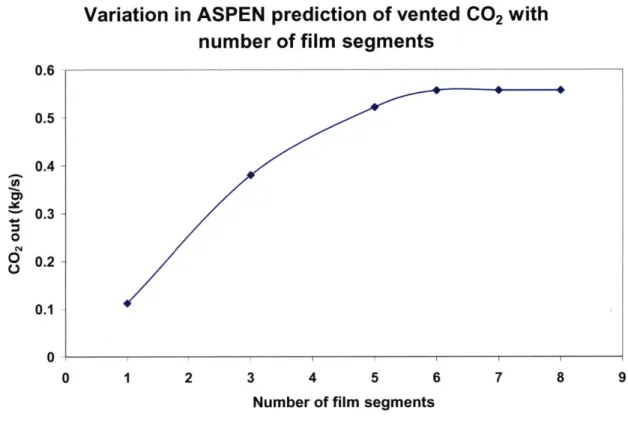
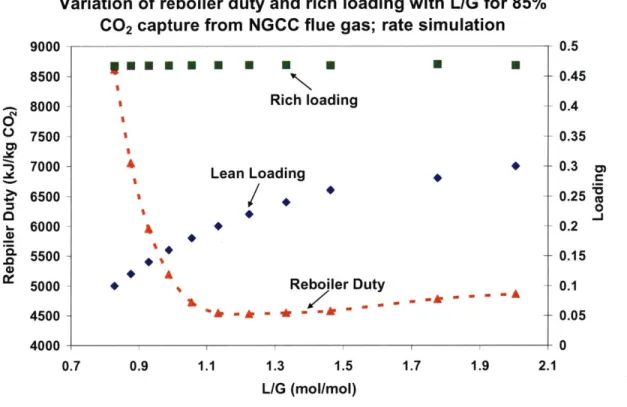
Figure 3-11: Variation in ASPEN prediction of vented CO2 with number of film segm en ts... 9 0 Figure 3-12: Variation of reboiler duty and rich loading with L/G for 85% CO2 capture from NGCC flue gas: rate sim ulation... 93
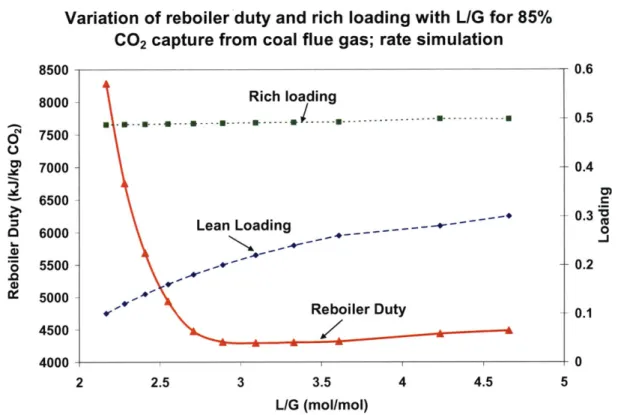
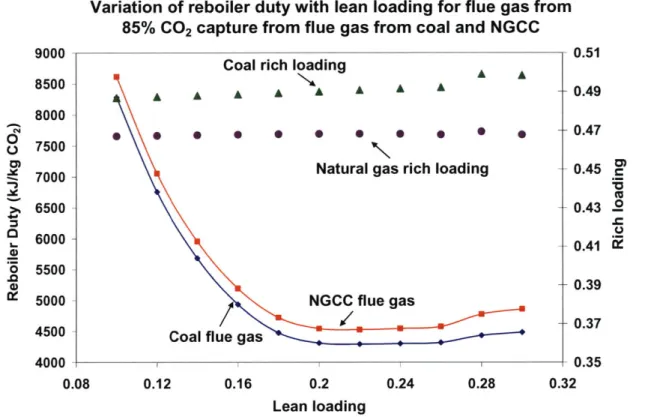
Figure 3-13: Variation of reboiler duty and rich loading with L/G for 85% CO2 capture from coal flue gas: rate sim ulation... 94 Figure 3-14: Variation of reboiler duty with rich loading for 85% CO2 capture from coal flue gas and NGCC flue gas; rate simulation... 95 Figure 3-15: Comparison of results from equilibrium and rate simulations for 85% CO2 capture from N G CC flue gas ... 96 Figure 3-16: Variation of reboiler duty with lean loading for different capture percentages of CO 2 for N G CC flue gas ... 97
Figure 3-17: Variation in reboiler duty and rich loading with lean loading for different p ack in g typ es ... 9 9 Figure 3-18: Variation in reboiler duty with absorber height for 85% CO2 capture from N G C C flue gas... 100 Figure 3-19: Absorber temperature profiles for 85% CO2 capture from coal flue gas... 102
Figure 3-20: Variation in reboiler duty and temperature with reboiler pressure for 85% CO 2 capture from N G CC flue gas ... 103
Figure 3-21: Variation in electric work with reboiler pressure for 85% CO2 capture from
N G C C flue gas... 105 Figure 3-22: Breakdown of energy requirements in reboiler... 106 Figure 3-23: Variation in reboiler duty with lean loading for approach temperatures of 5 and 1 00C for N G C C flue gas ... 107 Figure 3-24: Breakdown of energy consumption in CO2 capture system of NGCC plant ... 1 1 0 Figure 3-25: Breakdown of total energy requirement for coal-fired power plants... 111
Figure 3-26: Energy requirement for CO2 capture in a NGCC plant ... 112
Figure 3-27: Energy requirement for CO2 capture in a coal-fired power plant ... 113
Figure 4-1: Process flowsheet for a typical potassium carbonate process... 120 Figure 4-2: Comparison of ASPEN default & experimental VLE for the K2C0 3-CO2-H20 system (40 wt.% eq.K2CO3) at 70, 90, 110 and 130 'C. Experimental data from [4] via
[5 ] ... 12 3 Figure 4-3: Comparison of ASPEN modified & experimental VLE for the K2CO3-CO2 -H20 system (40 wt.% eq.K2C0 3) at 70, 90, 110 and 130 'C. Experimental data from [4]
via [5]. Modified interaction parameters in ASPEN from [5] ... 124 Figure 4-4: Comparison of VLE of MEA-C0 2-H20 system and K2CO3-CO2-H20 system
... 12 6 Figure 4-5: Flowsheet as developed in ASPEN Plus for the potassium carbonate system ... 12 7 Figure 4-6: Variation of rich loading and L/G with absorber pressure at a constant lean loading of 0.5 for the potassium carbonate system; equilibrium simulation ... 128 Figure 4-7: Variation of reboiler duty and L/G with lean loading for 85% capture of C0 2; equilibrium sim ulation ... 129 Figure 4-8: Variation of reboiler duty and rich loading with L/G for 85% CO2 capture; rate-based sim ulation ... 132 Figure 4-9: Variation of reboiler duty with desorber height for 85% capture of C0 2; rate-based sim ulation ... 135 Figure 4-10: Flowsheet for energy recuperation by flashing of rich solution and heat exchange w ith lean solution... 136
Figure 4-11: Energy recuperation by use of a split-flow absorber ... 138 Figure 4-12: Schematic of IRCC plant with CO2 capture. Adapted from [11]... 139
Figure 4-13: Flowsheet of potassium carbonate system developed for application in IRCC p lan t... 14 0 Figure 5-1: Comparison of ASPEN default VLE and experimental VLE for the NH3-CO2
-H20 system for a 6.3M NH3 solution at 40'C. Experimental data from [8] ... 146 Figure 5-2: Comparison of ASPEN default VLE and experimental VLE for the NH3-CO 2-H20 system for a 11.9m NH3 solution at 60'C. Experimental data from [8]... 147 Figure 5-3: Comparison of VLE of NH3-CO2-H20 system for 6.3M and 1l.9M NH3 solution at 313K . D ata from [8]... 148 Figure 5-4: Comparison of VLE for NH3-CO2-H20 solution at 313K and 333K for 11.9m
N H 3 solution. D ata from [8]... 149 Figure 5-5: Flowsheet for chilled ammonia process... 150 Figure 5-6: Variation in concentration of NH3 in vent gas with temperature for a 20.9Mm N H 3 solution, w ith a lean loading of 0.4... 158 Figure 5-7: Flowsheet as developed in ASPEN for the absorber section of the chilled am m onia process... 159 Figure 5-8: Variation of rich loading and L/G in absorber with temperature for a 20.9m NH3 solution at a lean loading of 0.42 for 85% CO2 capture from coal flue gas ... 160
Figure 5-9: Variation in refrigerator load and water wash desorber duty with temperature for a 20.9m NH3 solution, lean loading of 0.42, 85% CO2 capture from coal flue gas.. 161
Figure 5-10: Variation of L/G and wt.% of solids in rich solution with lean loading for a 10.im NH3solution at 5'C for 85% capture of CO2 from coal flue gas ... 162
Figure 5-11: Variation of refrigeration, water wash desorber and total duty with lean loading for a 10.1m NH3 solution at 5oC for 85% capture of CO2 from coal flue gas... 163
Figure 5-12: Variation of L/G with molality of NH3 for a lean loading of 0.4 and temperature of 5'C for 85% capture of CO2 from coal flue gas... 164
Figure 5-13: Variation of refrigeration duty and rich solids wt.% with molality of NH3 for a lean loading of 0.4 and temperature of 5'C for 85% capture of CO2 from coal flue gas ... 16 5 Figure 5-14: Desorber section of the flowsheet as developed in ASPEN Plus ... 167 Figure 5-15: Variation of L/G and solid% in rich stream vs. molality of NH3 solution at lean loading of 0.4 and temperature of 5'C for 85% capture of CO2 from coal flue gas. ... 1 6 8 Figure 5-16: Variation of refrigeration duty in absorber with molality of NH3 solution for a lean loading of 0.4 and temperature of 5'C and 85% capture of CO2 from coal flue gas.
... 1 6 9 Figure 5-17: Variation of wt.% of solids leaving heat exchanger and additional heat exchanger duty with molality of NH3 at a lean loading of 0.4 and temperature of 5'C for 85% capture of CO 2 from coal flue gas ... 171
Figure 5-18: Variation of desorber and heat exchanger duties with molality of NH3 solution at a lean loading of 0.4 and temperature of 5'C for 85% capture of CO2 from coal flu e gas ... 172 Figure 5-19: Distribution of energy requirements in chilled ammonia system for 85% capture of CO2 from flue gas from coal-fired power plants ... 182
Figure 5-20: Energy requirement for 85% capture of CO2 from flue gas from a coal-fired
Figure 7-1: Effect of lead allowances trading on compliance with regulations. Figure adapted from [7]... 198 Figure 7-2: Effect of lead allowances banking on compliance with regulations. Figure adapted from [7]... 199 Figure 7-3: Trend of cumulative number of isomerization adoptions over time. Figure adapted from [5]... 20 1 Figure 7-4: Production of CFCs in the US from 1972 to 1988. Data from [11]... 204 Figure 7-5: Production of Annex I chemicals in the US after 1990. Figure adapted from [12 ] ... 2 10 Figure 7-6: Worldwide production of Annex I chemicals after 1990. Figure adapted from [12 ] ... 2 1 1 Figure 7-7: Comparison of actual SO2 emissions in the US after enactment of Clean Air Act Amendment of 1990 with predicted SO2 emissions. Figure adapted from [20]... 220
Figure 7-8: Emissions from phase I units compared to allowance caps from 1995 to 1999. D ata from [2 1]... 22 1 Figure 7-9: Comparison of usage levels of different coal types in 1990 and 1995. Data from [2 2 ] ... 2 2 2 Figure 7-10: Percentage of electricity generating units employing each compliance strategy in 1995. D ata from [22]...223 Figure 7-11: Percentage reduction in emissions from each compliance strategy. Data from
[2 2 ] ... 2 2 4 Figure 7-12: Comparison of total SO2 emissions from phase I and phase II units with allowed emissions from 1995 to 2006. Data from [21] ... 225
Figure 7-13: Size of SO2 emissions bank from 1995-2006. Data from [21] ... 226
Figure 7-14: Volume of trade in SO2 allowances from 1994 to 2003. Data from [23].. 228
Figure 7-15: Price history for SO2 allowances from 1994 to 2010. Adapted from [24-25]
... 2 2 9 Figure 7-16: Trend in US patents relevant to S02 control technologies from 1974-1993. A dapted from [26]... 23 1 Figure 7-17: Trend in US patents relevant to precombustion SO2 control technologies from 1974-1993. A dapted from [26] ... 232 Figure 7-18: Variation of capital costs of FGD with cumulative FGD capacity. Adapted from [2 6 ] ... 2 3 3 Figure 7-19: Variation of scrubbing efficiency with cumulative installed FGD capacity in the U S. A dapted from [26]... 234 Figure 7-20: Variation of scrubbing efficiency of FGD with year of installation. Adapted from [15] ... 2 3 5 Figure 7-21: Percentage of scrubbers with different removal efficiencies by regulatory regim e. D ata from [15] ... 237 Figure B-1: Schematic of oxyfuel fired gas turbine cycle. Adapted from [5]... 249 Figure C-1: Flowsheet of chemical looping steam reforming. Adapted from [8]. ... 254 Figure C-2: Schematic of chemical looping autothermal reforming. Adapted from [9] 256 Figure C-3: Flowsheet of chemical looping autothermal reforming. Adapted from [10] ... 2 5 7 Figure D- 1: Schematic of separation system ... 259
List of tables
Table 1-1: : CO2 partial pressure in flue gases of different combustion systems. (Data taken from [2]) ... 2 8 Table 1-2: Energy requirement to produce 02 for combustion of different fuels. (Adapted fro m [10 ])... 3 1
Table 1-3: Amine scrubbing technology. Data from [23-24]... 42
Table 3-1: Values of temperature dependent parameters for equilibrium constant in MEA sy stem ... 74
Table 3-2: Thermochemistry in the MEA system. Data from [16]... 77
Table 3-3: Specified discretization points in the liquid film... 91
Table 3-4: Values of parameters used in the absorber for the MEA system ... 92
Table 3-5: Values of parameters used in the desorber of the MEA system... 92
Table 3-6: Minimum reboiler duty obtained with different packings in the absorber... 99
Table 3-7: Steam withdrawal conditions for coal and NGCC plants for use in reboiler of M E A sy stem ... 109
Table 3-8: Total work in CO2 capture system in NGCC plants... 109
Table 3-9: Total work in CO2 capture system in coal-fired power plants ... 111
Table 4-1: Values of parameters of equilibrium constants for the potassium carbonate sy stem ... 12 2 Table 4-2: Location of discretization points in the liquid film... 130
Table 4-3: Values of parameters used in the absorber of the potassium carbonate system ... 1 3 1 Table 4-4: Values of parameters used in the desorber of the potassium carbonate system ... 13 1 Table 4-5: Effect of packing type in the absorber... 133 Table 4-6: Effect of packing type in the desorber... 134 Table 5-1: Vapor pressure of CO2 at different loadings and temperatures. Data from [10]
... 1 5 5 Table 5-2: Heat of reaction for different temperature ranges as calculated by the Clausius-C lapeyron equation ... 156 Table 5-3: Steam withdrawal condition for chilled ammonia system ... 181 Table 5-4: Work required in different components of the chilled ammonia system ... 182 Table 6-1: Summary of results from the three solvent systems... 188 Table 7-1: Breakdown of banking of SO2 allowances by compliance strategy. Data from
[19 ] ... 2 2 7 Table 7-2: Percentage of scrubbers with different removal efficiencies under each regulatory regime. Adapted from [15]...236 Table D-1: Availability data for CO2 at 1 bar and 110 bar. Data from [2]... 261
List of symbols
A, :Debye-Huckel parameter
Cs :Concentration of solvent
d Solvent density
Dc02 Diffusivity of C02
Ds :Dielectric constant of mixed solvent Dw :Dielectric constant of water
e Charge of an electron
gex* Molar excess Gibbs free energy
gex*,Iocal Local interaction contribution to molar excess Gibbs free energy
gex*,LR: Long-range contribution to molar excess Gibbs free energy
Ix :Ionic strength on a mole fraction basis ki :First-order rate constant
k2 :Second-order rate constant
kB Boltzmann constant
ki :Mass-transfer coefficient
Kx :Equilibrium constant (mole fraction based) Ms :Molecular weight of solvent in kg/kmol
NcO2 Flux of C02
No Avogadro's number
P Vapor pressure
Pei :Critical pressure of species i
QC
:Heat absorbed at lower temperatureR Universal gas constant
rk Born radius of species k
S Entropy
T Temperature, in K
Tei :Critical temperature of species i
Vm Molar volume
W Net work
Wmin Minimum thermodynamic work
xk Liquid-phase mole fraction of species k
Zk Charge on species k
a Nonrandomness parameter
6 Film thickness
AH Heat of reaction (kcal/mol)
p Closest approach parameter
T :Binary energy interaction parameter
Chapter 1
Introduction
1.1 Motivation for carbon capture and sequestration
Greenhouse gas mitigation technology, particularly with respect to CO2 is assuming increasing importance in the light of climate change fears. Over the past 30 years, there has been growing concern due to increasing global temperatures. Figure 1-1 shows the increase in the difference between the global mean surface temperature and the average temperature from 1961-1990 [1].
Plot of instrumental temperature anamoly vs time (temperature average from 1961-1990)
1890 1910 1930 1950 1970 Year
Figure 1-1: Plot of global instrumental temperature anomaly vs. time from 1961-1990). Data for the figure from [11
1990 2010 (temperature average 0.65 -0.55 0.45 0.35- 0.25-0.15 -0.05 --0.05 - -0.15--0.25 --0.35 --0.45 --1870 ... . . ... ... . ... -- - - - ... ... I
Much of the increase in global temperatures has been attributed to the increasing CO2
concentration in the atmosphere due to human activity [2]. Figure 1-2 shows the trend in atmospheric CO2 concentration as measured at Mauna Loa Observatory, Hawaii [3].
Plot of atmospheric CO2 concentration (ppmv) vs time as
measured at Mauna Loa, Hawaii
390 380 370 360 350 340 330 320 310 4-1958 1963 1968 1973 1978 1983 1988 1993 1998 2003 2008 Time
Figure 1-2: Plot of atmospheric Loa, Hawaii. Data from [3].
CO2 concentration (ppmv) vs. time as measured at Mauna
In the US, energy-related CO2 emissions accounted for 98% of the total emissions in
2007, with electricity generation accounting for 40% of the total [4]. The electricity-generating sector - coal and natural gas fired power plants - creates concentrated and large sources of C02, on which CO2 mitigation technologies can be deployed first. The
EIA predicts that in 2030, CO2 emissions from electricity generation in the US will increase to 2700 million metric tons and account for 43% of the total US emissions [5]. This is because fossil fuels are expected to dominate the electricity generating mix for the next few decades. Figure 1-3 shows the expected utilization of different fuels for world electricity generation [5]. From Figure 1-3, it is apparent that coal will continue to be the
25
major fuel utilized for electricity generation in the near future. Hence, there is an urgent need to deploy technologies that will allow the utilization of fossil fuels in a cleaner way
and provide a bridge to a more green economy in the future.
World Electricity Generation by Fuel, 2006-2030
14- 12-10 - 8- 6- 4- 2-2006 2010 2015 2020 2025 2030
Figure 1-3: World Electricity Generation by Fuel, 2006-2030. Data from [5].
1.2 Brief overview of CO
2capture systems
There are basically three systems for carbon dioxide capture and they are classified as shown in Figure 1-4.
Post-combustion Oxyfuel Pre-combustion capture combustion capture
Figure 1-4: Classification of CO2capture systems
Post-combustion capture
Post-combustion capture is a downstream process that is analogous to flue gas desulfurization. It involves the removal of CO2 from the flue gas produced after the combustion of the fuel. A schematic of post-combustion capture is presented in Figure
1-5. N2, H20, etc. Fuel Separation to to CO2 to storage Oxidant Power
Figure 1-5: Schematic of post-combustion capture ( Adapted from [2])
The oxidant used for combustion is typically air and hence, the flue gases are diluted significantly with nitrogen. In addition, since the flue gases are at atmospheric pressure, a large volume of gas has to be treated. Table 1-1 presents the typical CO2 percentage in
the flue gases from different combustion systems.
1.2.1
Table 1-1: CO2 partial pressure in flue gases of different combustion systems. (Data taken
from [2])
CO2 Pressure of gas CO2 partial
Flue gas source concentration, stream, pressure,
% vol (dry) MPa MPa
Natural gas fired 7-10 0.1 0.007-0.01
boilers
Gas turbines 3-4 0.1 0.003-0.004
Oil fired boilers 11-13 0.1 0.011-0.013
Coal fired boilers 12-14 0.1 0.012-0.014
IGCC after 12-14 0.1 0.012-0.014
combustion
IGCC synthesis gas 8-20 2-7 0.16-1.4 (before shift)
after gasification
A number of methods exist for the post-combustion capture of CO2 from flue gases. These include: * Chemical absorption " Physical absorptions * Membrane separation e Adsorption * Cryogenic separation 1.2.1.1 Chemical absorption
Chemical absorption systems at present are the preferred option for post-combustion capture of CO2. Chemical absorption systems have been in use since the 1930s for the
capture of CO2 from ammonia plants for use in food applications and hence, are a commercially realized technology, though not at the scale required for power plants. CO2 is separated from the flue gas by passing the flue gas through a continuous scrubbing system. The system consists of an absorber and a desorber. Absorption processes utilize the reversible chemical reaction of CO2 with an aqueous alkaline solvent, usually an
amine. In the desorber, the absorbed CO2 is stripped from the solution and a pure stream
of CO2 is sent for compression while the regenerated solvent is sent back to the absorber. The process of chemical absorption with different solvents is discussed in detail in the later chapters of this thesis. Heat is required in the reboiler to heat up the solvent to the required temperature; to provide the heat of desorption and to produce steam in order to establish the required driving force for CO2 stripping from the solvent. This leads to the
main energy penalty on the power plant. In addition, energy is required to compress the CO2 to the conditions needed for storage and to operate the pumps and blowers in the process.
A discussion of physical absorption, membrane separation and adsorption is presented in Appendix A.
1.2.2
Oxyfuel combustion
The main disadvantage of post-combustion capture systems is the dilution of the flue gases due to nitrogen. This problem can be mitigated if the combustion is carried out in the presence of oxygen instead of air. The burning of fossil fuel in an atmosphere of oxygen leads to excessively high temperatures - as high as 3500'C. The temperature is moderated to a level that the material of construction can withstand by recycling a fraction of the exhaust flue gases. Figure 1-6 depicts a schematic of oxyfuel combustion.
Figure 1-6: Schematic of oxyfuel combustion. Adapted from [21
The flue gas contains mainly CO2 and water. It may also contain other products of combustion, such as NOx and SO, depending on the fuel employed. One of the advantages of oxyfuel combustion is that the formation of NOx is lowered since there is negligible amount of nitrogen in the oxidant. Any formation of NOx will only arise from the nitrogen in the fuel. However, if the amount of fuel-bound nitrogen is high, the concentration of NOx will be very high since it is not diluted by nitrogen. It is necessary that the NOx be removed prior to recycle of the flue gas [6]. After condensation of water, the flue gas contains 80-98% CO2 depending on the type of the fuel used [2]. This is then
compressed, dried and sent for storage. The CO2 capture efficiency is very close to 100% in these systems. It may be necessary to remove acidic gases such as SOx and NOx if their levels are above those prescribed for CO2 sequestration. Removal of noble gases such as argon may be necessary depending on the purity of 02 employed for combustion. Since there is less NOx, the partial pressure of SOx and HCl are increased leading to an increase in the acid dew point. Hence, it may be necessary to employ dry recycle of CO2 if the sulfur content of the fuel is high. Since the stream is pure in CO2 and is directly sequestered, it may be possible to store the SO2 along with the CO2 and claim mixed credits for this. This will avoid the need for a flue gas desulfurization unit (FGD). Water however needs to be removed. Complete dehydration of the flue gas will reduce mass flow and prevent corrosion and hydrate precipitation [7].
CO2 recycle Separation Fuel CO 2 to storage 02 1111111 Separation N2 Power ... ... .... .. ... .. .... ... - - : .... ....
The main energy penalty in oxyfuel combustion occurs due to the energy intensive separation of oxygen from air in the air separation unit (ASU). Cryogenic separation is employed to obtain an oxygen stream of 95% purity. At this level of purity, only separation of N2 is needed and the energy requirement is typically around 0.2 kWh/kg 02,
although some recent improvements may be able to reduce the energy requirement to 0.16 kWh/kg 02 [8-9]. If the noble gases are removed in the ASU, then there will be less treatment of the flue gases required since the flue gas has to be stripped of the noble gases before storage. However, for energy efficiency of the plant, the production of 95% purity 02 stream in the ASU has been found to be the optimum. The largest ASU in operation today produces around 5000 tonnes 02 per day which is suitable for a 300 MWe coal fired boiler with flue gas recycle.
Table 1-2 presents the energy required to generate the amount of oxygen required for combustion of different fuels.
Table 1-2: Energy requirement to from [10])
produce 02 for combustion of different fuels. (Adapted
Fuel Specific CO2 Oxygen required for Energy required
emission combustion to generate 02 (at
0.20 kWh/kg 02)
kg kg kg 02/kg kg 02/kg kg kWh/kg CO2
C0
2/kg C02/MJ CO2 fuel 02/MJfuel fuel fuel
(LHV) 100%C 3.7 0.108 0.726 2.67 0.79 0.145 Hard 2.9-3.4 0.09-0.1 0.75- 2.4-3.0 0.076- 0.15-0.184 coal 0.92 0.11 Lignite 2.3-2.6 0.09-0.1 0.75- 1.3-1.9 0.03- 0.15-0.17 0.85 0.04 Natural 2.1-2.9 0.05- 1.46- 3.1-4.4 0.08- 0.292-0.308 gas 0.06 1.54 0.095 ... .. ... ... .
Appendix B presents a discussion of the cycles to integrate oxyfuel combustion with power production. One of the methods is through the use of a boiler and a steam cycle. To achieve this, boiler modifications are required with some redesign of the burner system. The air inleakage needs to be minimized and a recycle line needs to be provided for recycling flue gas to moderate the boiler temperature. In the case of natural gas, oxygen and natural gas can be sent to a gas turbine for combustion and power generation However, for this to be implemented there needs to be commercialization of a gas turbine operating on CO2 as the main working fluid.
A feature of oxyfuel combustion systems is that during start-up, air firing may be necessary so that sufficient recycle of the flue gas is established before oxygen firing is initiated. This necessitates the equipment for air firing and additional controls. The control of these systems is not yet well understood. In order, to evaluate the operability and reliability of these systems, large scale demonstration units need to be commissioned.
1.2.3
Chemical looping combustion
Chemical looping combustion (CLC) is an indirect combustion system that avoids the direct contact of fuel with the oxidant. Oxygen is transferred to the fuel via a solid oxygen carrier. The combustion system is split into two reactors. In the reduction reactor (also called the fuel reactor), the fuel reduces the solid oxide material which is then transported to the oxidation reactor where the reduced metal oxide is oxidized with air. A schematic of a CLC system is shown in Figure 1-7.
Depleted Air Combustion Products C02, H20
Air Fuel
02, N2 CnHm
Figure 1-7: Schematic of chemical looping combustion. Adapted from [11]
The reaction scheme is shown below: The reduction reaction in the fuel reactor is:
CH 2, + (2n + m)MO, -> (2n + m)MO _, + nCO2 + mH20
The oxidation reaction in the air reactor is:
(2n + m)MO,1 + n +-)02 -> (2n + m)MO,
2
(1-1)
(1-2) The overall reaction is:
C H, + n + -)0 2 -> nCO2 +mH 20 (1-3)
The overall reaction (1-3) is the equivalent of the combustion of the fuel. (1-1) is usually endothermic while (1-2) is exothermic. Hence, there needs to be transfer of heat from the oxidation reactor to the fuel reactor through the solid oxide particles. However, when
CuO is used as the oxygen carrier, (1-1) is exothermic [12].
The flue gases from the reduction reactor consist mainly of CO2 and H20 and a pure
into the power cycle either via a steam boiler or via a C0 2/H20 turbine. Figure 1-8 shows
a schematic of the integration of the CLC system with the power cycle.
~o Pesuirzed RED CO2 to air compresson I bar ibAir
Figure 1-8: Schematic of chemical looping combustion system integrated with a power cycle. Adapted from [13].
The oxygen depleted air in the oxidation reactor contains sensible heat due to the exothermic oxidation reaction. This stream is also integrated into the power cycle.
Appendix C presents more details on chemical looping combustion and reforming.
1.2.4
Precombustion capture
In precombustion capture, the carbon content of the fuel is reduced prior to combustion, so that upon combustion, a stream of pure CO2 is produced. Precombustion decarbonization can be used to produce hydrogen or generate electricity or both. Figure
1-9 presents a schematic of precombustion decarbonization [2].
Figure 1-9: Schematic of precombustion decarbonization. Adapted from [2]
A synthesis gas is produced in the first step of precombustion decarbonization. If natural gas is used as a fuel, this is obtained by either steam reforming or autothermal reforming. If coal is used as the fuel, synthesis gas is obtained by gasification. In the next step, the synthesis gas is subjected to the water gas shift reaction to produce carbon dioxide and hydrogen. The hydrogen and carbon dioxide can be separated by pressure swing adsorption or physical absorption and the pure CO2 stream is compressed and sent for
storage. When pressure swing adsorption is used to produce a pure stream of CO2 and
another pure stream of H2, an additional step is needed for CO2 purification before the H2
purification. The hydrogen stream is either used as a feedstock for a chemical process or is burnt to produce electricity.
1.2.4.1 Steam reforming
Natural gas can be steam reformed and then subjected to water gas shift reaction to produce a mixture consisting mainly of carbon dioxide and hydrogen. The reactions in steam reforming are outlined below:
CH4 + H20 + heat -> CO + 3H2 (1-4) CO+ H20 c> CO2
+
H2 (1-5) CO2 to Fuel storage rto Exhaustgases Oxidant Power .. . ... ... . ... . ... .... ... ...Steam reforming is endothermic and hence, some of the natural gas has to be used for firing in the reformer furnace to provide the heat required for the reforming reaction. This can lead to significant exergy losses in the process. Since there is a more concentrated stream of CO2 available, the energy penalty for absorption is not as high. The CO2 can
also be separated by pressure swing adsorption. However, the water gas shift reaction also requires steam to be withdrawn from the power cycle. Hence, this process is advantageous only if the energy savings made from capturing a purer stream of CO2 are
greater than the exergy losses due to loss of natural gas used for firing and loss of steam from the steam cycle for the shift reaction. If a CO2 free process is desired, it is necessary
to use the produced hydrogen for firing in the reformer, and this would lead to even higher exergy losses. The PSA offgas can be used for firing in the reformer with the natural gas or hydrogen.
1.2.4.2 Autothermal reforming
Autothermal reforming is a combination of steam reforming and partial oxidation. Since the partial oxidation reaction is exothermic, it provides the energy required for the endothermic steam reforming and only minimal firing of additional natural gas as fuel is required. The reactions in autothermal reforming are given below. The autothermal reforming is the third reaction -(1-8)- and it is the sum of the first two reactions - (1-6) and(1-7). m n C,,H,+ 02mCO+-H 2 (1-6) 2 2 n n n -H 2 +-02
<
-H20 (1-7) 2 4 2 2m+n n C,H, + O2 mCO +- H20 (1-8) 4 2Pressurized NG
Figure 1-10: Flowsheet of autothermal reforming process. Adapted from [13]
After reforming and water gas shift reaction, the carbon dioxide is separated from the hydrogen and the nitrogen by absorption or by PSA. The hydrogen and nitrogen are then sent to a gas turbine for firing. Modem gas turbines with the low NOx design cannot accommodate a fuel with hydrogen percentage much higher than 50%. Autothermal reforming rather than steam reforming provides a fuel which can meet this specification. The main exergy loss in this scenario as compared to the conventional CC is due to the loss in the fuel heating value. It is expected that 20-25% of the energy of the fuel is dissipated irreversibly in the conversion of natural gas to hydrogen [14]. Methane is not completely reformed in the reformer. A typical conversion is 90% [8]. Some of the fuel has to be used for supplementary firing in the steam generator and some steam is also consumed in the water gas shift reaction. The gas from the reformer has to be compressed before it goes to the gas turbine and this leads to losses as well.
In this process, the capture of CO2 takes place at the same pressure as in the turbine. Hence, the stripping does not consume too much energy because of the pressure differential between the absorber and the stripper. When a lower pressure in the stripper is used, there is enough heat available from the cooling of the products from the water
37
gas shift reactor for the stripping process [8]. An optimization can be performed by not fuily releasing the pressure in the stripper, thus saving on compression costs of CO2 in the
end.
A fuel containing more than 50% hydrogen may not be very well suited for a gas turbine with modem low NOx combustors. Hence, combustion issues need to be addressed. This is one of the major developmental issues before this technology can be demonstrated at a large scale.
1.2.4.3 Integrated Gasification Combined Cycle (IGCC)
If coal is to be integrated into a gas turbine cycle, it is necessary that it first be gasified to produce coal gas that can be combusted in a gas turbine. If CO2 capture is desired, it is preferable to use 02 blown systems at high pressures since this leads to higher CO2 partial
pressures. A flowsheet of an IGCC process with CO2capture is shown in Figure 1-11.
Figure 1-11: Block diagram of IGCC power plant. Adapted from [151
The gasifier output contains syngas, CO2 and impurities such as N2, H2S, COS, HCN, NH3 and trace amounts of Hg which must be treated appropriately [2]. The syngas is
treated for removal of ash and particulates and then subjected to water gas shift to produce carbon dioxide and hydrogen. There will also be contamination due to H2S. This is treated and the gas is then sent for CO2 capture. Since the CO2 is at a relatively high
pressure, it can be easily captured by a physical absorption process which is less energy intensive. Usually, H2S is removed in one physical absorption unit followed by recovery
of CO2 in the next one [16]. The recovered H2S is then sent to a Claus plant for reduction
to elemental sulfur and tail gas clean-up. Recovered CO2 is compressed and sent for
storage. Hydrogen is then sent for combustion in the gas turbine and for power generation. In addition, power is generated from the steam cycle that utilizes the steam obtained from syngas cooling.
Sour gas shift is preferred to clean gas shift as far as exergy considerations are concerned due to the loss of steam in the gas cleanup process. This steam is utilized in the shift reaction. There can be some degree of integration between the ASU and the gas turbine
with the ASU being fed by the exhaust from the gas turbine and the ASU supplying medium pressure N2 to the gas turbine [15]. However, this may lead to problems in the startup of the plant. In addition, the gas turbine has to run only on hydrogen as the fuel. Such a gas turbine is not yet fully developed. GE supplies gas turbines where the maximum percentage of hydrogen should not exceed 65% [17]. This means that some amount of CO has to be left in the fuel entering the gas turbine limiting the maximum degree of capture to 85%. The hydrogen will be diluted with N2 by-product from the
ASU.
IGCC is a significantly more expensive technology than pulverized combustion for power generation because of all the capital costs involved. The performance however varies with the coal type. IGCC does not have the impetus for development due to the competition from efficient NGCC plants when the natural gas prices are stable. However, IGCC offers us a way to obtain electricity and syngas - an essential building block for the chemical industry - from coal. Due to the complexity of the system, IGCC plants are yet to demonstrate sufficient availability [6]. An IGCC plant incorporating CO2 capture is yet
1.3 Current status of CO
2capture technology
While there are a number of possible routes for carbon dioxide capture from power plants, a number of them are still in the developmental stage. All these technologies need to be evaluated when choosing the best one to incorporate in a power plant to be built in the future. However, the only immediately realizable capture technology for flue gases from power plants appears to be chemical absorption.
It is expected that in the near future, if oxyfuel combustion is employed, it will only be in a power boiler with an integrated steam cycle. A conceptual process flowsheet for a pulverized coal steam boiler operating on a supercritical steam cycle with CO2 capture has been developed [19]. It has been found that the overall thermal efficiency on a LHV basis is reduced from 44.2% to 35.4%. For oxyfuel combustion to be incorporated, some modifications to the burner design are required. In addition, lines for recirculation of the CO2 need to be provided. One of the other challenges is the lower purity of CO2 produced
in oxyfuel combustion. For the production of ultra-pure CO2 (matching that produced in
an amine absorption process), additional distillation steps would have to be added after the inert gas removal steps [20]. In order to understand the issues associated with the operability, startup and shutdown of these systems, demonstration plants employing oxyfuel combustion in boilers have to be commissioned. Recently, Vattenfall commissioned a 30MWth pilot plant facility for a detailed testing of the oxyfuel firing facility [21]. Design of new plants operating on a supercritical steam cycle can be considered since these plants inherently have a higher efficiency. For oxyfuel combustion to be incorporated in gas turbines, it is necessary that the technical and operational feasibility of turbines capable of operating on CO2 as the main working fluid be demonstrated. A critical technology that needs to be improved for oxyfuel combustion to be more efficient is the air separation unit. Current cryogenic air separation plants are showing improvement in efficiency due to improved compressor efficiencies and larger scale plants [2]. It is necessary to optimize this further. Ion transport membranes which may offer more efficient separation of 02 from air are presently under development [22].
Chemical looping combustion systems are a relatively new technology and are still in the development and pilot plant stage. In chemical looping systems, the research focus needs to be on developing better attrition resistant metal oxide carriers which have other desirable characteristics such as high rate of reaction. The thermal stability of these particles needs to be enhanced and their integrity in pressurized environments needs to be preserved if chemical looping systems are to be integrated efficiently with gas turbine power generation cycles. In addition, the compatibility of chemical looping systems with coal needs to be explored.
Gasification systems represent an attractive option since they allow us to obtain syngas and electricity from coal. However, the capital cost of the equipment is very high. The complexity of the system makes it difficult to operate and hence, the availability of these systems cannot be guaranteed. To date, there have been only a handful of demonstration power projects using IGCC. There is scope for more development work on gas turbines with low NOx combustors utilizing fuels containing more than 50% hydrogen. In addition, IGCC power plants with carbon capture are yet to be demonstrated. Producing hydrogen from natural gas for electricity production leads to a loss of around 20-25% of the fuel heating value. A point to be noted is that for coal to be integrated into a combined cycle, it is necessary to gasify it. However, this is not the case for gas. Hence, any technology employing gasification of natural gas for the purpose of carbon capture will appear to have an even more pronounced energy penalty. Hence, gasification of coal to produce electricity is the more feasible option. Full-scale implantation of coal gasification plants incorporating carbon dioxide capture is expected only in the medium to long time frame.
Chemical absorption systems seem to represent the best near-term option for CO2 capture
from power plants. There is commercial experience with operating these systems, albeit at a much smaller scale than required for power plants. A list of commercially available technologies for chemical absorption of CO2 is presented in Table 1-3. In addition, HTC
Purenergy and Aker Clean Carrbonin Norway have offered commercial packages with HTC Purenergy's process being based on mixed amines [23].
![Figure 3-1: Schematic of CO 2 capture by use of MEA solvent (Adapted from [7])](https://thumb-eu.123doks.com/thumbv2/123doknet/14199812.479769/69.918.121.739.115.496/figure-schematic-capture-use-mea-solvent-adapted.webp)