Back-End Design and Development of a Energy
Systems Analysis Tool
by
Sapna Kumari
B.S. Electrical Engineering and Computer Science
Massachusetts Institute of Technology, 2019
Submitted to the Department of Electrical Engineering and Computer
Science
in partial fulfillment of the requirements for the degree of
Master of Engineering in Electrical Engineering and Computer Science
at the
MASSACHUSETTS INSTITUTE OF TECHNOLOGY
September 2020
c
○ Massachusetts Institute of Technology 2020. All rights reserved.
Author . . . .
Department of Electrical Engineering and Computer Science
August 30, 2020
Certified by . . . .
Emre Gencer
Research Scientist
Thesis Supervisor
Accepted by . . . .
Katrina LaCurts
Chair, Master of Engineering Thesis Committee
Back-End Design and Development of a Energy Systems
Analysis Tool
by
Sapna Kumari
Submitted to the Department of Electrical Engineering and Computer Science on August 30, 2020, in partial fulfillment of the
requirements for the degree of
Master of Engineering in Electrical Engineering and Computer Science
Abstract
Sustainable Energy System Analysis Modeling Environment (SESAME) is a modu-lar analytic environment designed for supporting various pathway-level and system-level analyses [1]. Pathway, in this context, refers to life cycle stages of a particular product from raw material extraction to production to its final end use. Pathway-level analysis include two main analysis types i.e Life Cycle Assessment(LCA) and Techno-Economic Assessment (TEA). LCA analysis calculates greenhouse gas (GHG) emissions associated with each of the various life cycle stages whereas TEA analysis calculates combined costs associated with the product or process through its life cycle. The high-level goal of the framework is to allow users to assess the sensitivity of key technological, operational and geographical parameters associated with various energy pathways as measured by the GHG emissions (through LCA) and techno-economic costs (through TEA).
In this thesis, we present the back-end design and implementation of the SESAME web application that allows users to conduct pathway-level analyses for various energy pathways. The key contribution of our web-based framework is that it supports easy integration of new LCA and/or TEA models and data sources in the backend so they can be made easily available to users for analysis via the front-end web interface. We achieve this by creating a Python-based library of classes and functions that model a higher-level code-based representation of LCA and TEA pathways. Our tool is designed to capture the inherent modularity of SESAME, which again makes it easier for people who wish to add either new pathways or new data models and sources for existing pathways to our platform.
Thesis Supervisor: Emre Gencer Title: Research Scientist
Acknowledgments
I would like to thank my thesis advisor, Emre Gencer, for providing me with the opportunity to work on such a great project. Working on this project has been a
great experience as I have learnt so much about a completely new field and have also been able to make good use, I hope, of my Computer Science knowledge and
skills. I would also like to thank Scott, the contract back-end developer in the team, for always making my code look so professional and giving me useful suggestions for
improving the design aspects of my code.
It has been especially fun working with the postdocs Tapajyoti Gosh and Srujana
Goteti who explained to me all the energy/chemical engineering related terms and concepts. They were both wonderful mentors as well as teammates, and I will miss
Contents
1 Introduction 8
1.1 Back-end Design Goals . . . 9
1.2 Contributions . . . 9 2 Background 11 2.1 Pathway-Level Analysis . . . 11 2.1.1 Pathway Model . . . 11 2.1.2 Types of Analysis . . . 13 3 Approach 16 3.1 LCA Pathway Metadata . . . 17
3.2 TEA Pathway Metadata . . . 17
3.3 Web Framework Interface . . . 17
3.4 SESAME Data Model and Format . . . 19
3.4.1 Flow Attributes for Activity Lookup Table . . . 20
3.5 LCA Calculations, Results and Plotting . . . 21
3.5.1 LCA calculations . . . 21
3.5.2 LCA Pathway Results and Plotting . . . 24
4 Pathway Representation via Python Classes 27 4.1 LCA Pathway Classes . . . 27
4.1.1 Metadata . . . 28
4.1.3 Activity . . . 29
4.1.4 Source . . . 29
4.1.5 Activity-Source Classes . . . 30
4.2 User Input Classes . . . 31
4.2.1 Input Class . . . 32
4.2.2 Input Subclass . . . 33
5 Future Work & Conclusion 35 A Code Samples 37 A.1 Example LCA Pathway - Natural Gas to Electricity . . . 37
List of Figures
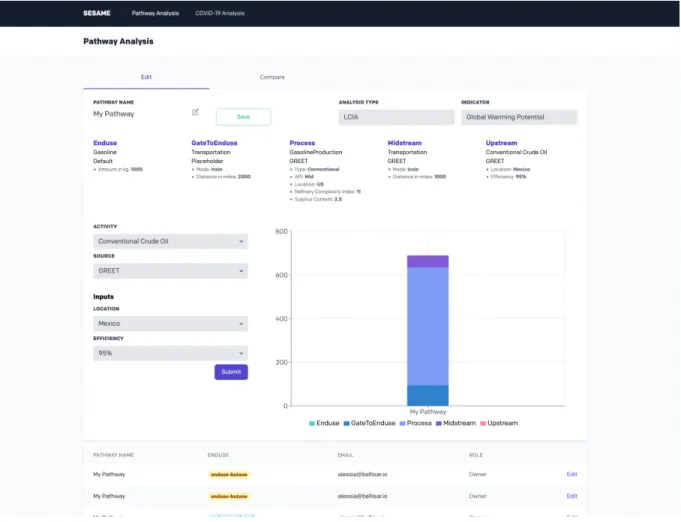
3-1 Front-end Web Interface . . . 18
3-2 Example Lookup Table For Natural Gas Power Production Activity . 20 3-3 Example Calculation Flow For Natural Gas-Electricity Pathway . . . 24
3-4 LCA GHG Emissions Plot . . . 26
4-1 Pathway Entity-Relations Diagram . . . 27
4-2 Activity Source Class Model . . . 31
List of Tables
Chapter 1
Introduction
SESAME (Sustainable Energy System Analysis Modeling Environment) is a novel modular framework designed for supporting pathway-level and a system-level analysis
[1]. Pathway, in this context, refers to life cycle stages of a particular product from raw material extraction to production to its final end use. Pathway-level analysis
is subdivided into into main analysis types i.e Life Cycle Assessment(LCA) [2] and Techno-Economic Assessment (TEA). LCA analysis calculates greenhouse gas (GHG)
emissions associated with each of the various life cycle stages whereas TEA analysis calculates combined costs associated with the product or process through its life
cycle. Systems-level analysis models the emissions associated with large-scale energy sectors such as power grid or a fleet sector. The goal of both these analyses types
in SESAME is to allow users to explore the variations in emissions and costs arising from the different technological, operational, and geospatial parameters selected by
the user for conducting the analysis.
The data and model for conducting LCA and TEA pathway analysis in SESAME
are collected from various environmental agencies and organizations working across
different energy sectors. For TEA analysis, we rely on ATB tool and data [3] developed by National Renewable Energy Laboratory (NREL). For LCA analysis, we rely on
data from two main sources i.e. GREET Excel model [4] built by Argonne National Laboratory and ASPEN Plus modelling software. For electric power system data, we
Agency. In some cases, two or more data sources, with different modelling parameters and assumptions, are available for the same pathway stage, and we allow users to
choose from different data sources for performing the analysis. Because we rely on a wide variety of models and data sources for analysing different pathways, the key
aspect of our backend system design is to ensure its flexibility to incorporating new pathway models.
While the scope of SESAME backend design includes both pathway-level and system-level analysis, we focus our attention on describing only the pathway analysis
model design and implementation in Python since most of my contributions in this project fall under that.
1.1
Back-end Design Goals
One of the most important goals of SESAME system design is that it should be capable of supporting a large variety of pathways for analysis each with potentially
different data sources and models. Another goal is that the system design should be modular enough to allow addition of new pathways without adding too much overhead
in terms of repeated functions and scripts across various pathways. The third goal is that the code design be intuitive and understandable for anyone working on creating
and adding new pathway models.
1.2
Contributions
In this thesis, we present the back-end design and implementation of a web framework
tool that allows users to perform various kinds of pathway-level analyses. Our web-based framework, developed in Python, is designed to capture the inherent modularity
of SESAME tool. Our key contribution is the creation of a Python-based library of classes and functions to model a higher-level code-based representation of LCA
and TEA pathways. This will allow the people working on building new energy pathway models to easily incorporate their pathways into the web framework using
this library. Another contribution is defining a standard format for storage of model data for most effective ways to perform analytic calculations. A final contribution is
the creation of useful HTTP end-points, abstracting away the analytic computations and programming-based back-end so that the front-end developer can easily use those
Chapter 2
Background
In this chapter, we give a detailed overview of SESAME pathway analysis model.
2.1
Pathway-Level Analysis
2.1.1
Pathway Model
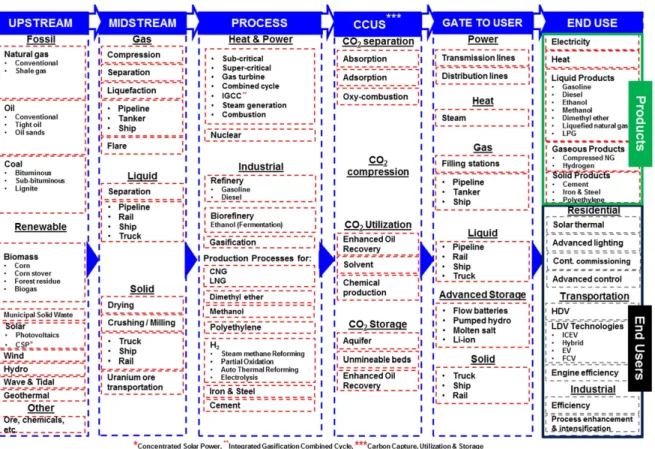
In SESAME model, a set of five key life-cycle stages consisting of Enduse,
Gate-To-User, Process, Midstream, Upstream are linked together in a directed sequential manner to make up a pathway. Each stage contains one or more activities where each
activity is characterized by an input flow, output flow and emissions flow. The stages and the links between them are described in detail below:
1. End-use stage represents the end use of product or energy pathway, for exam-ple, electricity is an end use activity of coal-to-electricity pathway, and gasoline
fuel burning is the end use activity of crude-to-gasoline pathway. End use may be grouped into categories where each category comprises of one or more
end-use activities. The end end-use categories modelled in SESAME include electricity,
heating, fuels, chemicals etc. where fuels category includes burning of gasoline, diesel or liquefied petroleum gas as specific end use activities.
2. Gate-to-user stage represents the transportation/transmission of the product
use, there may be one or more gate to user activities. For example, if the end use is electricity, then the only possible gate to user is transmission lines. However,
if the end use is diesel, then the possible gate to user could be a transportation through pipeline, barge or an ocean tanker or some mix of these transportation
modes.
3. Process stage is one of the key step life cycle pathway which represents the production processes for chemicals and fuels, industrial refinery processes as
well as power generation processes. Depending on the gate to user activities which depends on end use, there may be one or more process activities. For
example, if the gate to user is transmission with electricity as end use, then the process activities include various power production methods such as natural
gas, coal, wind or solar etc. If the gate to user is diesel transportation with diesel fuel as end use, then the associated process activity is crude oil o diesel
refinery process.
4. Midstream stage represents the transportation of energy feedstocks such as natural gas or crude oil to the process stage. Because the feedstock for some
renewable energy processes such as wind for wind power or solar intensity for solar power are always present at the production site, the midstream activity
may be skipped in some pathways. Thus, depending on the process activity which depends on gate to user and end use, there may be zero or more midstream
activities. For example, if the process activity is diesel production through crude oil, then the associated midstream activity is crude oil transportation where as
if the process activity is wind power production, there is associated midstream activity.
5. Upstream stage is another key step in a life cycle pathway that represents extraction and production of feedstock, raw minerals, and chemicals that are
necessary for subsequent production processes. The feedstock could be fossil-based or renewable-fossil-based. Fossil feedstocks include natural gas, crude oil, and
on either midstream or process stage which depend on subsequent stages, there may be only one upstream activity possible.
2.1.2
Types of Analysis
In SESAME framework, users must choose among three types of analysis available to them: LCA, TEA or LCA with TEA.
Life-Cycle Assessment - LCA
LCA is a well-known analysis technique for assessing the environmental impacts of a particular product through its life-cycle stages. In context of SESAME model, LCA
is one of the main analysis types applied on a pathway which quantifies the input, output and emission flow of activities in each of the five stages in a pathway. To
conduct LCA, the user specifies the activity and input parameters associated with the activity for each of the stages starting from end use all the way up to upstream.
Once the pathway is fully specified by the user, the LCA calculations are performed in the order specified by the links between the various stage activities. For example,
if an end use activity is linked with a certain gate to user activity, then the input flow of end use activity is same as the output flow of the gate to user activity. Likewise, if
a gate to user activity is linked with a process activity, then the input flow of gate to user activity is same as output flow of the process activity, and so on. The links form
a backward chain because in reality, the product life cycle starts at upstream and ends with an end use, whereas we require user to specify the life cycle in the reverse order
because we imagine that to be most common use case scenario of our framework. However, since some users may actually find starting pathway from upstream more
intuitive, we do incorporate the bi-directonality feature of the pathway in our backend design.
The most salient aspect of LCA analysis is calculation of greenhouse gas emission flows by each stage of a life cycle. Given certain technological, operational and/or
the total emission flows per unit of generated output flow for each stage activity.
Techno-Economic Assessment - TEA
Traditionally, TEA is an analysis framework for assessing the economic costs
associ-ated with a particular product or activity. In context of SESAME, TEA is another analysis type applied to a pathway which quantifies the various costs associated with
certain key life-cycle stages of a product. In particular, TEA captures the costs as-sociated with upstream, process and end use stage activities of a pathway. However,
since there is no data available for computing costs by life cycle stage, we do not follow the stage links and input-output flow model of a typical pathway to conduct
TEA. Instead, we develop an independent TEA model for each of the pathway de-fined by its end use, process and upstream activity. An example TEA pathway is
wind-power-electricity pathway where wind is upstream, power is the process and electricity is the end use.
The most salient aspect of TEA analysis is calculation of capital, fixed, operational and maintenance costs associated with the pathway activities. It requires its own
set of user inputs, which include both technological, operational and geographical parameters associated with the pathway activities as well as finance parameters, to
compute costs per unit of generated output flow for end use activity. For wind-power-electricity pathway, the input parameters may include the technological parameters
such as hub height, operational parameter such as wind speed and finance parameters such as construction costs etc. and the TEA model will calculate all cost components
per unit of electricity.
LCA with TEA
One of the key distinguishing feature of a SESAME framework is that it allows the
users to evaluate the emissions and costs trade-off of their choice of input parameters by giving them the flexibility to conduct both LCA and TEA together. Traditionally,
LCA and TEA for energy products are always performed separately since the two techniques follow different modelling approaches. Unlike LCA, TEA methodology
does not break down the costs by life cycle stages but rather by cost categories. Despite this difference, there exist some important input knobs in any pathway that
are shared in both LCA and TEA models and tuning of those knobs forms the basis for evaluating the emissions and costs trade-offs. For example, the type of gas turbine
in natural gas power production is an important knob in both LCA as well as TEA calculations.
Chapter 3
Approach
Our framework needs to support three main analysis types i.e LCA, TEA and LCA combined with TEA. Because the modelling approach is quite different for LCA and
TEA, as discussed in 2.1, we design two separate metadata objects, one for LCA pathways and one for TEA pathways. Metadata object for LCA pathways is quite
intricate since we don’t simply design a separate model for every pathway; instead we design models for individual activities which are connected together to make up a
pathway. This is because same activity may be shared across many different pathways and encoding the activity as part of a whole pathway instead of as a separate unit
will lead to lot of overhead in terms of repeated code and functions. For instance, upstream crude oil extraction activity has several different end uses activities such as
gasoline, diesel, LPG etc, thus making up many different energy pathways.
On the other hand, metadata object for TEA is simple since we do associate a
single TEA model with pathway as a whole. This is because multiple LCA pathways may share the same TEA model as TEA calculations are sensitive to factors affecting
only few key stage activities such as end use and process. Thus, we do not have to
design new TEA model for every LCA pathway, leading to less overhead in terms of code clutter.
3.1
LCA Pathway Metadata
The pathway metadata object for LCA analysis is a nested JSON data structure [5] that encapsulates all pathways available for LCA analysis in SESAME. The first
layer comprises of life-cycle stages with second layer storing the activities in the stages and the third layer containing reference to the actual data source models
within the activities that conduct LCA flow calculations. A new pathway for LCA analysis can easily be added to the SESAME framework by first implementing the
new activity data source models and then adding all the relevant information about the implemented classes in the metadata object.
The Python library interface for adding new pathway metadata to the global metadata object is described in further detail in chapter 4.
3.2
TEA Pathway Metadata
For every pathway available to LCA analysis, we build the corresponding TEA model as well, so the combined analysis is defined for all pathways. TEA metadata object
is simply a one-layer JSON data structure that contains the reference to the TEA model class and the lookup table by the pathway name and id. Each TEA model
class specifies the user inputs that will need to be collected for a given pathway and performs the cost calculations using both the collected user input values and data
stored in various cost-specific data tables.
Pathway id used in TEA metadata object is specially constructed by concatenating
the ids of three LCA activities i.e. enduse activity, process activity and upstream activity. Constructing pathway id this way allows for the linking of LCA pathways
with TEA pathway models, so the combined analysis can be conducted.
3.3
Web Framework Interface
At a high level, the SESAME web interface for pathway-level analysis is designed as follows:
1. For LCA analysis module, the front-end interface fetches the LCA pathway metadata object via an HTTP endpoint, and uses the object to dynamically
collect the user inputs for all pathway stages starting from end use. The stor-age of activity links in the metadata object guides the appropriate user input
collection for each subsequent stage based on the user activity selection in pre-vious stage.
2. Likewise, for TEA analysis module, the front-end fetches the TEA metadata object via a separate HTTP endpoint. The input collection is simple for TEA
as the user first selects a pathway and then specifies values for all the necessary user inputs associated with that pathway.
3. For LCA-TEA module, both LCA and TEA metadata are wrapped in one object
to be sent to front-end for input collection. After the LCA pathway is specified
by the user, the associated TEA model is automatically selected first from the TEA metadata via pathway id reference mentioned in section 3.2, and then the
TEA-specific user inputs are collected.
4. The front-end posts the pathway analysis response object to back-end which contains the user input values for a pathway for a particular analysis type.
The backend then performs the analysis on either LCA, TEA model or both by calling relevant models specified in the metadata objects for the pathway
specified by user. Back-end returns the analysis results object back with either emissions data or costs data or both depending on the analysis type.
5. The front-end uses a graphing library to display the relevant emissions/costs plot sent in the analysis results object.
3.4
SESAME Data Model and Format
One of the most important features of SESAME framework is that it supports addition
defining of standard data flow model and data formats for implementation. This standard data model is based on openLCA [6] structure where activities and flows
are the building blocks of the LCA. Any product pathway can be viewed through a lens of individual activities where each activity is characterized by an input, output
and emission flow, and where the output flow of one activity is fed as an input flow to the next activity, thus making a pathway. All flows are defined by name, value,
unit, direction and type attributes.
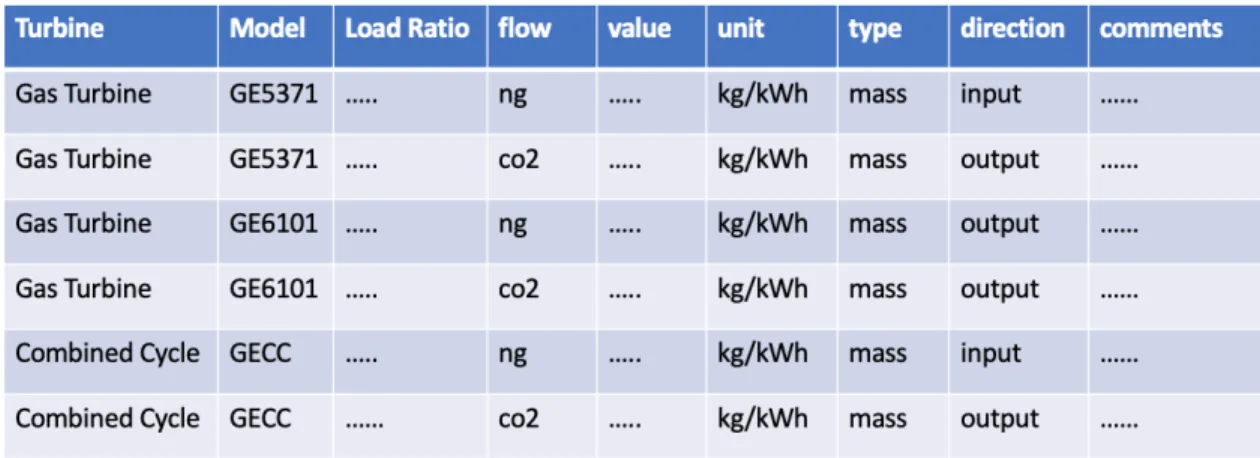
If any activity source model relies on categorical input parameters, we create
lookup tables of the format shown in Figure 3-2. We choose to capitalize columns that define user inputs, and the rest of columns specify flow attributes. For natural
gas production activity, if the user specifies the turbine type, model and load ratio (capitalized columns), then the associated input or output flows can be read from the
lookup table.
Figure 3-2: Example Lookup Table For Natural Gas Power Production Activity
3.4.1
Flow Attributes for Activity Lookup Table
While the specific user input columns vary across different lookup tables, the following flow attributes are shared across all lookup tables for any pathway activity.
1. flow refers to the fluid, gas, or a form of energy that constitutes the flow to
coal, methanol or any gas emission such as carbon dioxide (co2), methane (ch4), sulphur dioxide (so2) and so on.
2. type refers to flow type which can be either mass or energy. In SESAME, mass flows are always specified in terms of units of kilograms (kg) whereas
energy flows are specified in units of kilowatt-hour (kWh) for electricity flow or megajoules (MJ) for all other energy flows.
3. value refers to the amount of incoming or outgoing flow in units specified in
unit column.
4. unit is the unit of the flow value specified in the value column. The unit is
always expressed as a fractional unit where the numerator represents the unit of the flow specified in flow column and the denominator denotes the unit of
output flow for the activity. For instance, the output flow for natural gas power production activity is electricity, so all the units in the look up table for natural
gas power activity would be in terms of kWh of electricity generated.
5. direction refers to the flow direction which can be either input or output. Here,
the direction for emission flows is considered to be output direction.
3.5
LCA Calculations, Results and Plotting
3.5.1
LCA calculations
LCA calculations involve computing input, output and emission flows for all activities
selected by the user at each stage level. Regardless of the direction in which the user inputs are collected, whether it is from upstream to end use or from enduse
to upstream, we choose to perform LCA calculations in one order on the back-end i.e. from enduse to upstream. The order matters because the activities between
two different stages are linked by a shared input-output flow, and which flow type is passed from one activity to another differs. If the starting point is enduse, then the
the activity in current stage. That is to say, the output flow of midstream activity is fixed once the input flow of process activity is computed, and so on. However, if the
starting point is upstream, then the input flows of the activities in subsequent stages are determined by the output flows of the current stage. That is to say, the input
flow of process activity is fixed once the midstream output flow is computed, and so on.
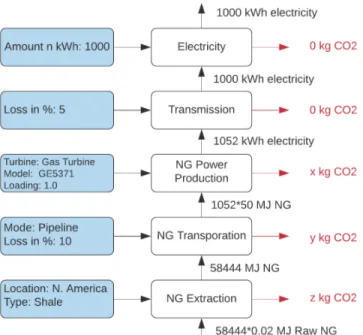
In the Figure 3-3, we illustrate the LCA calculation flow model from enduse activ-ity to upstream activactiv-ity for natural gas to electricactiv-ity pathway. User inputs collected
for each stage activity are shown in blue on the left and the amount of carbon dioxide emissions computed are shown in red on the right. The arrows going from one activity
to another denote the shared input-output flows between the two activities.
User first selects electricity as the enduse activity, and specifies the amount of
elec-tricity consumed in kWh. Then, the amount of elecelec-tricity entered by user constitutes the output flow of the electricity activity. Because electricity consumption doesn’t
involve any conversion process, the emissions are zero, and input flow is the same as the output flow. For end use activities such as gasoline fuel, their consumption
involves fuel burning, and thus the emissions would be non-zero, even though input flow would still be the amount of fuel specified by the user.
With the enduse activity as electricity, user can only select transmission activity in the gate to user stage, as ensured by our linking of the activities in the pathway
metadata. The output electricity flow of transmission activity is passed from the electricity activity in enduse, and is used to compute the input electricity flow in this
stage. The input flow calculation requires the percentage loss of electricity due to transmission which is given as a user input. In the figure below, 5% transmission loss
with 1000 kWh output electricity flow implies that the amount of input electricity flow must be 1000/(1-0.05) ≈ 1052 kWh. This calculation is performed in the compute
input flow method in Transmission activity source class. again the compute emission flow would return 0, as there is no energy conversion process involved.
With transmission as the gate to user activity, the associated activities in the process stage must include several power production activities such as natural gas,
wind, solar, etc. If the user selects natural gas power production activity, the input flow would be natural gas and the output flow would be electricity. Again, the amount
of output flow would be passed from gate to user transmission activity. In this case, the input flow is computed by using the associated lookup table for natural gas power
production activity as shown in Figure 3-2. The lookup table is first filtered by user specified technical parameters such as turbine type and model. To compute the input
flows, we filter the selected rows by specifying type column to be equal to input, and to compute emission flows, we filter by specifying type column to be equal to output. We
then read in the relevant conversions factors, which, as discussed in 3.4.1, are always specified in terms of unit of input flow used to generate one unit of output flow. In
this case, the primary input flow is natural gas (expressed in units of MJ) , and output flow is electricity; thus, we compute the primary input flow by simply multiplying the
input conversion factor, that is 50 MJ/kWh, with the amount of output flow, that is 1052 kWh. We compute the emission flows in the same manner by multiplying
their conversion factors with electricity output flow. The only difference here is that emission flows are usually expressed in term of mass of gas, thus the output would
be x kg of carbon dioxide, or some other gas.
We follow the similar calculation logic for the remaining two stages, and calculate
the emissions associated with those stages. For some activities, there may be more than input flow. For example, for natural power production activity, water may be
another input flow, and there may be greenhouse gas gas emissions associated with the supply of water to natural gas power plant. Hence, we compute two types of input
flows for each activity i.e one primary input flow and several secondary input flows. It is only the primary input flow that is passed as output flow of the preceding stage
activity. In cases where there are secondary input flows to an activity, the associated conversions factors are also stored in the lookup table. These secondary input flows
may be used for analysing secondary effects of a pathway.
While our approach to LCA calculation works for most external source models
and simulations, there are a few limitations. One main limitation is that, for some external models, the input or emission conversion factors may be quite sensitive to
some continuous parameters, but we may not have access to the equations for how those continuous parameters affect the flow calculations. In that case, we read in
the conversion factors associated with a few of the continuous parameter values, and then use the linear interpolation method to get the appropriate conversion factors for
continuous user input. In the natural gas power production activity, loading ratio is one such continuous parameter that we apply interpolation technique for.
Figure 3-3: Example Calculation Flow For Natural Gas-Electricity Pathway
3.5.2
LCA Pathway Results and Plotting
For each activity, we store the LCA results as a nested JSON object comprising of four key attributes i.e user inputs, input flows, output flows, emission flows. User
inputs store the input values selected by the user for that activity. Each flow object consists of name, unit, and value attributes. Input flows store both a primary flow
object and a list of secondary flow objects. Output flow simply stores a single output flow for each activity. Emission flows stores a list of various greenhouse gas emission
flows. Thus, the whole pathway results object comprises of two attributes i.e stage and the activity results object described above for that stage. The reason we store
user inputs selected for each activity in the results objects so we could display to user what they parameters they selected in each stage. Since we allow users to create and
store multiple pathways, the pathway results returned by LCA analysis function is a dictionary of key value pairs of pathway name and pathway result object.
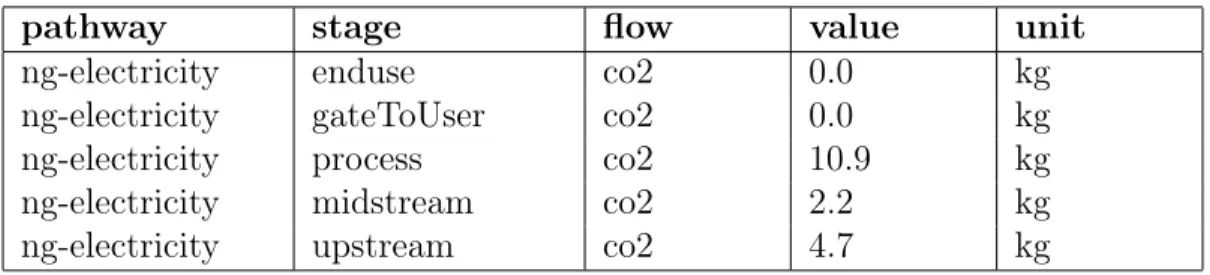
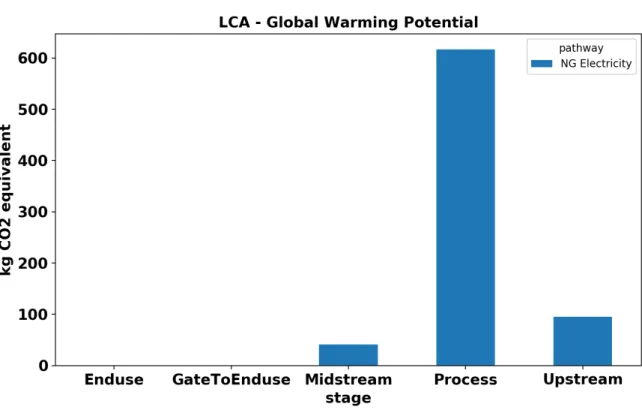
For plotting purposes, we take the final pathway results dictionary and after some processing, convert it to the data frame format shown in Table 3.1. For visualizing
global warming potential effect of a pathway, we take the all gaseous emission flows and convert them all to their equivalent amount in carbon dioxide.
pathway stage flow value unit
ng-electricity enduse co2 0.0 kg
ng-electricity gateToUser co2 0.0 kg
ng-electricity process co2 10.9 kg
ng-electricity midstream co2 2.2 kg
ng-electricity upstream co2 4.7 kg
Table 3.1: Data-Frame format for LCA Pathway Results
The plotting function takes in a a data frame of the format shown in 3.1, and returns a plot like one in 3-4. The data format above can allow users to visualise one
pathway or multiple pathways at the same time depending on whether they group by stage or pathway. For multiple pathways, the plots various stages would be stacked
together in one bar for each pathway. The plot shown in 3-4 displays the greenhouse gas emissions by stage for one pathway.
Chapter 4
Pathway Representation via Python
Classes
We created the following set of hierarchically-related classes that encapsulate the LCA
pathway topology discussed in 4.1.
4.1
LCA Pathway Classes
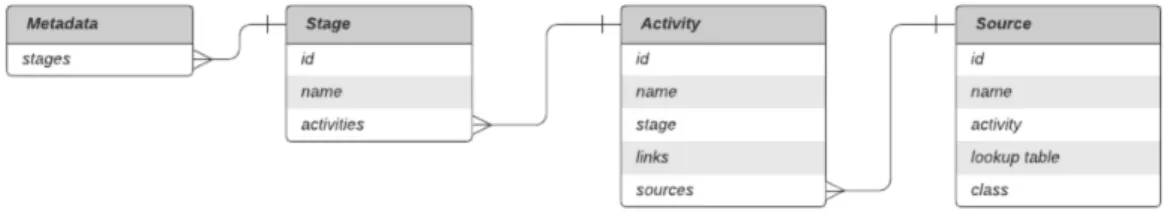
Figure 4-1 shows the hierarchical relationship between the objects described in
sec-tions 4.1.1 through 4.1.4. Metadata is a list of stages where each stage is a list of activities. Each activity is subsequently a list of sources that contains the reference
to actual activity-source class which implements the LCA flow calculations for that activity in that stage.
Figure 4-1: Pathway Entity-Relations Diagram
In implementation of these classes, we make use of the key concepts of
Abstraction means that each object should only expose a high-level mechanism for using it, and hide the implementation details. While we describe the attributes and
methods of all objects below, any user of this library only needs to know the high-level purpose of these methods and not the exact implementation detail. Inheritance
means creating child classes from parent class where child classes can implement their own unique methods in addition to inheriting all the shared methods and common
logic implemented by parent class. We make use of inheritance in creation of a parent ActivitySource class as described in section 4.1.5.
4.1.1
Metadata
A Metadata object represents the set of all pathways defined in SESAME. The meta-data class is initialized with an empty list of stages, and supports two main methods,
i.e. register stage method and get stage method. The register stage method takes as argument a stage name and adds a new stage object, initialized with the name
argument, to the stages list. The get stage method takes as argument a stage name and returns the stage object from the list of stages whose name matches the name
passed as argument.
4.1.2
Stage
A Stage object represents all the activities that belong to a particular life-cycle
as-sessment stage. The stage class is initialized with attributes id, name, and an empty list of activities and supports two main methods i.e register activity method and get
activity method. The register activity method takes as argument an activity name and adds a new activity object, initialized with the name passed as argument, to
the activities list. The get activity method takes as argument an activity name and returns the activity object from the list of activities whose name matches the name
4.1.3
Activity
An Activity object represents a specific life-cycle activity. The Activity class is initial-ized with attributes id, name, stage, empty list of links and an empty list of sources,
and supports three main methods i.e link method, register source method and get source method.
Links denote the set of activities in the next stage that this activity leads to. For instance, for transmission activity, the links would include natural gas power
production activity, wind power production activity and other electricity generation activities since transmission activity in gate to user stage implies the process activities
must be power generation activities. Thus, the link method takes as argument a list of other activities and simply adds it to the list of links.
Source objects denote the set of data source models that determine how the ac-tivity flow calculations will be performed. Initializing each acac-tivity with a list of
source models allows for the flexibility to add more than one source model for any pathway activity. The register source method takes as arguments a source name, the
activity source class and lookup table and adds a new source object, initialized with the variables passed as arguments, to the sources list. The get source method takes
as argument an source name and returns the source object from the list of sources whose name matches the name passed as argument.
4.1.4
Source
A Source object represents the model of flow calculations for a specific activity in a pathway. The Source class constructor takes as arguments the attributes name,
activity, the activity-source class and lookup table where lookup table is optional. The id attribute is initialized as null. The activity-source class is a reference to the
specific class that defines the set of user input parameters and implements the flow calculation methods. The lookup table is an optional table that may be read in the
reference class for calculation purposes. The reason lookup table is an attribute of the source class, and not the associated activity-source class is because it is used to
generate the possible options for categorical inputs to display to the user, and nesting it in the metadata object under sources makes the task easier.
The class supports two main methods i.e instantiate method and find user input method. The find user input method takes as argument an input name and returns
the user input object and the corresponding index from the list of user inputs which are specified in the associated activity-source class. The instantiate method take
as argument the variable number of parameters (using python keyword **kwargs) simply returns the callable activity-source class initialized with the variable number
of parameters.
Sources Database
When a source object is being registered to an activity object, it is also inserted as a
record to a global sources database instance which stores all source records by their ids. The ids are created by concatenating the source name with activity identifier,
thus ensuring their uniqueness. Sources database object is important because once the user interface collects all the user inputs for a particular source id, sources database
is used to find the associated source object. The user inputs value collected are then passed to the corresponding activity-source class which is an attribute of this source
object.
4.1.5
Activity-Source Classes
The Activity-Source objects represent the basic model of flow computation for all
pathway activities. The set of relevant parameters and the exact method of calculation may vary not only between different activities but also between different source models
for same activity. Hence, in our implementation, there is a separate class for every unique activity source model. For example, for natural gas power production activity,
we have two separate source models, one from GREET and one from ASPEN, and thus, we have two classes which take different set of user inputs and calculate flows
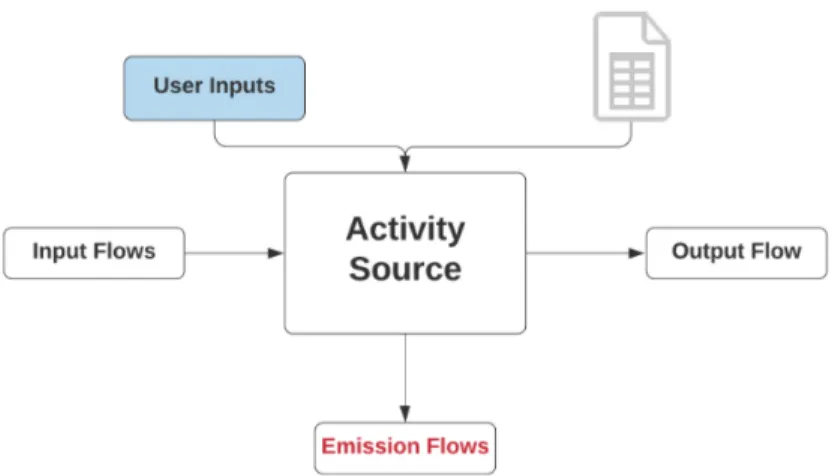
Figure 4-2: Activity Source Class Model
in midstream, and natural gas extraction activity in upstream. However, all activity source classes share the same model i.e they takes as arguments the user inputs, an
optional lookup table and implement three methods which compute three flow types i.e. input, output and emission as shown in Figure 4-2. As illustrated in section 3.5.1,
lookup tables are needed to preform calculations for only some activities and not all; thus they are an optional attribute of the activity source class.
Since most activity source objects share some common attributes and methods, we create a parent class called ActivitySource that implements the common methods.
Creation of such a class helps avoid repeated functions and code through various activity source classes. For example, many of the activity sources classes perform
same filtering operation by categorical user inputs on the associated lookup tables to read the relevant flow values, so the filtering operation can be implemented once
in the parent ActivitySource class, and called in all the child classes to avoid code
redundancy.
4.2
User Input Classes
User inputs are a very important part of our analysis tool. In the user interface, we
let the user specify a range of technological, temporal and geographical variables for each of the analysis type, and once the user inputs are all collected on the front-end,
they are routed to the back-end where they are used in performing the necessary computations.
4.2.1
Input Class
An input class takes a name and label as arguments, and has getter and setter methods for the value attribute. The class takes a set of validators, defaults and conditionals
as optional arguments.
Validators
A validator class takes two arguments i.e a validation function and a varying number of
arguments (*args) that can be passed to the validation function. The class implements a validate method that returns the result of calling the validation function on the
varying number of arguments. We implemented a set of validation functions that throw validation error if value passed by user for a particular input doesn’t lie in
acceptable range of values for that input.
Defaults
The set of inputs required of user before they can see the analysis results can be quite
large especially in case of five-stage LCA analysis. Thus, to take away some burden of specifying all inputs from the user, we put in place a mechanism for specifying
defaults for all input types. A default class takes two arguments i.e a default value and an optional set of conditionals. The set of conditionals may be specified if the
choice of default value for a particular input is dependent on the value of other input variables. For instance, for most transportation activities in midstream and gate to
user stage, the default distance value varies based on the mode of the transportation where both mode and distance are user inputs.
Conditionals
Conditionals are a way of encapsulating the dependency between two different user inputs. For example, input x should only be asked of user if input y takes a certain
value. Like validator class, the conditional class also takes as arguments a conditional function and variable number of arguments that may be passed to the function.
Conditional function returns true if the condition specified by the function holds true for a select user input.
4.2.2
Input Subclass
Based on our system needs, we defined three different sub-classes of input class in the back-end which include continuous, categorical and options.
1. Continuous: Continuous inputs represent input variables that take continuous numerical values such as turbine efficiency, plant lifetime or solar power
inten-sity. In our implementation, continuous input is a subclass of input class whose is_categorical attribute is set to false.
2. Categorical and Options: While both categorical and options inputs refer to any non-numeric inputs with a fixed set of options, we restrict the categorical
inputs to only denote the inputs which could be looked up in a table. We chose to make this distinction because it makes the task of filtering data tables
easier as only the inputs with categorical type can be used to filter the tables. Options input type is used for any input, that is categorical in nature, but that
cannot be put in a lookup table. Take an example of input where user is asked to choose between specifying either wind speed or capacity factor both of which are
continuous inputs. If the user selects wind speed, then he is prompted to enter wind speed, or vice versa. Storing this input selection in a lookup table does not
make sense because once one of the options is selected, there is nothing to look up a table for. On the other hand, for an input such as wind plant installation
the corresponding wind speed associated with either installation type. Thus, wind plant installation type would be stored as a categorical input type.
Chapter 5
Future Work & Conclusion
As discussed in Section 1.1, one of the most important goals of SESAME back-end design is that it should be capable of supporting a large variety of pathways for
analysis each with potentially different data sources and models. We have successfully achieved that goal via our design of both LCA and TEA metadata structures described
in Sections 3.1 and 3.2. Thus far, we have added support for about 15 to 20 energy pathways which include electricity generation through use of natural gas, coal,wind
and solar power. We have also implemented various crude oil to crude oil products pathways, where crude oil products include gasoline, diesel, liquefied petroleum gas
etc. While most of the data sources and models for these pathways proved to be compatible with our data model design, we did have to make some exceptions for
wind and solar pathways since we couldn’t really separate the upstream and process activity flows for these pathways. For both wind and solar, we made the adjustment
by computing all the flows in the process activity, but passing the computed flow values to the upstream activity for correct flow attributions. There is still lot of
ongoing work in adding all the TEA models for the existing LCA pathways though
the necessary back-end layout is ready.
As for future work, we have not yet implemented a way to connect the shared user
inputs between LCA and TEA pathway models for combined analysis. That is, if a certain user input is relevant to both LCA and TEA calculations, we should still only
our current implementation, even when the user chooses combined analysis type, we first ask the user all LCA inputs, and then ask them for all TEA inputs, which is not
optimal.
Another future work includes making the analysis results more meaningful for
users by providing the LCA sensitivity plots for their chosen pathway. Sensitivity plots would basically show to users the highest GHG emission and lowest GHG emission
that can be achieved for a given pathway with any permutation of the values of certain key user inputs in that pathway. Generating a sensitivity plot for any pathway would
require running that whole pathway with all possible combinations of the relevant user inputs. While our current LCA model implementation would support the sensitivity
analysis plot generation, it may be extremely slow, and we may have to make more optimizations to our existing design.
Appendix A
Code Samples
A.1
Example LCA Pathway - Natural Gas to
Elec-tricity
Attached below is the code sample for how we use the Python Library Interface
described in section 4.1 to add a natural gas to electricity LCA pathway to metadata.
# i n i t i a l i z e the m e t a d a t a o b j e c t m e t a d a t a = LCA . M e t a d a t a () e n d _ u s e = m e t a d a t a . r e g i s t e r _ s t a g e (" E n d U s e ") e l e c t r i c i t y = e n d _ u s e . r e g i s t e r _ a c t i v i t y (" E l e c t r i c i t y ") e l e c t r i c i t y . r e g i s t e r _ s o u r c e ( " D e f a u l t ", l o a d _ c l a s s (" s t a g e s . e n d u s e . e l e c t r i c i t y ", " E l e c t r i c i t y ") ) g a t e _ t o _ e n d u s e = m e t a d a t a . r e g i s t e r _ s t a g e (" G a t e T o U s e r ") t r a n s m i s s i o n = g a t e _ t o _ e n d u s e . r e g i s t e r _ a c t i v i t y (" T r a n s m i s s i o n ") t r a n s m i s s i o n . r e g i s t e r _ s o u r c e ( " L i t e r a t u r e R e v i e w ", l o a d _ c l a s s (" s t a g e s . g a t e _ t o _ e n d u s e . t r a n s m i s s i o n ", " T r a n s m i s s i o n ") ) p r o c e s s = m e t a d a t a . r e g i s t e r _ s t a g e (" P r o c e s s ")
n g _ p o w e r _ p r o d u c t i o n = p r o c e s s . r e g i s t e r _ a c t i v i t y (" N G P o w e r P r o d u c t i o n ") n g _ p o w e r _ p r o d u c t i o n . r e g i s t e r _ s o u r c e ( " A S P E N ", l o a d _ c l a s s (" s t a g e s . p r o c e s s . n g _ p o w e r _ a s p e n ", " N G P o w e r A S P E N ") , t a b l e =" s t a g e s / p r o c e s s / n g _ p o w e r _ a s p e n _ d a t a . csv " ) m i d s t r e a m = m e t a d a t a . r e g i s t e r _ s t a g e (" M i d s t r e a m ") t r a n s p o r t a t i o n _ n g = m i d s t r e a m . r e g i s t e r _ a c t i v i t y (" N G T r a n s p o r t a t i o n ") n g _ t r a n s p o r t a t i o n . r e g i s t e r _ s o u r c e ( " G R E E T ", l o a d _ c l a s s (" s t a g e s . m i d s t r e a m . t r a n s p o r t a t i o n ", " N G T r a n s p o r t a t i o n ") , t a b l e =" s t a g e s / m i d s t r e a m / t r a n s p o r t a t i o n _ d a t a . csv " ) u p s t r e a m = m e t a d a t a . r e g i s t e r _ s t a g e (" U p s t r e a m ") n a t u r a l _ g a s = u p s t r e a m . r e g i s t e r _ a c t i v i t y (" N a t u r a l G a s ") n a t u r a l _ g a s . r e g i s t e r _ s o u r c e ( " G R E E T ", l o a d _ c l a s s (" s t a g e s . u p s t r e a m . n a t u r a l _ g a s ", " N a t u r a l G a s ") , t a b l e =" s t a g e s / u p s t r e a m / n a t u r a l _ g a s _ d a t a . csv " ) e l e c t r i c i t y . l i n k ( t r a n s m i s s i o n ) t r a n s m i s s i o n . li n k ( n g _ p o w e r _ p r o d u c t i o n ) n g _ p o w e r _ p r o d u c t i o n . l i n k ( n g _ t r a n s p o r t a t i o n ) n g _ t r a n s p o r t a t i o n . l i n k ( n a t u r a l _ g a s )
Attached below is a code snippet for natural gas power production ASPEN activity source class. We see that user_inputs static class method specifies all the user input
required for this activity model. The three flow computation methods common to all activity source classes are also shown here.
c l a s s N G P o w e r A S P E N ( A c t i v i t y S o u r c e ) : @ c l a s s m e t h o d def u s e r _ i n p u t s ( cls ) : r e t u r n [ C a t e g o r i c a l I n p u t (’ t u r b i n e ’, ’ T u r b i n e ’) , C a t e g o r i c a l I n p u t (’ m o d e l ’, ’ M o d e l ’) , C o n t i n u o u s I n p u t (’ l o a d i n g _ r a t i o ’, ’ L o a d i n g ’, v a l i d a t o r s =[ v a l i d a t o r s . n u m e r i c () , v a l i d a t o r s . gte (0) , v a l i d a t o r s . lte (1) ]) ] def g e t _ i n p u t s ( se l f ) : f l o w _ d i c t = c o m p u t e _ i n p u t _ f l o w s ( s e l f . f i l t e r e d _ d f () , f l o w _ i n p = s e l f . o u t p u t ) r e t u r n { ’ p r i m a r y ’: f l o w _ d i c t [’ n a t u r a l gas ’] ,
’ s e c o n d a r y ’: [ f l o w _ d i c t [ key ] for key in f l o w _ d i c t if key != ’ n a t u r a l gas ’] } def g e t _ o u t p u t ( se l f ) : r e t u r n s e l f . o u t p u t def g e t _ e m i s s i o n s ( s e l f ) : r e t u r n c o m p u t e _ e m i s s i o n _ f l o w s ( s e l f . g e t _ i n t e r p o l a t e d _ d f () ,
f l o w _ i n p = s e l f . o u t p u t )
Appendix B
Figures
Bibliography
[1] Emre Gençer, Sarah Torkamani, Ian Miller, Tony Wenzhao Wu, and Francis O’Sullivan. Sustainable energy system analysis modeling environment: Analyz-ing life cycle emissions of the energy transition. Applied Energy, 277:115550, 2020.
[2] ISO 14040. The International Standards Organization. Environmental manage-ment — Life cycle assessmanage-ment — Principles and framework. Standard, July 2006.
[3] NREL (National Renewable Energy Laboratory). 2018 Annual Technology Base-line. 2018.
[4] M Q Wang. Greet 1.5 - Transportation fuel-cycle model - vol. 1 : methodology, development, use, and results. 1999.
[5] Felipe Pezoa, Juan L Reutter, Fernando Suarez, Martín Ugarte, and Domagoj Vrgoč. Foundations of JSON Schema. In Proceedings of the 25th International Conference on World Wide Web, pages 263–273. International World Wide Web Conferences Steering Committee, 2016.
[6] A. Ciroth. ICT for environment in life cycle applications openLCA — a new open source software for life cycle assessment. Int J Life Cycle Assess, 12:209, 2007.
[7] R. J. D’Andrea and R. G. Gowda. Object-oriented programming: concepts and languages. In IEEE Conference on Aerospace and Electronics, pages 634–640 vol.2, 1990.
[8] J.H. Saltzer and M.F. Kaashoek. Principles of Computer System Design: An Introduction. Elsevier Science, 2009.
[9] Guido Van Rossum and Fred L. Drake. Python 3 Reference Manual. CreateSpace, Scotts Valley, CA, 2009.
[10] Nick Coghlan Guido van Rossum, Barry Warsaw. Pep 8: Style Guide for Python Code, 2001.