Publisher’s version / Version de l'éditeur:
Vous avez des questions? Nous pouvons vous aider. Pour communiquer directement avec un auteur, consultez la première page de la revue dans laquelle son article a été publié afin de trouver ses coordonnées. Si vous n’arrivez pas à les repérer, communiquez avec nous à [email protected].
Questions? Contact the NRC Publications Archive team at
[email protected]. If you wish to email the authors directly, please see the first page of the publication for their contact information.
https://publications-cnrc.canada.ca/fra/droits
L’accès à ce site Web et l’utilisation de son contenu sont assujettis aux conditions présentées dans le site LISEZ CES CONDITIONS ATTENTIVEMENT AVANT D’UTILISER CE SITE WEB.
Internal Report (National Research Council of Canada. Institute for Research in Construction), 1998-05-01
READ THESE TERMS AND CONDITIONS CAREFULLY BEFORE USING THIS WEBSITE.
https://nrc-publications.canada.ca/eng/copyright
NRC Publications Archive Record / Notice des Archives des publications du CNRC :
https://nrc-publications.canada.ca/eng/view/object/?id=9bdc5e14-31a4-4a17-9897-dae71fdc1267 https://publications-cnrc.canada.ca/fra/voir/objet/?id=9bdc5e14-31a4-4a17-9897-dae71fdc1267
Archives des publications du CNRC
For the publisher’s version, please access the DOI link below./ Pour consulter la version de l’éditeur, utilisez le lien DOI ci-dessous.
https://doi.org/10.4224/20386369
Access and use of this website and the material on it are subject to the Terms and Conditions set forth at
Acoustical measurements in 10 atria
Ac oust ic a l M e a sure m e nt s in 1 0 At ria
B r a d l e y ,
J . S .
I R C - I R - 7 6 5
CONTENTS
Page
Summary……….. 2
Acknowledgments……… 3
1. Introduction……… 4
2. Description of the Atria………. 5
3. Acoustical Test Procedures………... 17
3.1 Ambient Noise Level Measurements……… 17
3.2 Room Acoustics Measurements……… 17
4. Ambient Noise Levels……….. 19
5. Room Acoustics Measurements……….. 26
6. 5.1 Average Results ……… 26
5.2 Sound Propagation……… 35
6. Relationships with Atrium Volume……….. 42
7. Conclusions………... 46
7.1 Ambient Noise……… 46
7.2 Average Acoustical Measures……….. 46
7.3 Sound Propagation……… 46
7.4 Variations with Volume……… 47
Appendix I . Definition of Acoustical Measures……….. 48
SUMMARY
This report presents the measurement results of acoustical tests in 10 different atrium spaces. These measurements were made as part of the acoustical component of a multi-disciplinary project to study the indoor environment of atrium spaces attached to office buildings. The acoustical component included the measurements reported here as well as computer simulation studies to be reported elsewhere. The main purpose of this report is to present a summary of the measurement results to characterize typical acoustical conditions in a wide variety of atrium spaces. Detailed analyses of these results will be left to future publications.
Two types of acoustical measurements were made. Ambient noise levels were measured at a number of locations repeatedly throughout a normal working day in each of the 10 atria. These ambient noise levels give a clear indication of the actual amount of noise experienced by people working in these atria. The other type of measurements were various standard room acoustics measures. These included decay times, such as the reverberation time, and relative sound levels. These quantities were all obtained from impulse response measurements using our RAMSoft room acoustics measurement software that was specially modified to give accurate results in the large and sometimes very reverberant atrium spaces.
The room acoustics measurement results are given in terms of average values for each atrium and the overall averages of all atria. These results identify several unique
acoustical characteristic that are typical of a wide range of atrium spaces. In addition, the propagation of sound as a function of the source-to-receiver distance is compared with predicted values for each atrium. Again the atria are found to be different to some other large indoor spaces. Finally, some simple analyses of the variation of acoustical
ACKNOWLEDGEMENTS
This work is part of a larger project in the Indoor Environment Program of the Institute for Research in Construction concerned with all aspects of the indoor environment in atrium spaces and carried out under the leadership of Dr. Morad Atif.. The goals of this larger project were to reduce energy costs of new and retrofitted atrium office buildings without compromising occupants’ comfort with respect to lighting, or acoustics and while ensuring compliance with available guides for smoke control and fire safety.
This research was made possible by the financial support of the following organizations: Société Immobilière du Québec, Public Works and Government Services Canada, Natural Resources Canada/CANMET, and Hydro-Québec. Further financial support was
provided by the Institute for Research in Construction of the National Research Council of Canada.
The author would also like to acknowledge the contribution of Dr. Yang Ki Oh, a visiting scientist from Mokpo National University in Korea, who collaborated with all aspects of the measurements included in this report. His help was much appreciated and essential to the success of the work.
1. INTRODUCTION
The atrium is an increasingly common feature in new, renovated, and converted office and commercial buildings. This is particularly important in cold regions, such as Canada, where an atrium permits people to carry out daily activities in a pleasant, naturally lit, and environmentally-controlled space in all seasons of the year. The atrium has become attractive as a part of both commercial and office buildings, and as a new element in old and historic buildings. In office buildings, an atrium serves the public and the workers by being: a public plaza, an employee lounge, reception areas, an extra-source of daylight, and sometimes as a communal meeting space.
The goals of the overall project were to reduce energy costs of new and retrofitted atrium office buildings without compromising occupants’ comfort with respect to lighting, or acoustics and while ensuring compliance with available guides for smoke control and fire safety. The overall project included detailed measurements of daylighting, ventilation and thermal performance in both summer and winter seasons in two quite different atria (SIQ and BNS, see Table 1).
The acoustical part of this work included measurements in a total of 10 different atria including the two studied in the other parts of the atrium project. The acoustical
measurements were conducted in 10 atria to get a better, more general, understanding of the acoustical characteristics and potential acoustical problems in a wider range of atrium types. The 10 atria are described in section 2 below and include a variety of atrium shapes and sizes. Some included special sound absorbing treatments but most did not. Two types of acoustical measurements were made in the 10 atria and the results of these measurements are reported here. Ambient noise levels were measured at a number of locations repeatedly throughout a normal working day in each atrium. These ambient noise levels give a clear indication of the actual amount of noise experienced by people working in these atria. The other type of measurements were various standard room acoustics quantities. These included decay times such as the reverberation time and relative sound levels. These quantities were all obtained from impulse response measurements using our RAMSoft room acoustics measurement software that was specially modified to give accurate results in the large and sometimes very reverberant atrium spaces. The measurement procedures are described in section 3 below.
This report is not intended to provide extensive analyses of the measurements but mostly to describe typical acoustical conditions in a wide range of atria. Section 4 gives the results of the ambient noise measurements. Section 5.1 reports average values of the various room acoustics quantities. Section 5.2 compares measurements and predictions of the propagation of sound in each atrium. Finally, section 6 gives the results of some simple analyses showing the influence of atrium volume on the measured acoustical quantities.
Symbol Atrium Volume, m3 BNS Bell Northern Research, Small 3,348 CMN CMHC, North 3,132
CMS CMHC South 3,427
BNE Bell Northern Research, East 10,125 CSC CSIS, cafeteria 17,000 NAG National Gallery, Great Hall 19,074 CSL CSIS, library 20,000 CSG CSIS, Galleria 25,000 BNC Bell Northern Research, Centre 28,000 SIQ SIQ, Palais de Justice, Québec 45,000
Table 1. Three-letter symbols used to describe each atrium and their volumes in m3 listed in order of increasing volume.
2. DESCRIPTION OF THE ATRIA
The names and volumes of the 10 atria that were measured are given in Table 1 below. Each atrium is referred to throughout this report by the three letter symbols given in Table 1. All of the atria, except one, were located in the Ottawa area. The SIQ atrium is located in Quebec city. The shapes were often quite complex and the volumes were estimated from an acoustical ray tracing program. (The ODEON program was used in related simulation studies of the same atria. It estimates the volume from the calculated reverberation time and the known absorbing properties of the surfaces). This gives a volume that may not correspond to the exact geometrical volume but where there are differences this estimate is probably more relevant to the acoustical issues of this work.
Sketches of the plans and sections of each of the 10 atria are given below along with a brief description of each atrium. The atria are listed in alphabetical order.
BNC (28,000 m3)
The BNC atrium consists of a large tower with an
octagonal plan. This atrium has seven floors including the ground floor. The lower three floors open out into adjacent spaces that include a large cafeteria and adjacent open office space. The roof is a cone shaped glass structure. The glass consists of two layers of 6 mm glass separated by a 12 mm air space. The ground floor in the atrium is made of terrazzo. In the balconies at the other floor levels, the floor consists of thin carpet. Most exposed wall surfaces are
constructed of painted gypsum board, with some stone and concrete on the ground floor. The surfaces of the balconies facing into the centre of the atrium are covered with 25 mm thick, fabric-covered sound absorbing panels made of rigid glass fibre.
glass
Figure 1(a). Section through BNC atrium. Solid circles indicate microphone measurement positions. Shaded areas are sound absorbing panels on the faces of balconies and stairs.
Small Atrium East Cafeteria S1 S2 Atrium
Figure 1(b). Plan of BNC atrium. Solid circles indicate microphone measurement positions. S1 and S2 are the locations of the test source.
glass
Figure 2(a). Section through BNE atrium. Solid circles
indicate microphone measurement positions.
BNE (10,125 m3)
The BNE atrium is a long narrow atrium separating large areas of mostly open plan office work stations as illustrated in the section of Figure 2(a) and the floor plan of Figure 2(b). The building is three floors high with a peaked glass roof running the length of the atrium. The glass consists of two layers of 6 mm glass separated by a 12 mm air space. The ground floor in the atrium is made of terrazzo. In the balconies along both sides of the second and third floors of the atrium, the floor consisted of thin carpet on removable computer flooring. The balcony soffits and faces were made of painted gypsum board. There were four large planters each containing a small tree in the atrium. Where office screens separated the office area from the atrium, the side facing into the atrium was non-absorptive. In the open office areas adjacent to the atrium, office screens were absorptive and there was a sound absorbing suspended ceiling. 2 3 1.5 m screens 1.5 m screens 1.6 m screen S2 S1 S3 S3
Figure 2(b). Plan of BNE atrium. Solid circles indicate microphone measurement positions. S1, S2 and S3 are the locations of the test source
BNS (3,348 m3 ) The BNS atrium is octagonal in plan and is three floors high including the ground floor.
Figure 3(a) shows a sketch of a vertical section through the centre of this atrium; Figure 3(b) shows a sketch of the plan of the ground floor of this atrium. Most of the internal surfaces are constructed of painted gypsum board. The ground floor is terrazzo, with a thin carpet in the centre of the floor and towards the main entrance. In the upper balconies, the floor consists of thin carpet on concrete. The central roof of the atrium is cone-shaped and made of glass. There are two layers of 6 mm glass separated by a 12 mm air space. Fabric covered rigid glass fibre sound absorbing material 25 mm thick is mounted on the vertical faces of the balcony parapet facing into the centre of the atrium (shown as shaded areas on Figure 3(a). The atrium serves as an entrance into a large building
complex and contains a reception desk.
S
glass
Figure 3(a). Section through BNS atrium. Solid circles indicate microphone measurement positions. Shaded areas are sound absorbing panels on balcony faces and stairs.
Entrance Hall Reception S1 S2 S3 S4
Figure 3(b). Plan of BNS atrium. Solid circles indicate microphone
measurement positions. S1, S2, S3 and S4 are the locations of the test source.
CMN (3,132 m3 ) The CMN atrium is rectangular in plan and is two stories high. The ground floor of this atrium is much longer than the second floor. The ground floor forms a completely enclosed space with mostly heavy glass partitions. The second floor of the atrium contains closed offices on the east side and open offices on the west side. There is a peaked roof that runs the length of the second floor part of the atrium. It is constructed of double glazing (two 6 mm layers of glass with a 12 mm air space). The main floor of the atrium is polished granite with small areas of thin carpet. The second floor is thin carpet on concrete. Walls on the second floor of the atrium are painted gypsum board. Open office areas were separated by sound absorbing office screens and the open office ceiling consisted of a suspended ceiling with thin cellulose fibre ceiling tiles.
glass glass glass open office closed offices
Figure 4(a). Section through CMN and CMS atria.
to cafeteria ** elevators 2nd floor brick glass open office open office S1 S2
Figure 4(b). Plan of CMN atrium. Solid circles indicate
microphone measurement positions. S1 and S2 are the locations of the test source.
CMS (3,427 m3 )
The CMS atrium is very similar in construction and overall size to the CMN atrium. The section across this atrium is well
described by that in Figure 4(a) for the CMN atrium. The major difference is that the west side of the second floor of the CMS atrium is open offices and not closed offices as in the CMN atrium. The plan of the CMS atrium in Figure 5(a) is similar to that in Figure 4(b) for the CMN atrium. The major difference is the stairs at the extreme south end of the CMS atrium that descend to a lower level for access to the outside. The surface materials are much the same in the two atria. There is a polished granite floor on the main floor and thin carpet on the second floor. There are heavy glass and granite walls on the ground floor and
painted gypsum board walls on the second floor. The adjacent open office areas were separated by sound absorbing office screens and the open office ceiling consisted of a suspended ceiling with thin cellulose fibre ceiling tiles.
** * * open office open office 2nd floor elevators glass granite S1 S2 S3 S4
Figure 5(a). Plan of CMS atrium. Solid circles indicate
microphone measurement positions. S1, S2, S3 and S4 are the locations of the test source.
CSC (17,000 m3) The CSC atrium is
triangular in plan and five stories high as illustrated in Figures 6(a) and 6(b). There is a cafeteria on the ground floor of the atrium with tables and chairs within the atrium. The ground floor of the atrium opens into the kitchen serving area of the atrium. There are openings from the CSC atrium into the larger CSG atrium on all floor levels.
The roof of the atrium includes six four-sided glass pyramids. These are constructed of two layers of 6 mm glass separated by a 12 mm air space. Most wall surfaces in the atrium are painted gypsum board with heavy glass railings along the edges of each balcony. The only areas of porous absorbing material are the small under-balcony areas. The majority of the floor is thin carpet on concrete. A significant area of the floor close to the kitchen serving area is vinyl tile on concrete.
Galleria
North South
glass glass
Figure 6(a). Section through CSC atrium. Solid circles indicate microphone measurement positions.
Cafteria
South North * * S4 S3Figure 6(b). Plan of CSC atrium. Solid circles indicate microphone
measurement positions. S3 and S4 are the locations of the test source. The arrow shows the location of the section of Figure 6(a).
CSG
(25,000 m3)
The CSG atrium is basically a large rectangular parallelepiped shape that separates two parts of a large building complex. The building on the north side of this atrium is six floors high and the building on the south side is five floors high. There are bridges across the atrium at each of the floors up to the fifth floor and at both ends of the atrium as illustrated in Figures 7(a) and 7(b). An indication of the cross section of this atrium is included in Figure 6(a). The atrium extends well above the height of the sixth floor of the building on the north side of the CSG atrium.
Most of the walls are constructed of painted gypsum board. The floor is terrazzo. The roof includes six four-sided glass pyramids. The upper parts of the walls above the sixth floor level are also mostly glass. The glass is double glazing consisting of two layers of 6 mm glass with a 12 mm air space. There were six small decorative trees on the west end of the ground floor of the atrium and several thin cloth banners hanging in the atrium. Neither the banners nor the trees are expected to have a significant acoustical effect. There are openings on five floors to the CSC atrium that is on the south side of the CSG atrium. There were no direct openings into the CSL atrium, which is located to the north of the CSG atrium.
East glass West
bridges
Figure 7(a). Longitudinal section through CSG atrium. Solid circles indicate microphone measurement positions.
* * S1 S2 bridge bridge Cafteria West East
Figure 7(b). Plan of CSG atrium and adjacent cafeteria (CSC atrium). Solid circles indicate microphone positions. S1 and S2 are the locations of the test source.
CSL (20,000 m3) The CSL atrium is triangular in plan and six floors high as illustrated in Figures 8(a) and 8(b). The main floor of the atrium is a library and is filled with bookshelves and several other larger tables and desks. On the upper floors, the atrium has small
openings into adjacent corridors on the west and north sides.
The roof of the atrium includes six four-sided glass pyramids. These are
constructed of two layers of 6 mm glass separated by a 12 mm air space. Most of the wall surfaces of the atrium are painted gypsum board. The main floor of the atrium is covered with thin carpet on concrete.
North South
glass
Figure 8(a) Section through the CSL atrium. The shaded rectangles are library bookshelves. Solid circles indicate microphone
measurement positions. * *S5 S6 North South
Figure 8(b) Plan of GSL atrium. Solid circles indicate microphone positions. S5 and S6 are the locations of the test source. The shaded rectangles are library
bookshelves. The dotted arrow indicates where the section in Figure 8(a) is located.
NAG (19,074 m3)
The NAG atrium is a large glass tower associated with a national museum. Figure 9(a) is a sketch of a section through the centre of this atrium and Figure 9(b) illustrates the plan of the atrium. It is constructed of mostly glass and smooth finished concrete. The glass surfaces are double glazing consisting of two layers of 6 mm glass separated by a 12 mm air space. The atrium is mostly empty. It contains a small reception desk and a few restaurant tables and chairs in the south-west side of the atrium. At lower levels the north-west and north-east sides are mostly constructed of smooth finished concrete. The floor of the atrium is polished stone. The stairs to the second floor on the north-east side of the atrium are constructed of smooth finished concrete and polished stone. There are openings at both the ground and second floor levels connecting the atrium to large corridors going off to the north and to the east. The surface materials in the east corridor are mostly double glazing with some polished
stone and concrete. The corridor to the north is mostly polished stone and concrete with double glazing in the roof.
East West
Figure 9(a) Section through the centre of the NAG atrium.
N * * S1 S2 glass concrete
Figure 9(b). Plan of the NAG atrium. S1 and S2 are the locations of the test source and the solid circles are the locations of the measurement microphones.
SIQ(45,000 m3)
The SIQ atrium is a large space with a quite complex shape. On the east side, there are five floors
(including the ground floor) opening onto the atrium, but on the west side there are only three floors of adjacent space. Figure 10(a) shows a sketch of a vertical section through the centre of this atrium in an east-west direction. Figure 10(b) shows a sketch of the plan of the ground floor of the atrium.
The main floor of the atrium provides public access to the various law
S4/S5
S1/S2/S3
Figure 10(a). Section through the SIQ atrium. Solid circles show the locations of the measurement microphone. S1, S2, S3, S4, and S5 are the locations of the test sound source.
N
S1 S2
S3
F
Figure 10(b). Plan of the SIQ atrium showing the location of the test sound source S1, S2, and S3. ‘F’ indicates the location of the fountain and the dotted arrow indicates the location of the section shown in Figure 10(a).
courts in the building as well as a place for people to congregate. There is a fountain on the main floor that is audible in most parts of the atrium.
Most of the internal surfaces are hard and reflective. The floor surface on the ground floor is mostly polished stone, while the floors of the various balcony areas are ceramic tile. The floor surface in the open space under the sloping glass roof sections is interlocking bricks. The wall surfaces are painted gypsum board on most floors, but on the ground floor, they have a grey stone surface. The glass atrium ceiling is constructed of two layers of 6 mm glass separated by a 12 mm air space.
Fig 10(c) shows a section of the balcony construction detail in this atrium. The balcony floors are ceramic
tile and the railings are heavy 19 mm thick glass. The ceiling surfaces under the
balconies are made of linear aluminum channels. The channels are 3 in. wide by 1.5 in. high (76 mm by 38 mm) and are spaced 1.25 in. (32 mm) apart. There are 2 in. (50 mm) thick glass fibre batts immediately above the aluminum channels with a black cloth covering facing downward.
There are large areas of the same type of aluminum channels on the ceiling of the atrium between the sections of glass. These areas of linear aluminum channels do not have glass fibre batts above them.
gypsum board concrete 19 mm glass 50 mm glass fibre aluminum channels hand rail sound source
3. ACOUSTICAL TEST PROCEDURES
Two types of acoustical measurements were made. Ambient noise levels were measured during normal working hours in the building. Room acoustics measurements were made when the building was not occupied, to assess the acoustical properties of the space.
3.1 Ambient Noise Level Measurements
Octave band measurements of representative ambient noise levels were made using a Rion type 29-E sound level meter. The measured background levels were obtained using 30 second integrations and using a standard slow response for the nine octave bands from 31 to 8000 Hz. The Rion meter can store up to 1500 sound level measurements, which were subsequently transferred, via an RS232 interface, to a computer and were stored as spreadsheets. Measurements were made at a number of locations in each atrium on at least two occasions during normal daytime working hours. In one atrium (SIQ), additional noise measurements were made to assess the noise produced by a large fountain.
3.2 Room Acoustics Measurements
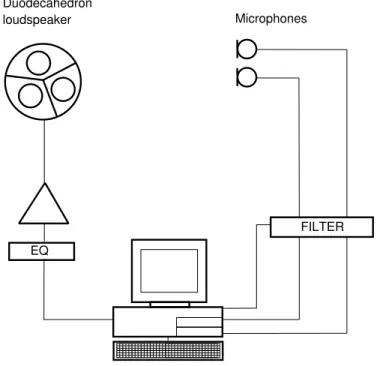
EQ
FILTER Duodecahedron
loudspeaker Microphones
Figure 11. Block diagram of the RAMSoft-3 room acoustics measurement system.
Room acoustics measurements were made with the RAMSoft-3 computer based measurement system developed at IRC. Figure 11 shows a block diagram of this measurement system. The system first measures impulse responses using a Maximum Length Sequence signal output by the computer, amplified, and radiated using an approximately omni-directional duodecahedron loudspeaker. The signals from the microphones are amplified and fed to an analogue-to-digital converter in the host
computer. The program first calculates the impulse response between the source and receiver position using a Fast Hadamard Transform process. This broad band impulse response is then filtered into six octave bands and various room acoustics parameters are calculated for each octave band. These parameters include measures of decay times and sound levels. They also include subjectively important measures of the sound energy in the early and late parts of the impulse responses. Further post processing of the impulse responses from some of the atria was used to obtain the values of various measures directly related to speech intelligibility[1,2]. All acoustical measures are defined in Appendix I.
4. AMBIENT NOISE MEASUREMENT RESULTS
The overall average noise levels in each of the 10 atria are given in Table 2. These overall averages are given both in terms of A-weighted levels and in terms of the RC mark II procedure [3]. These are averages of measurements at a number of different locations repeated at several times during normal working hours in each atrium. There is not a very wide range of these average noise levels. A-weighted levels varied from 46 to 58 dBA. The quietest atrium (CSL, 46 dBA) was used as a library and second most quiet (BNE, 48 dBA) was surrounded by open office work areas. The highest noise levels were measured in the SIQ atrium (58 dBA). This atrium contained a noisy fountain.
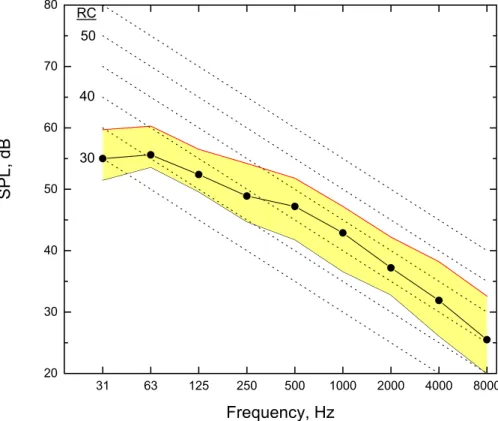
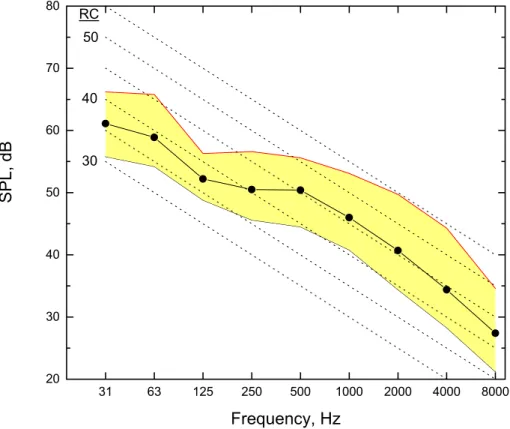
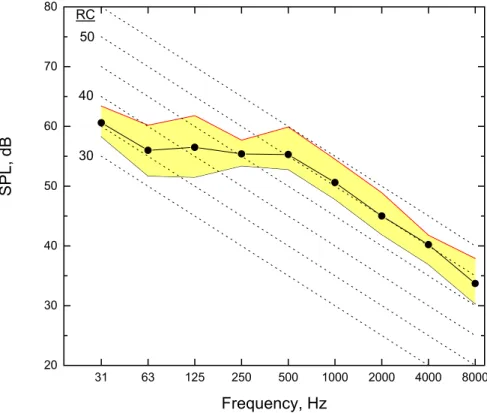
The octave band ambient noise level measurement results are given in Figures 12 to 21. Each figure shows the mean octave band spectrum as well as the minimum and maximum octave band levels from all of the measurements in each atrium. Although the measured noise levels in each atrium are in detail different, some general characteristics are quite similar for all of the atria. In particular all of the spectra in these plots tend to have relatively low levels at very low frequencies. That is, there is no evidence of ‘rumbly’ sounds in these atria. When the RC values are determined, the low frequency levels are well below the corresponding contour and the higher frequencies tend to be slightly above the RC contour. Thus the RC system rates all of the spectra as having relatively strong high frequency components (HF). This is in fact because the low frequency components are particularly low in level.
The numerical part of the RC rating is indicative of the average level of the noise in the frequency bands important for speech communication. The values range from 39 to 53. For female talkers, normal voice levels at a distance of 1 m are about 55 dBA. Thus acceptable non-critical speech communication among small groups of people should be possible at most locations in these atria. However, all of these atria are too noisy to permit high quality speech communication to groups of listeners at distances of several meters from the talker.
Atrium A-weighted level, dBA RC rating
BNC 50.4 44 (HF) BNE 48.4 42 (HF) BNS 50.5 45 (HF) CMN 51.3 45 (HF) CMS 52.3 46 (HF) CSC 56.0 50 (HF) CSL 46.1 39 (HF) CSG 55.7 50 (HF) NAG 51.9 46 (HF) SIQ 58.4 53 (HF)
Table 2. Average overall measured noise levels in each of the 10 atria: A-weighted levels and RC mark II procedure [3].
31 63 125 250 500 1000 2000 4000 8000 20 30 40 50 60 70 80 50 40 30 RC S P L, dB Frequency, Hz
Figure 12. Average measured octave band ambient noise levels and the range of measured levels in the BNC atrium. 31 63 125 250 500 1000 2000 4000 8000 20 30 40 50 60 70 80 50 40 30 RC SP L, dB Frequency, Hz
Figure 13. Average measured octave band ambient noise levels and the range of measured levels in the BNE atrium.
31 63 125 250 500 1000 2000 4000 8000 20 30 40 50 60 70 80 50 40 30 RC SPL, dB Frequency, Hz
Figure 14. Average measured octave band ambient noise levels and the range of measured levels in the BNS atrium. 31 63 125 250 500 1000 2000 4000 8000 20 30 40 50 60 70 80 50 40 30 RC SPL, dB Frequency, Hz
Figure 15. Average measured octave band ambient noise levels and the range of measured levels in the CMN atrium.
31 63 125 250 500 1000 2000 4000 8000 20 30 40 50 60 70 80 50 40 30 RC S P L, dB Frequency, Hz
Figure 16. Average measured octave band ambient noise levels and the range of measured levels in the CMS atrium. 31 63 125 250 500 1000 2000 4000 8000 20 30 40 50 60 70 80 50 40 30 RC SPL , dB Frequency, Hz
Figure 17. Average measured octave band ambient noise levels and the range of measured levels in the CSC atrium.
` 31 63 125 250 500 1000 2000 4000 8000 20 30 40 50 60 70 80 50 40 30 RC SPL, dB Frequency, Hz
Figure 18. Average measured octave band ambient noise levels and the range of measured levels in the CSG atrium. 31 63 125 250 500 1000 2000 4000 8000 20 30 40 50 60 70 80 50 40 30 RC S P L, dB Frequency, Hz
Figure 19. Average measured octave band ambient noise levels and the range of measured levels in the CSL atrium.
31 63 125 250 500 1000 2000 4000 8000 20 30 40 50 60 70 80 50 40 30 RC SP L, dB Frequency, Hz
Figure 20. Average measured octave band ambient noise levels and the range of measured levels in the NAG atrium. 31 63 125 250 500 1000 2000 4000 8000 20 30 40 50 60 70 80 50 40 30 RC SP L, dB Frequency, Hz
Figure 21. Average measured octave band ambient noise levels and the range of measured levels in the SIQ atrium.
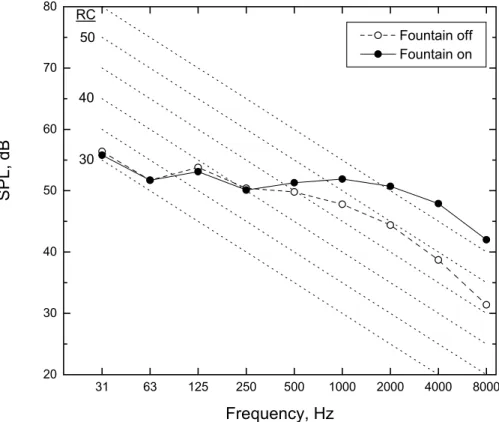
In the SIQ atrium, additional ambient noise measurements were made both with and without the fountain operating. These measurements were made at a large number of locations throughout the atrium during the evening outside of normal working hour. Thus these results exclude many of the normal operational sources of noise and give a better indication of the nature of the noise produced by the fountain. The average results from these measurements shown in Figure 22 show that the noise from the fountain is most significant at higher frequencies. Below 500 Hz the noise from the fountain had no effect on the measured noise levels in the atrium. The spectrum of the fountain noise corresponds with frequencies that are important for speech communication. Thus the fountain noise will mask speech sounds and make speech communication more difficult. At the same time it would make it more difficult for others to listen in to conversations in the atrium and so the fountain can be said to increase speech privacy in the atrium.
31 63 125 250 500 1000 2000 4000 8000 20 30 40 50 60 70 80 Fountain off Fountain on 50 40 30 RC SP L, dB Frequency, Hz
Figure 22. Average measured ambient noise levels with and without the fountain operating in the SIQ atrium.
5. ROOM ACOUSTICS MEASUREMENT RESULTS 5.1 Average Results
This section presents the average values of the principal room acoustics quantities. These values are the averages from the measurements at the combination of all source and receiver positions within each atrium. That is, measurement locations outside each atrium were excluded from these results. For each quantity the overall average of all the results from all 10 atria are given along with the range of the average values. This gives an indication of the typical acoustical characteristics of an atrium and also of the range of conditions between different types and sizes of atria.
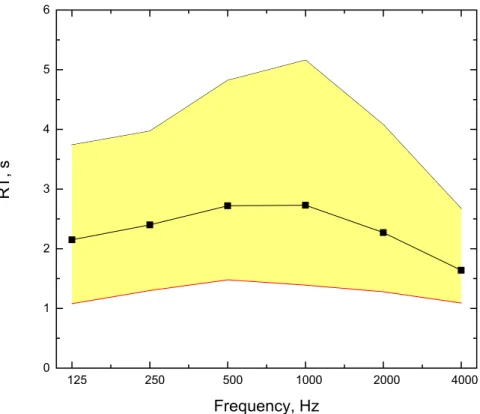
Figure 23 plots the overall average reverberation times (RT) versus frequency and also gives the range of the average octave band reverberation times from the 10 atria. The average octave band reverberation times from each atrium are listed in Table 3. This data illustrates the typical reverberation time characteristics of atria in that RT values tend to be greatest at mid-frequencies (500 and 1000 Hz). This pattern is especially strong in atria without any particular sound absorbing treatment. Reverberation times are reduced at low frequencies in atria because of the low frequency absorption of the large areas of glass surfaces. This characteristic is not usually found in other large indoor spaces. However, the reduced high frequency reverberation times, due to the absorption of sound by the large volume of air, are found in all large indoor spaces.
Figure 24 shows similar results for Early Decay Times (EDT). The average early decay times for each atrium are given in Table 4. Again there is a strong trend for EDT values to be greatest at mid-frequencies (500 and 1000 Hz).
If sound decays are exactly exponential in nature then RT and EDT values would be the same. In many situations the initial decay is more rapid than the later decay and hence
EDT values would be less than RT values. Figure 25 compares the overall average RT
and EDT values. There is an average trend for EDT values to be approximately 0.1 s less than RT values at Mid-frequencies and for there to be larger differences at lower
frequencies. Figure 26 shows this same effect in terms of the ratios of average EDT to average RT values. These ratio values are given for each atrium in Table 5. At 1000 Hz these ratios vary from 0.88 to 1.04. At 125 Hz they vary from 0.76 to 0.94. Clearly sound decays in atria are not exactly exponential in form. These deviations from
exponential decays seem to relate to the geometry of the atrium and to the complexity of the shape. The presence of many early reflections would tend to ensure that the initial part of the decay follows the same exponential decay as the later part and hence the EDT would be more clearly equal to the RT or the EDT/RT ratio would be closer to 1.0. The mid- and high-frequency EDT/RT ratios are largest in the CMN, CMS, CSL, and BNC atria. The CMN and CMS atria are long and narrow and form completely enclosed spaces on the ground floor. (See Figures 4(a), 4(b) and 5(a)). The CSL atrium has many bookshelves on the ground floor which would tend to provide a distribution of many early arriving reflections (See Figures 8(a) and 8(b)). The BNC atrium (Figures 1(a) and 1(b)) is relatively tall and narrow. The presence of many nearby surfaces may again increase the density of early reflections and lead to larger EDT/RT ratios.
125 250 500 1000 2000 4000 0 1 2 3 4 5 6 RT , s Frequency, Hz
Figure 23. Overall average Reverberation Time (RT) versus frequency and range of average reverberation times from the 10 atria.
125 250 500 1000 2000 4000 0 1 2 3 4 5 ED T , s Frequency, Hz
Figure 24. Overall average Early Decay Time (EDT) versus frequency and range of average early decay times from the 10 atria.
125 250 500 1000 2000 4000 0 1 2 3 4 EDT RT Decay time, s Frequency, Hz
Figure 25. Comparison of overall average Reverberation Time (RT) and overall average Early Decay Time (EDT) versus frequency.
125 250 500 1000 2000 4000 0.6 0.8 1.0 1.2 EDT/ RT, s Frequency, Hz
Figure 26. Average ratio of Early Decay Time (EDT) to Reverberation Time (RT) versus frequency and range of these ratios from the 10 atria.
Frequency, Atrium 125 250 500 1000 2000 4000 CMN 1.65 1.73 2.03 1.97 1.59 1.24 CMS 1.49 1.67 1.96 1.98 1.70 1.35 BNS 1.44 1.61 1.64 1.49 1.43 1.24 BNE 1.27 1.47 1.64 1.64 1.53 1.27 CSC 2.23 2.86 3.24 3.02 2.18 1.40 CSL 2.94 3.20 3.56 3.47 2.78 1.90 CSG 2.27 3.13 3.71 3.76 2.88 1.87 NAG 3.74 3.97 4.82 5.16 4.08 2.67 BNC 1.60 1.63 1.57 1.51 1.40 1.21 SIQ 2.87 2.71 3.01 3.36 3.09 2.28
Table 3. Average reverberation times (RT) in seconds versus frequency for each atrium.
Frequency, Atrium 125 250 500 1000 2000 4000 CMN 1.27 1.62 2.00 2.02 1.65 1.22 CMS 1.36 1.57 1.99 2.05 1.75 1.33 BNS 1.35 1.49 1.48 1.39 1.28 1.09 BNE 1.08 1.30 1.51 1.55 1.42 1.19 CSC 1.96 2.61 2.91 2.65 1.96 1.26 CSL 2.26 3.13 3.51 3.51 2.76 1.81 CSG 1.71 2.53 3.18 3.36 2.53 1.61 NAG 3.18 3.36 4.22 4.72 3.63 2.26 BNC 1.38 1.48 1.49 1.47 1.32 1.20 SIQ 2.42 2.32 2.71 3.06 2.80 1.94
Table 4. Average early decay time (EDT) in seconds versus frequency for each atrium.
Frequency, Atrium 125 250 500 1000 2000 4000 CMN 0.77 0.94 0.98 1.03 1.04 0.98 CMS 0.91 0.94 1.02 1.04 1.03 0.98 BNS 0.94 0.92 0.90 0.93 0.90 0.88 BNE 0.85 0.89 0.93 0.95 0.93 0.94 CSC 0.88 0.91 0.90 0.88 0.90 0.91 CSL 0.77 0.98 0.99 1.01 0.99 0.95 CSG 0.76 0.81 0.86 0.89 0.88 0.86 NAG 0.85 0.85 0.88 0.92 0.89 0.84 BNC 0.86 0.91 0.95 0.98 0.95 0.99 SIQ 0.84 0.86 0.90 0.91 0.91 0.85
The overall average Relative Sound Levels (G) and the range of these average values are shown in Figure 27. The average Relative Sound Levels for each atrium are given in Table 6. These G values indicate the effect of the room on the level of sound from a particular source. That is, if the G values are greater in a particular atrium, the level of sound from a particular source would be higher. In general G values will be higher in smaller atria, but the amount of sound absorption will also influence these values. The average G values in Table 4 indicate an approximate 10 dB range among the 10 atria. Thus a given sound source, such as a vacuum cleaner, could be as much as 10 dB louder in the BNS atrium than in the BNC atrium. The variation with frequency is similar to that for decay times and G values tend to be greatest at mid-frequencies. As for decay times, the low frequencies are reduced by the low frequency sound absorption of the large areas of glass. Higher frequency G values tend to be reduced in all large indoor spaces due to the absorption of high frequency sound by the large volume of air. Figures 28 plots the range and overall average of the Early-Arriving Relative Sound Levels (G80) and Figure 29 plots the same information for the Late-Arriving Relative sound levels (GL) . The average values for these quantities for each atrium are given in Tables 7 and 8. The Early-Arriving Relative levels are derived from the initial 80 ms of the impulse response and would tend to be more influenced by the details of early reflections and the geometry of the atrium. The Late-Arriving Relative Levels would be more influence by amount of sound absorbing material and the overall size of the atrium. The overall average values of the three different Relative Sound Levels, G, G80, and GL are compared in Figure 30. On average, at mid-frequencies, late arriving sounds are 1 to 2 dB higher in level than early arriving sounds. Thus at these locations the sound would be quite ‘reverberant’ in character and speech communication would not be ideal. This can be seen more directly in terms of values of Early-to-Late Arriving Sound Ratios (C80). The overall average and range of average values of C80 from the 10 atria are plotted in Figure 31. The average C80 values from each atrium are given in Table 9. At mid frequencies the overall average C80 values are between –1 and –2 dB as was
indicated from the difference of G80 and GL values in Figure 30. C80 values are indicative of the clarity of speech sounds and would relate to speech intelligibility. For almost all of these measurements the measuring microphone was more than 10 m from the sound source. Thus these results are not representative of conditions at shorter distances where the direct and early-reflected sounds are much more important. At shorter distances (e.g. 1 or 2 m) the direct and early-reflected sound energy is stronger than the later arriving sound and at these distances conditions are much more suitable for speech communication in these atria.
125 250 500 1000 2000 4000 -5 0 5 10 15 G, dB Frequency, Hz
Figure 27. Overall average Relative Sound Level (G) versus frequency and range of average Relative Sound Levels from the 10 atria.
125 250 500 1000 2000 4000 -10 -5 0 5 10 G 80, d B Frequency, Hz
Figure 28. Overall average Early-Arriving Relative Sound Level (G80) versus frequency and range of Early-Arriving Relative Sound Levels from the 10 atria.
125 250 500 1000 2000 4000 -10 -5 0 5 10 G G80 GL Relative leve l, dB Frequency, Hz
Figure 30. Comparison of overall average Early-Arriving (G80) , Late-Arriving (GL) and Total (G) Relative Sound levels versus frequency from the 10 atria.
125 250 500 1000 2000 4000 -10 -5 0 5 10 GL, dB Frequency, Hz
Figure 29. Overall average Late-Arriving Relative Sound Level (GL) versus frequency and range of average Late-Arriving Relative Sound Levels from the 10 atria.
Frequency, Atrium 125 250 500 1000 2000 4000 CMN 5.39 8.07 9.23 9.13 6.80 3.66 CMS 4.14 7.71 8.49 8.68 6.72 4.08 BNS 10.25 10.60 10.76 9.81 8.36 7.12 BNE -0.77 1.63 0.64 0.69 -0.93 -3.21 CSC 5.35 7.39 8.01 7.31 4.89 1.99 CSL 2.47 3.97 4.79 4.19 1.83 -1.69 CSG 3.66 5.19 6.01 5.16 2.83 -0.54 NAG 8.43 8.41 9.51 9.26 7.71 4.97 BNC 1.52 1.36 0.62 0.20 -1.27 -2.62 SIQ -0.02 -0.12 0.60 1.10 0.00 -2.96
Table 6. Average total relative levels (G) in dB versus frequency for each atrium.
Frequency, Atrium 125 250 500 1000 2000 4000 CMN 3.19 4.59 5.17 5.12 3.59 1.31 CMS 2.11 4.40 4.70 4.62 3.26 1.61 BNS 7.41 7.81 8.25 7.45 6.44 5.48 BNE -2.92 -0.48 -2.52 -2.23 -3.57 -5.46 CSC 2.71 3.57 3.55 3.23 1.94 0.20 CSL -1.43 -1.08 -0.94 -1.10 -2.44 -4.72 CSG 0.99 1.53 1.35 0.40 -0.70 -2.89 NAG 3.77 3.14 3.91 3.94 3.51 1.96 BNC -1.36 -1.39 -2.14 -2.53 -3.53 -4.70 SIQ -4.35 -3.86 -3.29 -3.44 -4.26 -5.97
Table 7. Average early relative levels (G80) in dB versus frequency for each atrium.
Frequency, Atrium 125 250 500 1000 2000 4000 CMN 0.96 5.02 6.76 6.69 3.68 -0.47 CMS -0.71 4.62 5.92 6.33 3.85 0.21 BNS 7.18 7.53 7.70 6.76 5.31 4.08 BNE -5.79 -2.84 -2.57 -2.66 -4.58 -7.37 CSC 1.66 4.94 5.79 4.91 1.59 -3.01 CSL -0.12 2.17 3.31 2.55 -0.37 -5.02 CSG -0.17 2.37 3.93 3.10 -0.05 -4.77 NAG 6.56 6.77 7.96 7.62 5.46 1.79 BNC -2.53 -2.75 -3.62 -3.87 -6.07 -7.58 SIQ -2.95 -3.16 -2.17 -1.29 -2.58 -6.61
Frequency, Atrium 125 250 500 1000 2000 4000 CMN 2.23 -0.43 -1.58 -1.57 -0.09 1.79 CMS 2.82 -0.22 -1.22 -1.72 -0.59 1.40 BNS 0.68 0.60 1.31 1.57 2.73 3.66 BNE 2.88 2.36 0.05 0.43 1.00 1.91 CSC 1.04 -1.37 -2.24 -1.68 0.34 3.21 CSL -1.31 -3.25 -4.25 -3.66 -2.07 0.29 CSG 1.16 -0.83 -2.57 -2.70 -0.65 1.88 NAG -2.79 -3.63 -4.06 -3.67 -1.96 0.17 BNC 1.17 1.36 1.49 1.34 2.55 2.88 SIQ -1.40 -0.70 -1.11 -2.14 -1.68 0.65
Table 9. Average early-to-late arriving sound ratios (C80) in dB versus frequency for each atrium. 125 250 500 1000 2000 4000 -5 -4 -3 -2 -1 0 1 2 3 4 5 C8 0, dB Frequency, Hz
Figure 31. Overall average Early-to-Late-Arriving Sound Ratio (C80) versus frequency and range of average Early-to-Late-Arriving Sound Ratios from the 10 atria.
5.2 Sound Propagation
It is often very informative to examine how sound levels vary with distance from the sound source. This relates directly to the practical problem of estimating the effect of a noise source at locations throughout a space. In addition, consideration of sound
propagation usually helps to better understand the acoustical properties of a space. This report includes plots of the total relative sound levels (G) as a function of source-to-receiver distance. In addition to the measured sound levels, these plots also include two different theoretical predictions. One is based on simple diffuse field theory [4] that assumes sound levels are due to the combination of a direct sound and a reverberant sound that is constant throughout the space. The other is Barron’s revised theory [5] developed for predicting relative sound levels in large auditoria. Barron’s revised theory has been shown to provide reasonable predictions of measured sound levels in auditoria and to be more accurate than the simple diffuse field equations.
Only plots of 1000 Hz G values are included to limit the number of plots required. At 1000 Hz measured values in auditoria have been found to agree well with predictions in reasonably diffuse spaces. Thus, where there are significant differences between measured and predicted values in the present atrium data, the differences may indicate some unusual property of the atrium space.
The 1000 Hz G values are plotted as a function of source-to-receiver distance in Figures 32 to 41 for each of the ten atria. There are several features that are common to many of these plots. At distances of up to 10 m, some measured values exceed the theoretical values by several decibels. Examination of the measured impulse response from which these G values were obtained shows that these higher than expected measured values are due to strong coherent floor reflections. That is, at these particular locations there is a strong reflection from the floor surface that arrives in phase with the direct sound at some frequency within the 1000 Hz octave band. Other reflections tend to be smaller in
amplitude and arrive somewhat later at the microphone. Thus the individual floor reflection in these special cases has a particularly dominant effect on the total measured level.
The other common feature is that at larger distances the measured G values tend to be consistently lower than the predictions and these differences tend to increase with increasing source-to-receiver distance. Alternatively, one can say that measured sound levels tend to decrease more rapidly with distance than the predicted levels. As found for measurements in auditoria, Barron’s revised theory provides more accurate predictions than the simple diffuse field theory.
Figure 32 shows measured and predicted 1000 Hz G values for the BNC atrium. There are several measured values that are well above the predicted values at closer distances due to strong coherent floor reflections. At larger distances measured values are consistently below the Barron predictions and seem to decrease more rapidly with distance than predicted.
The general trend for measured values in the BNE atrium shown in Figure 33 is again for measured values to fall below predicted values and to decrease more rapidly with
0 10 20 30 40 50 60 -5 0 5 10 15 Diffuse Barron G (1000) , dB Distance, m
Figure 33. Comparison of measured and predicted 1000 Hz relative sound levels (G) versus source-to-receiver distance in the BNE atrium.
0 10 20 30 40 -10 -5 0 5 10 15 Diffuse Barron G (100 0) , d B Distance, m
Figure 32. Comparison of measured and predicted 1000 Hz relative sound levels (G) versus source-to-receiver distance in the BNC atrium.
The results for the BNS atrium in Figure 34 at first seem a little unusual. However, in this smaller tower shaped atrium source-to-receiver distances are all relatively small. Thus, there are more situations where strong coherent floor reflections increase the measured levels.
The CMN and CMS atria are architecturally quite similar and the plots of measured and predicted sound levels in Figures 35 and 36 are quite similar. They both follow the general pattern of trends for these plots.
The CSC atrium is relatively a little more reverberant for its size and the differences between the diffuse field and Barron revised theory predictions are smaller. The measured values in Figure 37 are a reasonably good fit to the predictions of the Barron theory and do not fall substantially below the predictions as in most of the other atria. The ground floor of this atrium contains a cafeteria with many tables and chairs. This furniture and the many openings into the adjacent CSG atrium may contribute to this being an acoustically more diffuse sound field.
The measured levels in the GSG atrium, shown in Figure 38, indicate several examples of strong coherent floor reflections at closer distances and levels that decrease more rapidly with distance than predictions at larger distances.
The CSL atrium included many library bookshelves on the ground floor. These would in many cases block the direct sound path from the source to the receiver. This may be the cause of the measured levels being below the predicted levels in Figure 39 at all source-to-receiver distances.
The NAG atrium is a very reverberant space with very little sound absorption. For this atrium the simple diffuse field predictions and Barron’s revised theory differ by no more than about 1 dB even at a source-to-receiver distance of 30 m. In Figure 40 for this atrium, there are a few examples of strong coherent floor reflections, but most measured levels agree reasonably well with the predictions of Barron’s revised theory.
The SIQ atrium was the largest and the measured levels in Figure 41 show the same features as in most of the other atria. At two measurement locations strong coherent floor reflections increased the measured levels several decibels above predictions. At distances of 10 to 20 m a number of measured values were a small amount above predictions. At these locations there was a significant floor reflection but these floor reflections arrived a little later after the direct sound and were smaller in amplitude and hence had relatively less effect on the total sound level. At larger distances measured levels consistently fall below predicted levels.
0 10 20 0 5 10 15 20 Diffuse Barron G (1000) , dB Distance, m
Figure 34. Comparison of measured and predicted 1000 Hz relative sound levels (G) versus source-to-receiver distance in the BNS atrium.
0 10 20 30 40 0 5 10 15 20 Diffuse Barron G (1000) , dB Distance, m
Figure 35. Comparison of measured and predicted 1000 Hz relative sound levels (G) versus source-to-receiver distance in the CMN atrium.
0 10 20 30 40 0 5 10 15 20 Diffuse Barron G (1000) , dB Distance, m
Figure 36. Comparison of measured and predicted 1000 Hz relative sound levels (G) versus source-to-receiver distance in the CMS atrium.
0 10 20 30 0 5 10 15 20 Diffuse Barron G (1000) , dB Distance, m
Figure 37. Comparison of measured and predicted 1000 Hz relative sound levels (G) versus source-to-receiver distance in the CSC atrium.
0 10 20 30 40 50 0 5 10 15 20 Diffuse Barron G (1000) , dB Distance, m
Figure 38. Comparison of measured and predicted 1000 Hz relative sound levels (G) versus source-to-receiver distance in the CSG atrium.
0 10 20 30 40 0 5 10 15 20 Diffuse Barron G (1000) , dB Distance, m
Figure 39. Comparison of measured and predicted 1000 Hz relative sound levels (G) versus source-to-receiver distance in the CSL atrium.
7. 0 10 20 30 5 10 15 20 Diffuse Barron G (1000) , dB Distance, m
Figure 40. Comparison of measured and predicted 1000 Hz relative sound levels (G) versus source-to-receiver distance in the NAG atrium.
0 10 20 30 40 50 -5 0 5 10 15 Diffuse Barron G (1000) , dB Distance, m
Figure 41. Comparison of measured and predicted 1000 Hz relative sound levels (G) versus source-to-receiver distance in the SIQ atrium.
6. RELATIONSHIPS WITH ATRIUM VOLUME
It is of interest to try to determine how the average acoustical characteristics vary with the size of the atria. A number of quantities can be shown to vary approximately with the overall volume of the atria. Figure 42 plots average measured mid-frequency RT values (averages of 500and 1000 Hz octave values) versus atrium volume for all 10 atria. The results from many of the atria are approximated by the dashed line showing RT to increase proportional to the logarithm of the volume. The three atria with RT values that fall well below and to the right of this line (BNE, BNC and SIQ) are larger atria with added sound absorbing material. The atrium that is above the dashed line (NAG) had unusually little natural sound absorption and had mostly polished concrete and glass surfaces.
Average measured mid-frequency relative sound levels (G) tended to decrease linearly with increasing atrium volume as illustrated in Figure 43. The following equation approximately describes the mean trend of these mid-frequency results,
G = -volume/5000 + 10, dB 0 10 20 30 40 50 60 0 1 2 3 4 5 Volume, (1,000) m RT(500-1k), s BNS BNE BNC SIQ NAG CSG CSL CSC CMS CMN RT=2*log(Vol)-5 3
Both the BNE and BNC atria open out onto large adjacent volumes. The BNE atrium is surrounded by open plan office space. The BNC atrium opens out onto large areas of cafeteria and connecting spaces. Thus for these two atria the effective volume is much greater than that indicated in Figure 43. Because the sound energy is actually distributed over a bigger volume than indicated, the relative sound levels are lower than expected for this size of atrium. The NAG atrium, which included minimal sound absorption, had higher G values than the mean trend line.
One can break the relative sound level up into early- and later-arriving components. The early-arriving relative sound levels are usually more influenced by the design details of particular surfaces related to the details of early reflections in each atrium while the later arriving-relative sound levels are more closely related to the average sound absorbing properties of the atria. The early- and late-arriving sound levels were separately plotted versus atrium volume to obtain plots similar to Figure 43. The mean trends of these mid-frequency results (500 and 1000 Hz) were approximately described by the following equations, G80 = volume/5000 + 5.5, dB GL = volume/5000 + 7.5 dB, 0 10 20 30 40 50 0 2 4 6 8 10 12 Volume, (1,000) m G(500-1k), dB BNS CMN CMS NAG CSC CSL CSG SIQ BNC BNE G = -VOL/5000 + 10 3
0 2 4 6 8 10 12 0 2 4 6 8 10 12 14 G(500-1k), dB (measured) G(500-1k), dB (calculated) Barron Diffuse BNC SIQ BNE CSL CSG CSC NAG BNS CMS CMN Mean difference Barron Diffuse 3.1 dB 1.8 1.8 dB 1.2+ -+
-Figure 45. Calculated versus measured mid-frequency G values for both diffuse field and Barron’s revised theory
The three equations describing the mean trend for the early, late and total relative sound levels are parallel lines. On average for these mid-frequency results, the late-arriving sound levels (GL) are 2 dB greater than the early-arriving sound levels (G80). Thus one would expect frequency C80 values to be approximately -2 dB. The average mid-frequency C80 values shown on Figure 31 show that this is approximately correct. Beranek[6] has shown a good relationship between the ratio of EDT-to-volume and G values for mid-frequency results in concert halls. The same relationship is approximately valid for atrium spaces. Figure 44 compares mid-frequency values of EDT/Volume versus G with Beranek's relationship shown by the dashed line. Beranek multiplied the
EDT/Volume ratios by 106 to get more convenient numbers. Measured G values have been increased by 0.6 dB to follow the same procedure of adjustment used by Beranek. The results show quite
reasonable agreement with Beranek's relationship but with a little more scatter than for the concert hall data. This provides a useful relationship for
estimating sound levels in an atrium from expected EDT values.
Simple diffuse field theory allows us to estimate measured relative sound levels from the room dimensions and measured reverberation times. Barron’s revised theory [5] has been shown to provide more accurate estimates of relative sound
0 2 4 6 8 10 12 30 50 100 200 300 500 1000 G(500-1k), dB (10 )EDT/Vol Beranek BNE SIQ BNC CSL CSG CSC NAG BNS CMN CMS 6
Figure 44. Comparison of the variation of the ratios of EDT-to-room volume with mid-frequency G values and Beranek’s relationship for concert halls.
levels in rooms and is also capable of separately estimating early- and late-arriving relative sound levels. These two approaches were used to estimate measured relative sound levels and the results are illustrated in Figure 45 for mid-frequency values. The mean difference between the diffuse field calculations and measured values was 3.1 dB with a standard deviation of ±1.8 dB. However, Barron’s revised theory predicted measured values with a mean difference of 1.8 dB and a standard deviation about this mean of ±1.2 dB. Although Barron’s revised theory provides more accurate predictions of these mid-frequency relative sound levels, there are still substantial differences between measurements and predictions.
Figure 46 compares measured and predicted early-arriving relative sound levels (G80)
using Barron’s revised theory. Here the mean difference between measured and
-4 -2 0 2 4 6 8 -4 -2 0 2 4 6 8 10 G80(500-1k), dB (measured) G80(500-1k), dB (calculated) Barron BNC SIQ BNE CSL CSG CSC NAG BNS CMS CMN Mean difference Barron 1.7 dB 1.5+
-Figure 46. Calculated versus measured mid-frequency G80 values based on Barron’s revised theory.
-4 -2 0 2 4 6 8 -4 -2 0 2 4 6 8 10 GL(500-1k), dB (measured) GL(500-1k), dB (calculated) Barron BNC SIQ BNE CSL CSG CSC NAG BNS CMS CMN Mean difference Barron 1.9 dB 1.2+
predicted values is 1.7 dB with a standard deviation of ±1.5 dB. Figure 47
compares measured and predicted late-arriving relative sound levels (GL) . Here the mean difference between measured and predicted is slightly larger, 1.9 dB with a little smaller standard deviation of ±1.2 dB. In this figure there is a more consistent trend for the measured GL values to be less than predicted. Barron’s revised theory was developed for use in auditoria. The present results suggest that there are systematic differences between auditoria and atria. Atria are not designed to distribute sound energy more or less evenly throughout their volume as are auditoria. The internal surfaces of atria are often irregular and various balconies, parapets and alcoves will tend to scatter sound energy resulting in lower sound levels. If one assumes that this will in general result in lower late-arriving sound levels as indicated in Figure 47, an improved agreement between measured and predicted levels can be obtained. Figure 48 illustrates the comparison of measured and predicted mid-frequency relative sound levels for three cases. These include the diffuse field and Barron revised theory predictions from Figure 45 as well as a modified version of Barron’s theory. In the modified Barron prediction the late-arriving component of the total sound level was reduced by 3.0 dB and is labeled ‘Glate-3’ in Figure 48.. The result is a mean difference of only 0.4 dB with a standard deviation of ±1.0 dB relative to measured values. While this is a significant improvement, a more substantial analysis is required to develop improved predictions based on a more complete understanding of the acoustical properties of atria. For example, modifications to the Barron predictions of both early (G80) and late (GL) relative sound levels are needed to match the observed mean differences in Figures 46 and 47.
0 2 4 6 8 10 12 0 2 4 6 8 10 12 14 G(500-1k), dB (measured) G(500-1k), dB (calculated) Barron Diffuse GL-3 BNC SIQ BNE CSL CSG CSC NAG BNS CMS CMN Mean difference Barron Diffuse 3.1 dB 1.8 1.8 dB 1.2 Glate-3 0.4 dB 1.0 + -+ -+
-Figure 48. Calculated versus measured mid-frequency G values including modified Barron revised theory with 3 dB subtracted from the predicted late energy component (Glate-3).
7. CONCLUSIONS 7.1 Ambient Noise
Measurements of ambient noise levels were made during normal daytime work hours and so would be representative of the combination of HVAC and other building systems as well as the various noises of the occupants. These could include printers and other office equipment as well as people talking. When compared to the ASHRAE RC contours, the average measured noise spectra in all 10 atria indicated the most significant ambient noises were at mid- and higher-frequencies. There were no examples of noise with obvious rumble components.
One atrium contained a fountain. The mid- and higher-frequency noise from this fountain could interfere with speech communication.
7.2 Average Acoustical Measures
Average reverberation times (RT) and early decay times (EDT) are usually maximum at intermediate frequencies (500 and 1000 Hz) in most untreated atria. This is because decay times are reduced at lower frequencies because the large areas of glass tend to absorb low frequency sound and the large volumes of air in the atria absorb higher frequencies. In atria with large areas of porous sound absorbing panels. mid- and higher-frequency decay times tend to be reduced compared to this trend for untreated atria. EDT values are typically about 0.1 s less than RT values at mid-frequencies and these
differences are larger at lower frequencies.
Overall relative sound levels (G) similarly tend to be largest at intermediate frequencies. However, the late-arriving sound levels (GL) are most reduced at low frequencies by the absorption of the glass. Overall mid-frequency GL values are greater than mid frequency early-arriving relative sound levels (G80). There is a strong trend for G values to vary with room volume and G values are as much as 10 dB greater in the smallest atrium compared to the largest. This indicates that noise problems will be most severe in the smaller atria and in larger atria the levels of more distant noises will be somewhat reduced.
On average, mid-frequency early-to-late sound ratios (C80) were about –2dB. This would be far from ideal for optimum speech intelligibility but would correspond to conditions at an average distance of about 20 m. At closer distances of 1 to 2 m speech intelligibility would be quite acceptable in all of the atria because of the relative strong direct sound.
7.3 Sound Propagation
The variation of measured sound levels as a function of distance from the source was predicted more accurately by Barron’s revised theory than conventional diffuse field theory. In most of the atria, measured sound levels decreased more rapidly with distance than predicted by Barron’s theory. This was thought to be due to the many surfaces that tend to scatter sound rather than to provide strong reflections back into the atrium. At distances of up to 10 m from the source, there were a number of examples where measured levels were significantly increased by strong coherent floor reflections. Atria that were very reverberant tended to agree more closely with the prediction of Barron’s revised theory.
7.4 Variations with Volume
Relative sound levels vary very significantly with atrium volume. Levels in the smaller atria were up to 10 dB greater than in the largest atrium. Thus a given noise source would be 10 dB louder in the smaller atrium and in general noise problems are more likely to occur in smaller atria.
There seemed to be a systematic trend for later arriving sound levels to be over-predicted by about 2 dB by the Barron theory. Further work is required to develop modifications to Barron’s revised theory so that it more accurately predicts acoustical conditions in typical atrium spaces.
Average relative sound levels (G) and early decay times (EDT) could be approximately related as has been proposed for similar measurements in large auditoria. This provides a simple procedure for obtaining approximate estimates for relative sound levels in atria.
APPENDIX I. DEFINITION OF ACOUSTICAL MEASURES
This appendix includes definitions of acoustical measures referred to in this report. These include decay times, relative sound levels, energy ratios, and several measures related to the intelligibility of speech.
Two different decay times were measured. The conventional Reverberation Time (RT) is the time calculated for the sound energy to decrease by 60 decibels after the source is stopped. RT values were calculated from straight line fits to the portion of the decay curve between -5 and -30 dB below the maximum level using Schroeder’s integrated impulse response technique. Early decay times (EDT) are also measures of the time required for the sound energy to decrease by 60 dB, but are calculated from straight line fits to the first 10 dB of the decay. While RT values are physically important, EDT values are more strongly related to subjectively perceived reverberance.
G, the overall Strength or Relative Sound Level indicates the level of the sound at a point in the room relative to that of the same source at a distance of 10 m in a free field. (A free field is similar to outdoor conditions with no reflecting surfaces and can be approximated by measurements in an anechoic test room.) G is defined as follows:
G= p t dt pA t dt ∞ ∞
∫
∫
10 2 0 2 0 log ( ) ( ) , dBwhere p(t) is the instantaneous pressure response to an impulse source and pA2 is the instantaneous pressure response from the same source at a distance of 10 m in a free field.
Relative Sound Levels can also be defined for the early- and late-arriving sound energy.
G80 is the Relative Sound level for the sound energy arriving within 80 ms after the arrival of the direct sound. It can be defined by an equation similar to that above for overall G values except that the integration limits on the first integration would be from 0 to 80 ms. The Relative Sound Level for the later arriving sound energy, (GL) can be defined by changing the integration limits of the first integral to vary from 80 ms to ∞. Early-to-late arriving sound energy ratios have been calculated for various temporal divisions between early and late reflections. C80 with a 0.08 s early time limit is calculated as follows: C80 10 p t dt2 p t dt 0 0 08 2 0 08 =
∫
∫
∞ log ( ) ( ) . . , dBC80 is a measure of clarity or the balance between clarity and reverberance. Increased C80 values correspond to expected increases in speech intelligibility.
REFERENCES
[1] Bradley, J.S., “Monitoring Results of the BNR Atria, Acoustical Measures”, IRC Client report A3538.2(Ac), 1997.
[2] Bradley, J.S., “Monitoring Results of the Palais de Justice Atrium, Quebec, Acoustical Measures”, IRC Client report A3538.2(Ac), 1997.
[3] Blazier, W.E., “RC Mark II: A refined procedure for rating the noise of heating, ventilating, and air-conditioning (HVAC) systems in buildings”, Noise Control Eng., Vol. 45(6), 243-250, (1998).
[4] Beranek, L.L., “Noise and Vibration Control”, (Chapter 9, Sound in Large Rooms), McGraw Hill, New York, (1971).
[5] Barron. M. and Lee, L.-J., “Energy Relations in Concert Auditoria, I”, J. Acoust. Soc. Am., Vol. 84, pp. 618-628, (1988).
[6] L.L. Beranek, "Concert and Opera Halls: How They Sound", Acoust. Soc. Am, (1996)
[7] Houtgast, T., and Steeneken, J.M., “A Review of the MTF Concept in Room Acoustics and Its Use for Estimating Speech Intelligibility in Auditoria”, J. Acoust. Soc. Am., Vol. 77, pp. 1069-1077, (1985).
[8] Anon, “Methods for the Calculation of the Articulation Index”, American National Standard, ANSI S3.5 1969.
![Table 2. Average overall measured noise levels in each of the 10 atria: A-weighted levels and RC mark II procedure [3].](https://thumb-eu.123doks.com/thumbv2/123doknet/14211457.482005/21.918.199.683.328.590/table-average-overall-measured-levels-weighted-levels-procedure.webp)