RESEARCH OUTPUTS / RÉSULTATS DE RECHERCHE
Author(s) - Auteur(s) :
Publication date - Date de publication :
Permanent link - Permalien :
Rights / License - Licence de droit d’auteur :
Bibliothèque Universitaire Moretus Plantin
Institutional Repository - Research Portal
Dépôt Institutionnel - Portail de la Recherche
researchportal.unamur.be
University of Namur
Research note on mapping future abundance distributions of allergenic tree species for risk allergy prediction
Dujardin, Sebastien; Linard, Catherine; DENDONCKER, Nicolas
Publication date: 2021
Link to publication
Citation for pulished version (HARVARD):
Dujardin, S, Linard, C & DENDONCKER, N 2021, Research note on mapping future abundance distributions of allergenic tree species for risk allergy prediction.
General rights
Copyright and moral rights for the publications made accessible in the public portal are retained by the authors and/or other copyright owners and it is a condition of accessing publications that users recognise and abide by the legal requirements associated with these rights. • Users may download and print one copy of any publication from the public portal for the purpose of private study or research. • You may not further distribute the material or use it for any profit-making activity or commercial gain
• You may freely distribute the URL identifying the publication in the public portal ?
Take down policy
If you believe that this document breaches copyright please contact us providing details, and we will remove access to the work immediately and investigate your claim.
BRAIN-be
BELGIAN RESEARCH ACTION THROUGH INTERDISCIPLINARY NETWORKS
BR/154/A1/RespirIT
Research note on mapping future abundance
distributions of allergenic tree species for risk
allergy prediction
26/02/2021
Dr. Sébastien Dujardin
Pr. Catherine Linard
Pr. Nicolas Dendoncker
1. Contents
2. Introduction ... 3
3. Overall approach ... 3
4. Data and method ... 5
5. Results... 8
6. Discusssion ... 13
7. Conclusions... 15
2. Introduction
The main goal of this analysis is to measure the potential impact of land use and climate change on future allergenic tree distributions and, in task 6.3, evaluate the trade-off for allergy risk. Specifically, we thus sought to map future Betula abundances by considering the evolution of both land use and climatic conditions. Land uses constantly evolve and this has an effect on the proportion of greenness in a given neighbourhood. With the growth of urbanization and land artificialization, one may expect green spaces and associated allergenic trees to decrease. Yet, when considering that Betula and
Corylus trees, for instance, are often planted in the vicinity of residential area, this could increase the
abundance of such type of allergenic trees and allergy risk. A comprehensive analysis of this issue must consider how much these two factors may affect each other. Besides, when new residential areas are getting closer to forests containing an important proportion of Betula for instance, this also means people may be more exposed if they live closer to allergenic trees.
3. Overall approach
In order to measure the potential impact of land use and climate change on future allergenic tree distributions, we selected three main scenarii based on 3 plausible storyline that consider the future development of the Belgium economy and population trends. We started our analysis with using VITO’s land use change simulations and retained 3 main scenarii, namely the Business As Usual scenario (BAU), the Global Economy (GE) scenario, and the Sustainability (SUST) (corresponding to VITO’s Regional Community scenario).
Scenario storyline1
General assumption Impact on urban expansion and
allergenic tree species distribution
Impact on residential exposure and respiratory health
BAU Continuation of current trends of population and employment growth and current spatial planning policies
Continued growth, continuing urban expansion and current vegetation trends.
GE Economic growth with decreased trade barriers. Liberal market with little political interference
Strong urban expansion due to little spatial planning. Vegetation decreases steeply as pressure from urbanization reduces green spaces and plant habitats
-The reduction of plant habitats decreases exposure risk to allergenic tree and pollens.
-Biodiversity loss offer less protective effect for allergies.
SUST Reduced international trade, focus on social and environmental measures at a regional scale
Reduced urban expansion. Vegetation increases as land pressure from urbanization is reduced. Additional space is provided for green spaces within cities and plant habitats expand significantly.
-The expansion of plant habitats increases exposure risk to allergenic trees and pollens.
-Added biodiversity provides an increased protective effect for allergies.
1
Scenario storyline adapted from the “Welvaart en Leefomgeving” project of the Dutch Planning Bureaus (CPB, MNP, RPB, 2006)
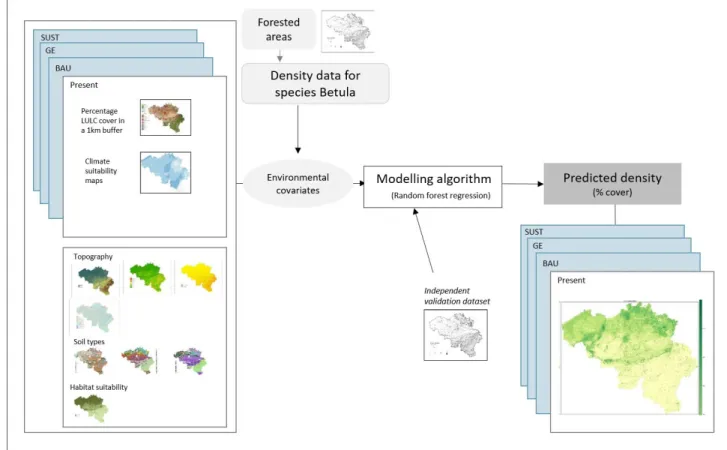
The overall approach was based on the creation of a model that predicts, on a continuous grid map, the abundance of Betula for the current situation and then predicts what would be the abundance in the future using the present situation algorithm but with the corresponding covariate dataset for 2040 (see Figure 1). The selected covariates included LULC information, climate data (temperature and precipitation), soil types, topography, and the habitat suitability maps produced in WP3. While the land use and climate dataset covered both the current and future period, the soil types, topography and habitat suitability covariates were the same for present and future models.
Figure 1. Overall approach for the modelling of Betula densities in 2014 following 3 main climate and land use change scenarii (Business As Usual – BAU; Global Economy – GE; and Sustainability – SUST).
4. Data and method
For land use covariates, the analysis is based othe Land use and land cover (LULC) from the Vlaamse Instelling voor Technologisch Onderzoek (VITO). Indeed, while a land-use map is available for each region (Wallonia and Flanders, but with different scales, thematic resolutions, date of last update, and land use classes. The Walloon map distinguishes between much more land uses organized in five hierarchically nested levels (e.g. the “Carte d’occupation de sol Wallonie, 2007” has 11 subclasses for residential areas while the “Landgebruikskaart Vlaanderen en Brussel” only has 1 residential class). In order to address this issue, VITO developed an integrated detailed land-use map based on a
combination and integration of both land-use types1. By aggregating cells and thereby safeguarding
the total area of each land-use class, it comprises 18 land-use classes and is produced at a spatial resolution of 10 m. While it is available for the year 2018 as a good representation of the current situation, it is also available up to the year 2040 depending on specific land use development scenarii. Each scenario assumes a specific evolution of land use and land cover (LULC) across Belgium and associated green spaces in the future. They mainly picture an increase of artificial land (including residential, commercial and areas) and a decrease of agricultural and natural lands. Differences between scenari resides in the amplitude of those changes with a stronger variation for the GE scenario and weaker changes for the GE; the BAU being the “middle-of the road“ scenario. Land use maps are read-to-use in the format of raster dataset. We extracted 10 categories of land use as to keep only the most relevant categories that best describe allergenic trees’ distributions. These categories included: grassland, deciduous forest, coniferous forest, mixed forest, wetland, residential, commerce and services, industry, park, and water. Then, we computed the proportion of each land use category within a 1 km buffer. Zonal statistics were performed in R using the raster package. This allowed for converting the categorical variable into a continuous one that better describe the broader environmental conditions surrounding each survey points.
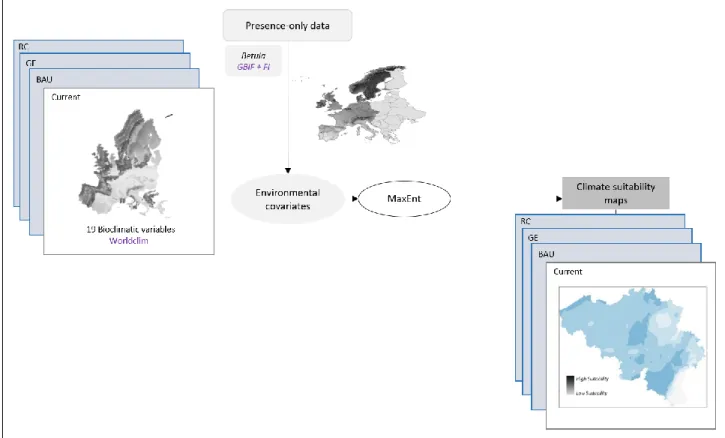
For climate change covariates, we needed to broaden our scale of analysis at the scale of Europe as to encompass the range of climatic conditions that Betula may face in the future (see Figure 2). We produced these maps using Maxent algorithm in order to specifically predict the habitat suitability of
Betula for the current and future situation. First, we collected data from the Worldclim website where
19 bioclimatic variables are provided for the current situation (historical records for the 1970-200 period) as well as for the future situation (2021-2040 period). These bioclimatic provide a set of specific indicators of temperature and precipitation variations and vary depending on shared
1 This integrated map was built as part of the research project entitled “GDrought-related vulnerability and risk assessment of groundwater resources in Belgium (GroWaDRISK)” See https://growadrisk.marvin.vito.be/growadrisk_results.html for more details).
economic pathways (SPPs) and the corresponding projections of future greenhouse gas emissions. We selected the SSP1-2.6, SSP2-4.5, and SSP5-8.5 as to match with our land use change storylines (SUST, BAU, and GE respectively). For each scenario, we collected outputs from 6 Global Circulation Models (GCM) available for download (BCC-CSM2-MR, CM6-1, CNRM-ESM2-1, CanESM5, MIROC-ES2L, and MIROC6). All layers were provided with a spatial resolution of 2.5 minutes (~4km). Second, we collected Betula observation records from the GBIF database and created a presence-only dataset at the scale of Europe. We applied filters as to collect the most reliable observations, including the selection of data from the 2008-2018 period, the inclusion of Betula pubesens or Betula pendula species only, and setting a 1km spatial resolution threshold for coordinates uncertainty. We discarded non-verified data, data flagged with a spatial-resolution related issue, and data without XY coordinates. We ran Maxent using the dismo and
ENMeval packages in R. We created 10.000 random background points and selected the
‘checkboard2’ method at a spatial grid of 3 by 3 degrees. Model parameters included RMvalues of 0.5,1.0,1.5,2.0 and Fc=’L’,’LQ’,’LQH’. The best model selection was based on minimizing the AICc and maximizing the AUC. This procedure was replicated 6 times for the 6 Global Circulation Model and averaged as to keep only one map for our subsequent analysis. We used the MESS (multivariate similarity surface) to evaluate whether there are some areas where one or more variables are outside the range present in the training dataset. Maps showed that observation records across Europe covered the range of climatic conditions expected across Belgium by 2040.
Figure 2. Overall approach for the modelling of climate suitability across Europe and Belgium using 19 bioclimatic variables and presence-only data from the GBIF database and forest inventories
Once all covariates (land use, climate suitability, topography, soil types, and habitat suitability) were set for modelling, we then reproduced the Random Forest (RF) regressions performed in WP3 as to model present Betula densities. Using basal area (m²/a) as the dependent variable, we computed a new model using R studio. We followed a 15 folds cross-validations scheme using 70% of the data for training and the remaining 30% for testing the model performance. R squared reached 0.43 with a mtry of 2. Building upon this RF model, we finally ran the model for predicting future Betula densities and computed a continuous grid map showing predicted Betula abundance for three land use and climate change scenarii.
5. Results
Climate suitability maps resulting from the Maxent modelling suggest that changes in temperature and precipitation may contribute to the reduction of climate suitability of Betula trees as this species
prefers cold and humid weather (see model response curves in Appendix 9.1). By 2040, our model suggest that climate suitability will be even lower within areas of higher altitudes, while lowland remain best suited for the development of Betula L. trees (see Figure 4). Yet, maps did not show any distinguishable pattern between the three future greenhouse gas emission scenarii (Business As Usual – BAU, Global Economy – GE, and Sustainability – SUST). Only small, non-significant changes were observed when comparing climate suitability patterns between the BAU, GE, and SUST scenarii (see Figure 4).
Figure 3. Variable importance for the 19 bioclimatic variables in percent contribution (left) and permutation importance (right)
Figure 4. Climate suitability maps for Betula tree species according to the present situation and three climate change scenarii (Business As Usual – BAU; Global Economy – GE; and Sustainability – SUST).
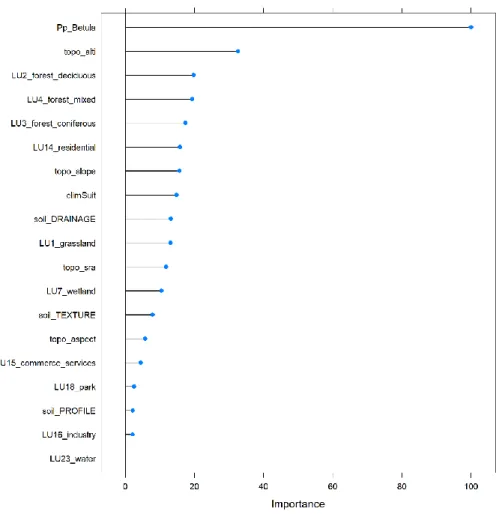
Results from the RF modelling follow a similar pattern to Betula densities observed in maps produced in WP3 with more detailed datasets. Betula is mainly distributed in the northern part of the country at lower altitudes. Densities tend be lower in agricultural areas and higher in areas covered by mixed land uses or forest cover. This similarity can be explained by the very high importance of the habitat suitability covariate used in this model. Indeed, variables importance figures places habitat suitability maps as the most important covariate; then, come altitude, forest cover (deciduous, mixed and coniferous), residential areas, slope and climate suitability in 8th position of importance (see Figure 5). Meanwhile, such a low ranking of climate suitability suggests that temperature and precipitation play a lower role in predicting the abundance of Betula compared to land use variables such as forest cover.
Figure 5. Variable importance plot for the modelling of predicted abundance
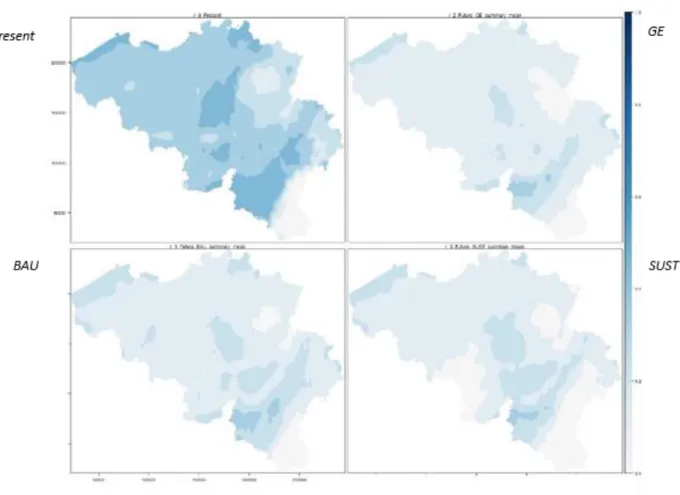
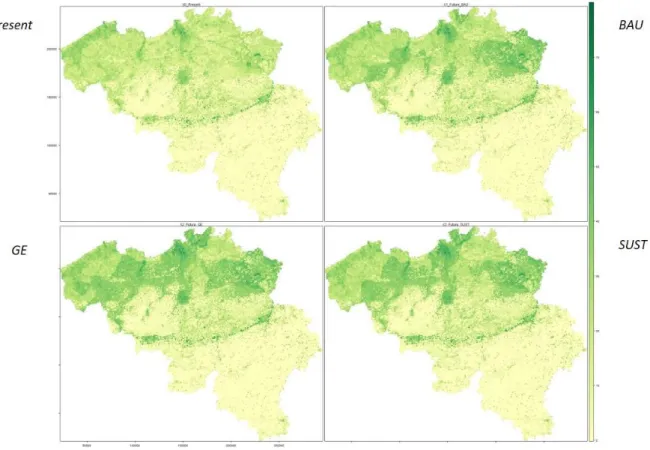
Land use change may therefore be of higher importance for explaining the evolution of future Betula distribution, including the proportion of land dedicated to both urbanizable land and forest cover. As Figure 6 suggests, the overall patern of abundance distributions remain the same the present and the three future greenhouse gas emission scenarii (Business As Usual – BAU, Global Economy – GE, and Sustainability – SUST). When calculating the net difference per pixel (see Figure 7), changes of density ranging from -30% to +30% can be observed with, on the one hand, a decrease of Betula trees abundance in areas where urbanizable land is available (southern periphery of Brussels and areas located outside densely populated areas of Wallonia). On the other hand, areas with less urbanizable land available and high climate suitability (e.g. northeastern area of Brussels) observe an increase of abundance for all three scenarii (BAU, GE, and SUST scenarii).
Figure 6. Maps showing the predicted abundance (% cover) of Betula L. across Belgium for present and three future land use and climate change scenarii (Business As Usual – BAU, Global Economy – GE, and Sustainability – SUST).
Figure 7. Maps showing the % cover differences of Betula L. across Belgium between present and three future land use and climate change scenarii (Business As Usual – BAU, Global Economy – GE, and Sustainability – SUST).
6. Discusssion
The main objective was to map the spatial distribution of allergenic tree species across Belgium for the year 2040. We designed and implemented a method that allowed for producing these maps, but this task showed being rather challenging for several reasons. These reasons are detailed below and should be considered both as important limitations for the applications of the results presented here and opportunities for future research.
a. Tree species selection. The selection of allergenic tree species for this research stopped at the genus level because it does not make any difference for allergy symptoms whether pollens responsible for allergies come from a Betula pubescens of Betula pendula. For understanding distributions of Betula tree species in the future, however, this proved being more problematic.
Betula pendula is a very common species that adapts to many types of environments. On the
opposite, Betula pubescens, grow in more specific habitats as it is mostly found in higher altitudes and harsher environments (higher humidity, colder temperatures, etc.). Aggregating those two species made it difficult to understand how species’ abundance may be impacted by land use and climate change over time. In the stage of modelling climate suitability, interpretations came to be contradictory depending on whether we would consider Betula
pubesens or Betula pendula.
b. The time horizon should be expanded further as to account for more significant land use and climate changes. The 2040 horizon is very near in the lifetime of a tree species. In 20 years’ time, environmental conditions may not change significantly enough to affect species’ distribution, especially in the case of Betula pendula which has a high capacity to adapt in many types of environments. On the one hand, patterns of greenhouse gas emissions are not clearly distinct when we look at the emission projection curves provided by the CMIP6 and SSPSs scenarios. On the other hand, the strong inertia of the built environment does make the artificialization of land significantly different between 2018 and 2040, especially in the
norther part of the country where vacant lots are getting seldom. These factors partly explain why no clear pattern emerged between maps produced for each scenario. In this regard, additional land use change scenario should be produced and made available as to provide, for example, a scenario where the net change of artificial land is negative (by converting residential or industrial land into natural land) and therefore applying the principle of ‘regreening cities’.
c. The covariates collected here were meant at characterizing the surrounding environmental conditions of Betula records, but gathering these covariates for both the present and future environmental conditions was challenging. Here, only the climate and land use change covariates were available for both the present and future conditions. The very high importantce of the variable “habitat suitability” (Pp_Betula reported in Figure 5) show its strong importance for predicting Betula abundance. However, this covariate was not computed for 2040. This introduces a major bias to the analysis as we hypothesize that species’s habitat suitability will not change in 20 years time.
d. The model presented here does not consider any specific variable accounting for the reasons why some Betula stands are spontaneous, grown on purpose (e.g. for commercial use), or planted for ornamental reasons. No information on land tenure was included either (e.g. private domain, public forests, etc.). Yet, this type of information could have a great explanatory power of Betula distributions. Further research should align covariates that better capture forest management practices and individual factors both in the private and public spaces.
7. Conclusions
In summary, the main objective was to map the spatial distribution of allergenic tree species across Belgium for the present (WP3) and future (WP6). In WP 3 we looked specifically at 3 main types of trees, i.e. Alnus (Alder), Betula (Birch), and Corylus (Hazelnut), while we focused only on Betula in WP6. In order to produce a continuous map, we used an advanced ecological modelling technique called “species distribution modelling”. These techniques build upon a set of tree occurrence records to predict the probability of finding these trees at locations where no record exist. First, we collected tree occurrence records from forest inventories (Flanders & Wallonia) and the open citizen science data platforms (observations .org and GBIF) where anyone can share an observation of animals or plants on a volunteer basis. Second, we used several computer algorithms (Random Forest in WP3 and Maxent in WP6) to build a set of statistical relationships between the observed trees and the local environmental conditions (e.g. soil types, slope or precipitation, etc.). In WP3, this allowed producing a continuous map of Alnus, Betula and Corylus covering both urban and rural areas at a fine resolution of 1ha (100x100m). This method was then adapted for predicting Betula densities in 2040 under three climate and land use change scenarii (Business As Usual – BAU, Global Economy – GE, and Sustainability – SUST). Results showed that, in 20 years’ time, climate change may contribute to the reduction of tree density of Betula trees as this species prefers cold and humid weather. However, land use and land cover factors showed being of higher importance, suggesting that future densities of allergenic tree will highly rely upon forest management practices and individual interventions both in the private and public spaces. Future research work also needs to focus on larger time period as 20 years ahead from now is very near in the lifetime of a tree species.