Design and Numerical Analysis of an
Unconventional Surface-Piercing Propeller for
Improved Performance at Low and High Speeds
by
Justin Richard Parker
B.S. Aerospace Engineering, University of Maryland (2008)
Submitted to the Department of Mechanical Engineering
in partial fulfillment of the requirements for the degrees of
Naval Engineer
and
Master of Science in Mechanical Engineering
at the
MASSACHUSETTS INSTITUTE OF TECHNOLOGY
June 2017
@
Massachusetts Institute of Technology 2017. All rights reserved.
Author
Certified by...
Certified by...
.. .. ... . .. ... .... . ... .... . . .
Depart
of Mechanical Engineering
--
--%
May 12, 2017
. . . . ....................
Stefano Brizzolara
Associate Professor of Ship Dynamics, Virginia Tech
Thesis Supervisor
. . . .
. . . .
S..
Michael S. TriantafyllouProfessor of Mechanical and Ocean Engineering
Thesi Supervisor
A ccep ted b y ...
...
Rohan Abeyaratne
Chairman, Department Committee on Graduate Students
OF TEQHNOLOGY.
JUN
2
12017
LIBRARIES
Design and Numerical Analysis of an
Unconventional Surface-Piercing Propeller for
Improved Performance at Low and High Speeds
by
Justin Richard Parker
B.S.
Aerospace Engineering, University of Maryland (2008)
Submitted to the Department of Mechanical Engineering
in partial fulfillment of the requirements for the degrees of
Naval Engineer
and
Master of Science in Mechanical Engineering
at the
MASSACHUSETTS INSTITUTE OF TECHNOLOGY
June 2017
@
Massachusetts Institute of Technology 2017.
Author...
Certified by...
All rights reserved.
Signature
redacted-Departie(of Mechanical Engineering
Signature redacted
V St
May 12, 2017
4ano Brizzolara
Associate Professor of Ship Dynamics, Virginia Tech
OF TEQHNOLOGY.
JUN
2
12017
LIBRARIES
Design and Numerical Analysis of an Unconventional
Surface-Piercing Propeller for Improved Performance at Low
and High Speeds
by
Justin Richard Parker
Submitted to the Department of Mechanical Engineering on May 12, 2017, in partial fulfillment of the
requirements for the degrees of Naval Engineer
and
Master of Science in Mechanical Engineering
Abstract
Traditional propellers operate fully submerged, with cavitation limited as much as possible in order to minimize its disruptive and damaging consequences. Conversely, supercavitating propellers operate in an encompassing vapor cavity, thereby averting these negative effects while substantially reducing drag on the blades. Surface-piercing propellers, operating under a similar concept as supercavitation, often achieve even greater efficiency by drawing in an air cavity from the free surface. Existing small craft have demonstrated the ability of such propellers to yield extremely high speeds (110+ knots); nevertheless, the full potential of these propellers has yet to be explored. In particular, designs often neglect low-speed performance, focusing solely on high-speed operation. This research therefore developed a new surface-piercing propeller concept designed instead to maximize performance across the spectrum of operating speeds. Applying established theory for supercavitating hydrofoils, the new blades were shaped based on theoretical maximally-efficient two-dimensional profile sections.
Further-Results from both the 2D and 3D CFD simulations revealed promising benefits to propulsive efficiency. High-speed performance met or exceeded that of the baseline propeller, and low-speed performance showed significant improvement. This surface-piercing propeller concept offers an unconventional design with convincing results for balanced low- and high-speed operation.
Thesis Supervisor: Stefano Brizzolara
Title: Associate Professor of Ship Dynamics, Virginia Tech Thesis Supervisor: Michael S. Triantafyllou
Acknowledgments
I would like to thank Professor Stefano Brizzolara not only for his support and guid-ance in this thesis project but moreover for his inspiration throughout my graduate education. From the first lecture he gave in 2.701 Introduction to Naval Architecture nearly three years ago, his passion for his work shone through as clearly as his superior knowledge and expertise in the subject. This passion was infectious, and I was instantly captivated by the field of high-speed hydrodynamics. Soon after agreeing upon a thesis topic, I discovered that not only was Professor Brizzolara's dedication to his field exceptional but so too was his dedication to his students. Always taking the time to thoroughly explain complicated concepts (in the simplest terms when necessary) and providing significant thesis guidance from start to finish, he ensured that I grasped both the underlying theories as well as the analytical procedures in order to conduct substantive research. My only regret is that he left MIT for Virginia Tech! Nevertheless, Professor Brizzolara, I wish you all the best in your already highly-accomplished career.
I would also like to thank John Scherer of Mercury Marine, who generously contributed his propeller data for the design and analyses in this thesis. In addition, he was always prompt to reply with further details, or even a hand-drawn diagram to help explain propeller concepts. Dr. Scherer, thank you for all your support!
Of course I must thank my parents, Drs. Soon Park and Richard Parker, not only for their love and support throughout my entire life but in particular for their inspiration in higher education. As a graduate college professor herself, my mom continues to motivate me to be the best student possible (and thus has often been that voice in my head telling me to "stop procrastinating!") and to always push myself to learn more, study harder, absorb knowledge at every opportunity. As a medical doctor, my dad has demonstrated the significant impact of higher education throughout his accomplished career. The success of both my parents in their professions will forever inspire me to achieve my own success through hard work and the continual pursuit of knowledge.
Contents
List of Figures 9
List of Tables 11
List of Symbols 13
1 Background 15
1.1 Cavitation and Its Damaging Effects . . . . 16
1.2 Supercavitation and Its Application to Propellers . . . . 18
1.3 The Surface-Piercing Advantage . . . . 20
1.4 The SCSB Hydrofoil . . . . 22
2 Theory 25 2.1 Supercavitating Flow . . . . 26
2.1.1 Superventilation . . . . 27
4 New Propeller Design 4.1 Design Objectives ...
4.2 Hydrofoil Profile Development 4.2.1 JST Profile . . . .
4.2.2 J5T Profile . . . .
4.3 Strength Verification . . . . . 4.4 3D Blade Generation . . . . . 5 Full Propeller Analysis
5.1 Simulation Setup . . . . 5.1.1 Overset Mesh and Regions . . . . . 5.1.2 Physics Models . . . . 5.2 Discussion of Overall Flow Characteristics
5.2.1 Flow Discontinuity . . . . 5.3 Thrust and Torque Results . . . . 6 Conclusion and Recommendations
6.1 Assessment of Final Propeller Design ...
6.2 Recommendations for Future Work . . . . A Matlab Code for 3D Geometry
References 45 . . . . 46 . . . . 47 . . . . 47 . . . . 49 . . . . 5 2 . . . . 53 57 . . . . 59 . . . . 59 . . . . 6 1 . . . . 6 3 . . . . 7 1 . . . . 73 87 88 91 93 95
List of Figures
1-1 Cavitation Damage . . . . 16
1-2 Ghost Naval Prototype Craft . . . . 19
1-4 Fountain Lighting Racing Craft . . . . 21
1-3 Fountain Lighting Racing Craft . . . . 21
1-5 SCSB Hydrofoil Geometry . . . . 22
2-1 Visualization of Supercavitation Vapor Cavity . . . . 26
2-2 Convair F2Y Sea Dart Supersonic Seaplane . . . . 28
2-3 Example J3T and J5T Profiles . . . . 31
3-1 Baseline Propeller (Front and Side Views) . . . . 37
3-2 Baseline Propeller (Isometric Views) . . . . 37
3-3 Mercury Baseline 2D CFD (Lift & Drag) . . . . 42
3-4 Mercury Baseline 2D CFD (Volume of Fluid) . . . . 43
4-1 J3T Profile at r/R = 0.7 . . . . 48
5-2 Simulation Setup: Overset Region . . . . 62
5-3 Simulation Setup: Total Mesh . . . . 62
5-4 Volume Fraction of Air Comparison (Baseline Advance Ratio) . . . . 66
5-5 Propeller Surface Pressure Comparison (Baseline Advance Ratio) . . 66
5-6 Volume Fraction of Air Comparison (1/2 Advance Ratio) . . . . 67
5-7 Propeller Surface Pressure Comparison (1/2 Advance Ratio) . . . . . 67
5-8 Thrust vs. Time for All Simulations . . . . 68
5-9 Torque vs. Time for All Simulations . . . . 68
5-10 Baseline Propeller: Thrust Per Blade at Baseline Advance Ratio . . . 69
5-11 J5T Propeller: Thrust Per Blade at Baseline Advance Ratio ... 70
5-12 Free Surface View of Flow Discontinuity . . . . 72
5-13 Baseline Propeller: Total Thrust at Baseline Advance Ratio . . . . . 75
5-14 Baseline Propeller: Total Thrust at 2/3 Advance Ratio . . . . 76
5-15 Baseline Propeller: Total Thrust at 1/2 Advance Ratio . . . . 77
5-16 Baseline Propeller: Total Torque at Baseline Advance Ratio . . . . . 78
5-17 Baseline Propeller: Total Torque at 2/3 Advance Ratio . . . . 79
5-18 Baseline Propeller: Total Torque at 1/2 Advance Ratio . . . . 80
5-19 J5T Propeller: Total Thrust at Baseline Advance Ratio . . . . 81
5-20 J5T Propeller: Total Thrust at 2/3 Advance Ratio . . . . 82
5-21 J5T Propeller: Total Thrust at 1/2 Advance Ratio . . . . 83
5-22 J5T Propeller: Total Torque at Baseline Advance Ratio . . . . 84
5-23 J5T Propeller: Total Torque at 2/3 Advance Ratio . . . . 85
5-24 J5T Propeller: Total Torque at 1/2 Advance Ratio . . . . 86
6-1 Thrust Analysis: KT vs. J . . . . 89
6-2 Thrust Analysis: KQ vs. J . . . . 89
6-3 Open Water Propeller Efficiency . . . . 90
List of Tables
3.1 Baseline Propeller Geometry and Operating Parameters . . . . 38
3.2 Baseline Blade Profile Dimensions (Given) . . . . 40
3.3 Baseline Blade Profile Operating Parameters (Calculated) . . . . 40
3.4 Mercury 2D CFD Results . . . . 41
4.1 J5T 2D CFD Results . . . . 50
4.2 Mercury and J5T Strength Comparison . . . . 52
5.1 Advance Ratios and Speeds for 3D CFD Simulations . . . . 58
5.2 Thrust and Torque Results (before discontinuity) . . . . 74
List of Symbols
C Blade Section Chord [m]
c Distance Along Blade Section Chord [m]
CD Blade Section Drag Coefficient CL Blade Section Lift Coefficient
D Drag [N]
d Propeller Diameter [m]
12 Area Principal Moment of Inertia [m4] J Propeller Advance Ratio
KQ Propeller Torque Coefficient
KT Propeller Thrust Coefficient
L Lift [N]
rh Mass Flow Rate [kg/s
N Number of Propeller Blades n Propeller Rotative Speed [HzJ
P Pressure [Pa]
Q
Torque [N-m]R Propeller Radius [meters]
aphase Phase concentration (where phase is liquid, vapor, or air)
/3 Inflow Angle [deg]
r7P Open-Water Propeller Efficiency A Dynamic Viscosity [Pa-s
2 Kinematic Viscosity [m2
/sI
Q Vorticity [Hz]
(P Pitch Angle [deg]
p Density [kg/m'J
- Cavitation Number
Chapter 1
Background
Traditional propellers operate fully submerged, at relatively low speeds, with cavi-tation effects limited as much as possible. This report instead explores a partially-submerged, high-speed propeller optimized for operation in a fully-cavitated state. By harnessing the benefits of supercavitating hydrofoil design combined with surface-piercing operation, this unconventional propeller aims to achieve significant hydro-dynamic efficiency for high-speed watercraft. Furthermore, the design specifically targets increased efficiency in the low speed regime - an area generally neglected in high-speed propeller design - without sacrificing overall performance.
An overview of cavitation is presented, noting how it is a phenomenon to be avoided in marine engineering. On the contrary, supercavitation offers significant hydrodynamic advantages while avoiding the unfavorable effects of cavitation; it is discussed in general here, and its applicable theory is presented in greater detail in Chapter 2. We then present two unique features to the propeller of this report: surface-piercing operation and an exclusive hydrofoil trailing edge design known as
1.1
Cavitation and Its Damaging Effects
Cavitation, in general, is an extremely undesirable phenomenon in marine applica-tions. Resulting from local fluid pressure dropping below the vapor pressure of the liquid, cavitation is the formation of vapor cavities that serve to disrupt the flow around them. These bubbles are both quick to form and quick to implode, causing shock to the body. Although generally small and localized, these implosions can add up to induce significant detriments to the system, such as:
" Flow disturbance, causing undesireable changes in the hydrodynamic prop-erties (i.e. a reduction in lift);
" Mechanical vibrations, which can cause hydro-acoustic noise and system wear;
" Material damage, in the form of surface erosion [25].
Figure 1-1: The pitfalls of cavitation: propellers showing significant pitting damage [29]
For example, cavitation is notori-ously the cause of pitting damage on propellers, where the surfaces of the propeller blades become covered in pits where pockets of material have eroded. Eventually, this damage can become so severe as to render the propellers unus-able, as shown on the discarded blades of Figure 1-1. All of these negative con-sequences lead marine engineering text-books to advise "designing and operat-ing... to avoid cavitation and its adverse effects on performance" [25].
Cavitation as related to marine propulsion was first scientifically observed in 1894 by Sir Charles Parson in the United Kingdom. He built the first cavitation tunnel to study the causes and effects of cavitation on propellers. His research led to changes in propeller design that created successful noncavitating propulsors capable of avoiding the negative effects of cavitation. However, such designs imposed limitations on speed; attempts to use these
designs on higher-speed vessels once again brought about damaging consequences. The interwar German Navy, for example, applied noncavitating propeller designs to fast destroyers and torpedo boats, and the result was that "in 200 hours of full-speed cruising the indicated screw propellers would acquire such a damage (erosion blisters of size of a fist)... that their replacement became inevitable" [1]. To effect higher speeds without such devastating effects, a new approach was required.
1.2
Supercavitation and Its Application to
Propellers
When applied in a certain manner, cavitation can in fact be harnessed to gain hydro-dynamic advantages. Specifically, the application of supercavitation can precipitate significant advances in maritime speed and efficiency. Whereas "cavitation" refers generally to the development of vapor bubbles on a submerged body to rapid pressure changes, "supercavitation" signifies that those individual cavities have been replaced by a single large cavity that envelopes an entire surface. This cavity is sufficiently strong so as to avoid collapsing around the body, instead delaying the collapse until it is harmlessly far downstream. In this way, the body is not subject to the repeated implosions that are the cause of so many detrimental effects on submerged bodies.
By reaching the supercavitating stage, not only is cavitation damage avoided but furthermore considerable hydrodynamic efficiency may be gained. With a substantial portion of the submerged body covered in a vapor cavity, drag on that body is
significantly reduced. Owing to the lower viscosity of vapor as compared to liquid, the
submerged body encounters considerably less resistance in the encompassing cavity. It is therefore possible to achieve drastically higher speeds with a body designed to achieve supercavitation than with a body designed to avoid it.
Systematic analysis of propellers designed to leverage rather than avoid cavitation began in 1941 under the Russian scientist Valentin Lvovich Pozdunin. He designed and tested propellers that operated in the supercavitating regime, proving that erosion could be avoided with a sufficiently strong cavity that avoided collapse until far enough downstream of the blade. His research, however, revealed several challenges with supercavitating blade design:
* Structural strength: supercavitating profiles must have thin leading edges, which may lead to insufficient local strength of the blade on a full-size propeller; " Cavity strength: at full cruising speed, the cavity must have sufficient length
and thickness so as to withstand fluctuations without any local collapse; " Profile shape: in order to purely optimize supercavitation, the ideal profile
shape is a wedge, rather than the traditional hydrofoil profile; while ideal for su-percavitation, this shape is not optimal for overall hydrodynamic performance;
* Subcavitating performance: in order to overcome the "cavitation barrier" (i.e. before sustained supercavitation is achieved), the propulsor must be able to produce sufficient thrust at lower speeds in the subcavitating regime [1].
These points became areas of critical emphasis for all supercavitating designs, and accordingly they are each addressed for the propeller of this report.
Despite the challenges associated with supercavitating propellers, their ef-ficacy has been repeatedly demonstrated in the decades since Pozdunin. Amer-ican research in the subject began in the 1950s at the U.S. Navy David Tay-lor Model Basin, resulting in a wealth of model tests confirming theoretical predictions. The following decade the Canadian navy applied supercavitating
propellers to their Bras d'Or hydrofoil Figure 1-2: Ghost naval prototype craft ship, evidencing the capability of these featuring supercavitating propellers [16] propellers to drive the 235-ton craft to
speeds in excess of 60 knots [10] [1]. Today, while many high-speed boats have turned to waterjet propulsion, supercavitating propellers nevertheless continue to find substantial employment in a multitude of fast watercraft. The Juliet Marine
Ghost (Figure 1-2), an advanced submerged waterplane twin hull (SWATH) naval
prototype, is one recent example of a craft employing supercavitating propellers to achieve efficient high speeds
116].
1.3
The Surface-Piercing Advantage
As Pozdunin discovered, supercavitating propeller designs must deal with several challenging criteria to ensure that the blades are effective at leveraging the benefits of supercavitation. To guarantee cavity initiation and sustainment, the submerged body must attain high speeds and have a sharp leading edge in order to develop sufficient pressure differential. Once sustained, the cavity will allow the body to operate efficiently at high speed, however the power required to overcome this "cavitation barrier" may offset gains in operational efficiency. The characteristics of
surface-piercing propellers offer the potential to mitigate these transient challenges while still
reaping the benefits of supercavitating hydrodynamics.
Surface-piercing propellers work under the same general concept as supercavitat-ing propellers: to operate in an envelopsupercavitat-ing cavity so as to avoid the negative effects of cavitation, and in doing so achieving superior efficiency by way of significantly reduced drag. The difference is that whereas supercavitating propellers rely on a substantial pressure differential to instigate cavitation, surface-piercing propellers exploit the air above the free surface to mimic cavitation. These propellers sit partially submerged, with generally only one-third of the diameter below the surface. Therefore, with each rotation, air is drawn in with the blades. The result is an air cavity surrounding the blades - that is, ventilation rather than cavitation. Consequently, several distinct advantages may be realized over their submerged counterparts:
" Supercavitation benefits can be gained from nearly the onset of rotation, owing to the air cavity being pulled in straight from the free surface rather than requiring sufficient rotative speed to develop a pressure differential;
* Appendage drag is reduced, as the propulsion gear is elevated out of the water; " Propeller draft below the keel is minimized, supporting shallow-water operations
[38].
The two conditions of ventilation and cavitation and their overall hydrodynamic effects however are generally the same, and as such the terms may be used inter-changeably when discussing surface-piercing propellers
[25].
Moreover, due to the similarity of the phenomena, surface-piercing propellers benefit from the same designFigure 1-4: Fountain Lighting racing craft featuring Mercury surface-piercing propellers [32]
considerations as for supercavitating propellers. This report's design therefore seeks to leverage the advantages of both supercavitating and surface-piercing concepts.
Surface-piercing propellers are em-ployed on a number of high-speed racing craft, such as the Fountain Lighting (Fig-ure 1-4). This craft sports four Mercury Marine supercavitating propellers which allow the vessel to achieve speeds in excess of 100 knots. These Mercury propellers form the baseline for design and comparison of this report's concept propeller.
benefits, surface- Figure 1-3: Mercury Racing M8 inboard drive In addition to the beeis ufc- surface-piercing
1.4
The
SCSB
Hydrofoil
Throughout the development of supercavitating and surface-piercing propeller design, the focus has remained predominantly on high-speed effectiveness. Little attention has been given to low-speed performance, an important regime not only for general transit efficiency (for example, transiting in and out of harbors) but also for achieving rapid acceleration to full cavitation speeds. Dr. Stefano Brizzolara of MIT sought to address this issue in 2015 with the development of a new family of hydrofoils, termed
SCSB. These foils combined a traditional supercavitating profile with the advent of a new "tail" design, as illustrated in Figure 1-5. The tail, shown in blue, exists entirely in the vapor cavity when at fully cavitating speeds and therefore does not impede the foil's supercavitating performance. At lower, subcavitating speeds, however, the tail induces markedly improved performance. Whereas the traditional blunt trailing edge causes significant vortex drag, the tail not only offsets this energy loss but also provides a number of additional benefits. The key advantages of the SCSB profile include:
" Increased lift by adding effective camber;
* Reduced pressure drag by eliminating the blunt trailing edge;
" Improved strength by increasing the foil's sectional area and inertia modulus [5].
Cavity-cornpliant Back Profile Back Caviao
Sharp Trailng Edge T
Super-cavitating Face Profile
---Figue 1Face Cavita
Numerical analysis of 2D hydrofoil profiles has demonstrated that the SCSB tail can produce subcavitating L/D efficiency over three times greater than traditional blunt-end profiles. This superior performance in subcavitation serves to benefit high-speed propellers by "minimizing the required thrust or propulsion power (directly dependent on the hydrofoil drag)... [which] will cause less engine overload at low revolutions or during accelerations" [5].
Dr. Brizzolara has continued his exploration into the feasibility of the SCSB profile as applied to support and control surfaces of high-speed craft; however, this research is the first to apply the concept directly to a propeller.
Chapter 2
Theory
To understand the principles by which the propeller of this report achieves effective high-speed operation, a mathematical overview of supercavitating flow is presented. We then discuss the development of supercavitating hydrofoil profiles fundamental to this propeller's design. Specifically, we outline the work of Virgil E. Johnson who performed landmark research on hydrofoils operating near the water's surface; his theory forms the backbone of our propeller's ability to achieve and sustain supercavi-tating flow. Finally, in order to qualify the numerical methods used to analyze the 2D hydrofoils and 3D propellers of this report, the principles behind the computational fluid dynamics (CFD) simulations are discussed with regard to unsteady multiphase flows.
2.1
Supercavitating Flow
Cavitation in a liquid is defined by the nondimensional cavitation number o, where
PO - PC
q (2.1)
This equation presents the difference between the local absolute pressure po and the vapor pressure Pc, comparing that differential to the dynamic pressure q, where
Po = Patm + Pgh (2.2)
and
q = 0.5 pV2 (2.3)
Given a depth h below the water and speed V through the water, o defines the potential of the flow to cavitate. High values of a indicate that the flow is unlikely to cavitate, whereas low a effects cavitation.
Reducing a will result in increasingly large vapor cavities extending further down-stream of a submerged body in motion. When the cavitation number is sufficiently low, the cavity will extend several chord lengths while completely enclosing the suction (upper) surface of the body; meanwhile, the far-downstream cavity collapse will not impinge upon the body or its hydrodynamic characteristics. Such flow is defined as
supercavitating [151. Figure 2-1 shows a CFD example of this type of long vapor
cavity (illustrated in red) resulting from supercavitation on a hydrofoil.
Volume Fraction of vapor
0 0.2 0.4 0.6 0.8 1
Figure 2-1: CFD example of a vapor cavity extending downstream (to the right) off a hydrofoil in full supercavitation mode
A low cavitation number - and thus supercavitating flow - may be achieved by
either increasing the cavity pressure or the body's velocity. For the application of surface-piercing propellers and hydrofoils in general, the cavity pressure is fixed by the constant depth of operation and assumed-constant water temperature (subject to variability but beyond control). Velocity therefore becomes the primary characteristic that determines cavitation, and as such supercavitating bodies typically operate at very high speeds.
2.1.1
Superventilation
One significant caveat to the need for high speed in order to achieve supercavitation is the ability of air to substitute for the vapor cavities. When a large quantity of air is continuously supplied to the flow around a body with a separated boundary layer, the air occupies the separated region. If this quantity is sufficiently large, very long ventilation cavities will result regardless of the stream velocity. In this way, the hydrodynamic profile of supercavitation can be achieved at lower speeds than otherwise required.
Hydrofoils operating on the water surface - such as the blades of surface-piercing propellers - benefit from this phenomenon by drawing in significant amounts of air from the atmosphere. The air is entrained in the separated flow from the suction side of the foils, resulting in superventilation that covers the non-pressure regions in the same manner as vapor cavities from supercavitation. Furthermore, at small depths of submersion on the free surface, the cavity pressure is approximately equal to the ambient pressure and thus the cavity number is nearly zero. Accordingly, surface-piercing propellers are able to achieve supercavitating efficiencies at a wider range of operating speeds
115].
2.2
Johnson's Theory for Supercavitating
Hydrofoils
In 1961 NASA scientist Virgil E. Johnson published his research in the concepts of supercavitation and superventilation in his seminal report Theoretical and
Experimen-tal Investigation of Supercavitating Hydrofoils Operating Near the Free Water Surface.
Motivated by the advent of extremely high-speed craft such as the Convair F2Y Sea Dart supersonic seaplane (Figure 2-2), he sought to improve their performance as they rode on the water surface. Existing craft like the Sea Dart had been employing "hydro-skis" to skim along the surface, but Johnson believed that superior performance could be achieved through supercavitating hydrofoils.
The challenge for hydrofoils was that, as they approach the free surface, "the low-pressure side of the hydrofoil almost always becomes ventilated from the at-mosphere," which "results in a severe and usually abrupt loss in lift and a reduction in the lift-drag ratio," a reduc-tion that could exceed 75% [15]. Rather than trying to avoid the occurrence of
ventilation, however, Johnson's solution Figure 2-2: High-speed craft traveling on the was to embrace it. Building upon earlier water's surface, such as the Convair F2Y Sea . Dart supersonic seaplane, motivated Johnson to
explore supercavitating hydrofoils [21]. and M.P. Burkart, in his report Johnson
presents theoretical approaches to develop supercavitating profiles that leverage the advantages of operating within a cavity.
Validating his theory with actual experimental results, the outcome was a series of equations that define the ideal shape of hydrofoil profiles that maximize lift and minimize drag while operating in supercavitation. Two series of his equations
-Johnson's 3-term and 5-term profiles - formed the basis of the propeller design of this report.
2.2.1
Tulin-Burkart
The derivation of Johnson's equations stemmed from the famous work of Tulin-Burkart on Linearized Theory for Flows About Lifting Foils at Zero Cavitation Number [36]. This theory applied to cambered surfaces (with positive pressure on the lower side) at small angles of attack and camber. Their analysis stemmed from developed thin-airfoil theory, wherein the airfoil equations for lift, drag, and vorticity were applied to hydrofoils. The resultant Tulin-Burkart equation for hydrofoil lift/drag efficiency is:
CL
4(12A)2= 4 1 - (2.4)
CD 2A, ) CL
where the coefficients A1, A2 are the thin-airfoil coefficients derived from the
sine-series expansion of the airfoil vorticity distribution. This distribution Q(x) is defined by:
Q(x) = 2V Ao cot
(
+ A, sin(nO) (2.5)n=1
where 0 is the parameter defining the distance along a hydrofoil chord such that
c
X = -( - cos0) (2.6)
2
The coefficients A1 and A2 serve to identify the desired input into Equation 2.4:
for the maximum lift-drag ratio CL/CD (equivalent to L/D), the term A2/A1 must
be minimized. In order to determine the values of these coefficients, the vorticity distribution of Equation 2.5 is considered with the assumption that only the upper surface is enveloped by the cavity. The assumption - fundamental to the concept of supercavitation - forces Q(x) to be positive in the interval 0 < 0 7r, meaning that the pressure on the hydrofoil's lower surface is positive over the entire chord. This
an optimized hydrofoil shape:
y A1 X 8 (x ) 22
+4 -X' (2.8)
c 2 c 3 c c
where A1 is given by:
8
A1 =-CL (2.9)
57r
for zero angle of attack (a = 0). These equations together calculate the
two-dimensional pressure face coordinates x and y (in the plane aligned with the flow), corresponding to the red edge of Figure 1-5 which generates the principle lift for the
hydrofoil.
Tulin-Burkhart determined that such a shape would have a lift-drag ratio 25/4 times greater than the theoretical lift-drag of a flat plate, before even considering adjustments to the angle of attack. They noted however that superior shapes are possible through consideration of greater than two terms in the vorticity distribution 1361. Johnson exploited this opportunity with the development of his 3-term and 5-term hydrofoil profiles.
2.2.2
J3T and J5T Hydrofoil Equations
Johnson picked up where Tulin-Burkart left off in order to create supercavitating hydrofoils with even greater lift-drag efficiency. Whereas Tulink-Burkart used only two terms in the vorticity distribution equation (Equation 2.7), Johnson used three and five terms to develop a series of equations that define optimal hydrofoil shapes for maximum L/D in supercavitation. The coordinates are calculated based on the objective lift coefficient CL, angle of attack a, and chord c. Following the same derivation approach as Tulin-Burkart, he developed two new series of equations, known as Johnson's 3-term (J3T) and Johnson's 5-term (J5T) sections 115]:
=x) - 20 + 80 - 64 (2.10)
C 10 ( eqato
210( - 2240 )+12600
30912 ( 2 + 35840
(
-15360 -) 2 (2.11)Johnson's 5-term (J5T) equation
where A1 is calculated from CL and a by
A, = 2CL - e (2.12)
3 7r
A1 term for J3T equation
A, = 3 CL -O (2.13)
5 7r
A1 term for J5T equation
Figure 2-3 shows the output of the JT and J5T equations to define respectively third- and fifth-order pressure-face profiles. Note that in this figure as throughout this paper, the convention for flow direction is left-to-right. As mentioned above, these profiles would correspond to the red edge of Figure 1-5.
0.08 0.07
-3T
As illustrated in Figure 2-3, the J5T profile showcases not only significantly greater curvature but also greater height overall. These two facets allow it to produce superior L/D characteristics compared to the J3T form; in practice, however, these benefits may come at a cost to producibility. Regardless, both sections are significant improvements over the previous designs: according to Johnson's calculations, the JT and J5T profiles would exhibit 9 and 11 times greater L/D, respectively, compared to flat plate theory, corresponding to 1.44 and 2 times greater than the Tulin-Burkart section. This report explored the efficacy of both profiles in supercavitating propeller blade design.
2.3
Simulation Model: RANSE Solver for
Multiphase Flows
The hydrodynamics of surface-piercing, supercavitating flow demand a robust simu-lation architecture capable of handling complex flow. In particular, the system must be able to model three critical characteristics: cavitation, unsteady flow, and multiple fluid phases (air and water). For an accurate simulation, the system should be able to account for compressibility, condensation, evaporation, phase interaction along the free surface, and all the associated kinematics. The precise modeling of such aggregate phenomena is a significant challenge even with advanced CFD software.
For an engineering analysis, however, the principle hydrodynamic effects can be sufficiently captured through a Reynolds-Averaged Navier-Stokes (RANSE) solver using multi-fluids continuum theory. In this construct, several simplifications are applied to the flow. First, the fluids are considered to be incompressible, thereby neglecting the acoustic scale of the phenomena. The air is further simplified by assuming it isothermal and immiscible. For the phase-change of the water as a result of cavitation, the Volume of Fluids (VoF) approach provides the means to capture the fluid interface.
The foundation of the RANSE solver are the classical Navier-Stokes equations for the fluid mixture:
V - V = (2.14)
Pliquid
D
D(PmixV) - V - (imixVV) - (VV -Vpmix) =V TR, - Vp (2.15)
Dt
44i+ V - (GiquidV) = - r (2.16)
The important rate of phase change is determined via the Schnerr-Sauer model for unsteady cavitating flow. The basis of this model is the Rayleigh-Plesset equation describing the dynamic equilibrium of a vapor bubble (of radius RB) to an external pressure p and surface tension or:
d2RB 3d2RB 2a
_ Pvapop (2.18)
RB + (-3
dt2 2 dt2
RB Pliquid
The Shnerr-Sauer model is then applied ot the RANSE solver with the aforementioned simplifications to model the vapor phase dynamics through the following differential equation for mass flow:
rh 3Pvapor no 47r (2 - 3 - PVapor
3 Pliquid
sign(pvapor - p)
(
jPviqui (2.19)(3 Pliquid
where no is the initial mean diameter of a bubble inside the fluid. Through this
equation, the unsteady multiphase flow involving water, vapor, and air is solved in a RANSE simulator such as STAR-CCM+ [7 [30].
Chapter 3
Design Baseline
Designing a propeller from scratch requires significant complex analyses to deter-mine every aspect of the geometry (from radial length to rake angle) as well as the operational profile (from rotational velocity to the host craft's operating speed). The process consists of "discrete analysis modules in which momentum theory, blade planform corrections, and section design are sequentially considered in the course of an iterative convergence toward some specified radial thrust distribution" [31]. While this would certainly result in an entirely new design, such a process unfortunately would exceed the time and resource limitations of this study.
Therefore, in order to enable the design focus to remain exclusively on the blade hydrofoil geometry, an existing surface-piercing, supercavitating propeller was se-lected as a baseline on which to base all other parameters. This not only reduced the number of initial unknowns for the design, but it ensured that the selected parameters were suitable to such a design since they stem from an existing, proven propeller. Specifically, the parameters adopted from the baseline design were:
From this baseline, the blade sections were amended using Johnson's theoretically optimal foils (Section 2.2) in an effort to improve supercavitating performance. Ad-ditionally, the unique trailing edge SCSB "tail" was added to enhance performance in the subcavitating regime.
In addition to providing certain parameters on which to base the design, the baseline propeller provided the benchmark for comparison in all analyses. 2D profile sections were designed to meet or exceed the performance of their corresponding baseline sections, and the final 3D analyses determined the relative performance of the complete design.
- - - - -I
3.1
Baseline Propeller Characterization
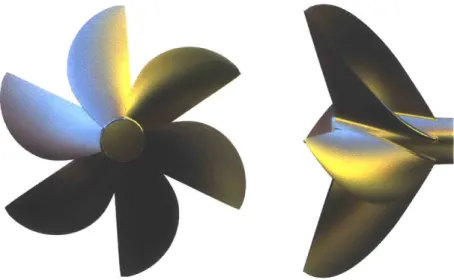
The selected baseline propeller came from Mercury Marine, an American company with extensive experience in high-speed propeller engineering. Specifically, this design selected a Mercury racing propellers (Figures 3-1 and 3-2) designed to achieve speeds in excess of 100 knots. It features a traditional supercavitating foil profile, with a sharp leading edge and blunt trailing edge. Mercury has successfully implemented this propeller on high-performance racing craft such as the Fountain Lighting (Figure 1-4).
Table 3.1: Baseline propeller geometry and operating parameters [32]
Parameter Symbol Value Units
Number of Blades N 6 Diameter D 17 in 0.4318 m Pitch P 35 in 0.8890 m Rake Oj 15 degrees Skew 05 0 degrees 0.015 in
Leading Edge Blade Thickness tLE 0.000 m
0.0004 In
Hub Diameter (Forward) Dhubfwd 35 in
0.8890 m
35 in
Hub Diameter (Aft) Dhub-aft 08 m
0.8890 In
Propeller Rotational Speed n 4570 rpm 76.17 rps
130 mph
Vessel Design Speed V 113 knots
58.12 m/s
Propeller Submergence h 2.4 in
(below shaft centerline) sub 0.061 m
The dimensions and operating characteristics constant to the overall propeller are listed in Table 3.1. The blade profile dimensions that vary along the radius (referenced at fractions of the total radius, r/R) are presented in Table 3.2. Units have been converted from originating document units to those used in subsequent calculations where applicable. These parameters were applied to the new propeller for both design and analysis.
In order to facilitate the new design based on the Mercury baseline, certain additional parameters needed to be determined for the characterization of the flow. These parameters were the pitch angle <p, inflow angle /, angle of attack a, relative velocity V, which were calculated as follows:
-p arctan
(ST)
(3.1) = arctan (3.2) 27nr/ a= < -/ #(3.3) Vrel = V 2 + (2-rnr)2 (3.4) Re = VeiC (3.5)where the kinematic viscosity v = 8.9266 x 10-07 m2/s for freshwater at 25C.
Ad-ditionally, the inflow velocity Vi7 and reference pressure Pref needed to be calculated
for each section in order to facilitate the subsequent flow simulations:
Vin Re (3.6)
cref
Pref = Pvo, (3.7)
where the reference chord length cef = 1 m, the vapor pressure of freshwater at 25*C
PV = 3300 Pa, and the water density p = 997.0476 kg/m3. The calculated values
are listed in Table 3.3 and are used for the ensuing 2D simulations and subsequent development of original blade profiles.
characteri-Table 3.2: Baseline propeller blade profile dimensions along the radius [32]
Parameter Symbol Values Units
Normalized r/R 0.30 0.50 0.70 0.90 -Local Radius 2.55 4.25 5.95 7.65 in Local Radius r 0.065 0.108 0.151 0.194 m 5.70 5.70 5.17 3.20 in Local Chord c 0.145 0.145 0.131 0.081 m Blade Thickness 0.580 0.405 0.255 0.120 in
(Trailing Edge) tTE 14.7 10.3 6.49 3.05 mm
Pitch P 34.8 34.4 34.0 33.6 in
0.885 0.875 0.865 0.855 m
Table 3.3: Calculated operating parameters for the baseline propeller blade profiles
Parameter Symbol Values Units
Normalized r/R 0.30 0.50 0.70
0.90 Local Radius
Pitch Angle 65.30 52.21 42.32 34.99 deg
Inflow Angle 61.93 48.36 38.78 32.00 deg
Angle of Attack a 3.378 3.847 3.536 2.983 deg
Relative V, 65.86 77.76 92.78 109.7 m/s Velocity Reynold's Re 8.375 9.887 10.70 7.816 Number (x106)
Inflow Velocity Vin 7.476 8.826 9.552 6.977 m/s
Reference Pef 4693 5242 5574 4514
Pa Pressure
3.2
Baseline 2D CFD Results
The final parameters required from the baseline profiles necessitated computational fluid dynamics (CFD). Four representative sections were used - r/R = 0.3, 0.5,0.7,0.9
-to quantify the blade characteristics. The simulations were conducted using Siemen's software STAR-CCM+ to run two-dimensional flow analyses on each section
1331.
The full profile geometries were provided by Mercury, and each section was normalized to the reference chord length (c,.f) of one meter. The requisite parameters for the simulations were as developed in the preceding section.The objective of these simulations was to assess the lift coefficient (CL) and drag coefficient (CD) of each profile, which in turn determined the overall measure of
efficiency, lift-over-drag (L/D = gLL). These results are tabulated in Table 3.4. The full plot of results over time are provided in Figure 3-3 as an example to demonstrate that simulations were run sufficiently long in order to achieve stable steady-state solutions. All 2D CFD simulations for both propellers were run for a similar duration.
An additional - and equally important - objective was to capture the
supercav-itating behavior of the hydrofoils as they operate at the design speed V. The supercavitation effect is visualized in the Volume of Fluid images of Figure 3-4, where blue indicates the full liquid state and red indicates full vapor.
Table 3.4: Results of 2D CFD simulations on Mercury hydrofoil sections
Parameter Symbol Values Units
Normalized Local Radius r/R 0.30 0.50 0.70 0.90
-Lift Coefficient CL 0.127 0.293 0.300 0.304
-Drag Coefficient CD 0.0219 0.0292 0.0289 0.0289
- 0.4- 0.3- 0.2- 0.1-Reports Plot I. J -- CL -CM E CA -0.2- -0.3-lo N .00 -U.14 0 0.2 0.4 0.6 0.8 1.2 1.4 1.6 18 2 Physical Time (s) (d) r/R = 0.9
Figure 3-3: Lift, drag, & moment results of 2D CFD on Mercury hydrofoils 0 -0.1 -- --0.2 -0.3 -0.41! O. 0.2 0.4 0.6 0.8 1 12 1.4 1:6 1. 2
Physical Time (si
(a) r/R = 0.3 Reports Plot -CD 0.4o -0. 0.2--0.1b- -R- 0-- -0.1)-=--0.2 -0.3 -0.2, 0. . .2 0'4 0'6 O.s 1:2 1'4 1.6 VS Physical Time (s) (b) r/R = 0.5 Reports Plot - CD 0.4 -- - - L 0.3~ ---- CM 0.2-- - 0.1--0.1 -03 -0 0.2 0.4 0.6 0.8 1'2 1:4 1.6 1:8 2 Physlcal Time (s) (c) r/R = 0.7 Reports Plot -CD 0.4 -- C 0.3- - w-L ^ A -- ---- -A 0 .2 . - - - . 0.1
-(a) r/R = 0.3
(b) r/R = 0.5
(c) r/R = 0.7
(d) r/R = 0.9
Volume Fraction of vapor
0.2 0.4 0.6 0.8 1
Chapter 4
New Propeller Design
Having sufficiently quantified the baseline propeller, the new design could proceed. The process of developing the new hydrofoils followed the "hybrid CFD-theoretical design method" formulated by Brizzolara and Federici
16].
This method employs three basic steps to develop a supercavitating profile:1. Draw the pressure-face lines from Johnson's theory;
2. Use 2D CFD simulations to inform the shape of the non-pressure (back and trailing edge) surfaces, ensuring full cavity envelopment through trial-and-error of the simulations;
3. Ensure sufficient strength (modulus of inertia) for the entire hydrofoil section. Following this process, the design began with the pressure face (corresponding to the red face of Figure 1-5) -the necessary starting point as its geometry has the greatest
4.1
Design Objectives
The overarching objective was to meet or exceed the Mercury performance (based on the CFD analysis of Table 4.1) while maintaining the same geometric and operational constraints listed in Tables 3.1 and 3.3. An additional requirement was for the new foils to operate in a supercavitating mode such that the vapor cavities resembled those of their respective baseline sections. Specifically, the design goals for each hydrofoil section were as follows:
" Lift-to-drag ratio: meet or exceed L/D for the respective baseline section " Lift coefficient: achieve CL > 0.30
* Supercavitation: ensure vapor cavities fully enclose non-pressure surfaces, with cavities of similar size as the respective baseline section
" Subcavitating performance: achieve CL > 0.6 via the tail design
" Producibility: limit complex curvature as much as practicable while meeting hydrodynamic requirements to support manufacturing producibility
considerations
" Strength: Improve the strength of each section, as measured by section modulus S, by 30%
With these goals in mind, the design followed the Brizzolara-Federici method to iteratively converge upon the hydrofoil shapes that optimally satisfied the above con-ditions. Once these were achieved and the complete 3D propeller geometry created, the new propeller was compared to the baseline in full 3D CFD analyses, where the desired outcome was increased thrust at the same (or lower) torque on each blade. Although the thrust and torque comparisons were the ultimate assessment of the propeller's relative efficacy (presented in Chapter 5), these analyses were an end result rather than a design objective that informed the hydrofoil geometry development. The focus of the design itself therefore rested on the above list of objectives.
4.2
Hydrofoil Profile Development
The design of the blade profiles began with the theoretical optimal pressure face profiles developed by Johnson (Section 2.2). The first attempt used his 3-term equation (Equation 2.10); since its curvature is simpler than that of the 5-term, it was a more desirable form from a manufacturing perspective. Considering this producibility aspect, if satisfactory L/D could have been achieved using the JT form then it would be the preferred candidate for the blade design.
As a starting point, the section at r/R = 0.7 was developed first - its high efficiency (L/D = 10.39) and near-full chord length (c = 0.131 m) relative to the other sections made it a preferred candidate for optimization. Once satisfactory results were achieved, the ensuing sections at r/R = 0.3, 0.5, 0.9 were built upon the results of 0.7.
4.2.1
J3T Profile
Combining the baseline propeller characteristics and Johnson's equations, the resul-tant pressure face was as shown in Figure 4-1. The remaining unknown regarding the face was the angle at which it should be inclined relative to the flow for maximum lift and minimum drag. Although this angle of attack a was determined for the Mercury sections, the angles were not actually comparable between the Johnson and Mercury blades due to the relative inclination of the face camber. Whereas the Mercury profiles had flat faces defined to be perfectly parallel with the x-axis, the Johnson profiles each had an inherent declination to their camber; that is, their aftermost point (at
0.05 0.04 C 0.03 0.02 V Z 0.01 0 0.00 0.0 0.1 0.2 0.3 0.4 0.5 0.6 0.7 0.8 0.9 1.0
Normalized Horizontal Distance Along Chord (x/c)
Figure 4-1: J3T profile at r/R = 0.7
Examples of early 2D CFD simulations on the J3T sections are shown in Figure 4-2. The sequence of images illustrates the initial development of the profiles: Figure 4-2a shows the unadulterated JT profile at the baseline Mercury angle of attack, with a nominal back profile; the angle of attack was increased in Figure 4-2b to increase the lift coefficient and also ensure that the vapor cavity covered the entire
(a) J3T profile with +1 0over baseline a
(b) J3T profile with +2"over baseline a
0
(c) Half-camber J3T profile with +2"over baseline a
Volume Fraction of vapor
0.2 0.4 0.6 0.8 1
Figure 4-2: Profile development of J3T face profile to determine optimal face camber and angle of attack (red = vapor, blue = liquid)
back; a tail was added in Figure 4-2c, ensuring that it remained within the cavity. Also in the final figure, the camber of the face profile was halved (i.e. the pressure face curve was scaled by 1/2 in the vertical y direction) in order to limit the curvature for real-world producibility.
After multiple iterations, the CFD analysis of the J3T profile demonstrated that the JT was unable to outperform the Mercury section. Although the full-cambered
profile performed well (achieving CL = 0.306 and L/D = 13.18 with a = +2 over baseline), once the camber was halved both CL and L/D remained well below their baseline counterpart despite various adjustments to a. The J3T was therefore abandoned in favor of the expected-superior J5T.
4.2.2
J5T Profile
The J5T profile was developed in the same manner as the JST, this time using Johnson's 5-term equation (Equation 2.11) to develop the section at r/R = 0.7. The resultant face profile is shown in Figure 4-3, along with the three other primary sections used in subsequent development. Notably, the 0.5, 0.7, and 0.9 profiles have significant and similar curvature, whereas the 0.3 profile curvature is shallow. This correlates with the respective baseline 0.3 section and is representative of this section's relatively low contribution to lift as compared to the others.
CFD analysis of the 0.7 section immediately revealed the superior performance of
0.08 -JST 0.3 0.07 -- JT 0.5 0.06 _J5T 0.7
Table 4.1: 2D CFD results for final 3/4-camber J5T hydrofoil sections
Parameter Symbol Values Units
Normalized Local Radius r/R 0.30 0.50 0.70 0.90
-Angle of Attack a 5.84 6.31 6.00 5.45 deg
Lift Coefficient CL 0.177 0.298 0.299 0.286
-Drag Coefficient CD 0.0244 0.0303 0.0286 0.0246
-Lift-over-Drag L/D 7.25 9.84 10.45 11.61
-the J5T as compared to -the JT, with -the half-camber J5T exhibiting both CL and
L/D values higher than the half-camber baseline. In an effort to elicit even higher lift, the face camber was increased to an intermediate 3/4-camber profile. Although this would negatively affect producibility, a qualitative assessment determined that the improved performance justified the heightened curvature.
Through multiple iterations, satisfactory results were achieved in accordance with the design objectives. Running the CFD simulation in a "fully-wet" subcavitating condition (setting o- = 2.0) confirmed the desired lift, achieving CL = 0.684. Once the 0.7 section was optimized, the remaining three sections were constructed through the combination their face profiles (from Figure 4-3, scaled to 3/4-camber) and the 0.7 profile parametrically adjusted according to their respective baseline sections. For example, having determined a 6*incline to be the optimal angle of attack for r/R-0.7, the other sections were inclined to the same relative degrees as the baseline sections (per Table 3.3).
The results of the final J5T designs are listed in Table 4.1. The three primary sections at r/R = 0.5,0.7, 0.9 all achieved a lift coefficient very near CL = 0.3, within 5% (the section at r/R = 0.3 did not produce significant lift on either the baseline or the J5T; nevertheless, the J5T profile exceeded the baseline in CL). Furthermore, the 0.3, 0.7 and 0.9 sections attained lift-over-drag ratios superior to their respective baselines, while the 0.5 section fell less than 2% below its respective baseline.
While iterating to achieve satisfactory CL and L/D, volume of fluid representa-tions from the CFD simularepresenta-tions were inspected to assess the supercavitation perfor-mance (Figure 4-4). The final profile designs showed full vapor cavities across the back and tail of the r/R = 0.5,0.7,0.9 sections, with the cavity height commensurate with their respective baselines. Notably the 0.3 section does not aciieve full supercavitation across its back, however this performance was similar on the Mercury 0.3 section.
*1
(a) r/R = 0.3
(b) r/R = 0.5
(c) r/R = 0.7
(d) r/R = 0.9
Volume Fraction of vapor
0 02 0.4 0.6 0.8 1
Figure 4-4: 2D CFD results for new J5T hydrofoils showing volume of fluid (red = vapor, blue = liquid)
With adequate lift coefficients, lift-over-drag ratios, and supercavitation vapor cavities, these 3/4-camber J5T sections were selected for development into the full
4.3
Strength Verification
An additional consideration unrelated to hydrodynamic performance was the struc-tural integrity of each section. The design had to ensure that each section - and thus the entire propeller blade - was strong enough to withstand the substantial hydro-dynamic forces of the rapidly rotating propeller. Since the Mercury sections were known to have sufficient strength given that they operate on an existing propeller, their values were again used as the baseline for the new designs.
The key measurement employed to define the strength of each section was the section modulus S, which for the hydrofoil is defined as:
S t12 (4.1)
tmax /2
where tmax was the maximum profile thickness and I2 was the "area principal moment of inertia about the centroid and principal axes" as measured by the computer-aided design (CAD) software Rhino [27]. Given that the profiles were two-dimensional, each had two corresponding area principal moments of inertia; the smallest of these was used for analysis as it corresponded to the axis of least strength.
As evidenced in Table 4.2, the final J5T section designs successfully achieved the desired +30% increase in section modulus, within +/- 3%. The profiles were therefore assessed to have sufficient strength to proceed with full blade development.
Table 4.2: Strength comparison between Mercury and J5T hydrofoil sections
Parameter Symbol Values Units
Normalized Local Radius r/R 0.30 0.50 0.70 0.90
-Area Principal Moment of 12 5.539 2.004 0.741 0.436 m4
5 Inertia
(x
10-5) 12 5_539 2.004 0.741 0_436 mi Maximum Thickness tmax 0.105 0.075 0.053 0.043 m
Section Modulus (x 10-4) S 10.55 5.345 2.797 2.026 m3
Area Principal Moment of 12 10.54 3.756 1.308 0.941 m4
Inertia (x 10-5)
Maximum Thickness tmax 0.154 0.110 0.073 0.070 m
Section Modulus (x 10-4) S 13.69 6.829 3.584 2.688 m3
![Figure 1-1: The pitfalls of cavitation: propellers showing significant pitting damage [29]](https://thumb-eu.123doks.com/thumbv2/123doknet/14680857.559224/17.917.127.455.596.869/figure-pitfalls-cavitation-propellers-showing-significant-pitting-damage.webp)
![Figure 1-4: Fountain Lighting racing craft featuring Mercury surface-piercing propellers [32]](https://thumb-eu.123doks.com/thumbv2/123doknet/14680857.559224/22.917.198.721.118.352/figure-fountain-lighting-featuring-mercury-surface-piercing-propellers.webp)
![Figure 1-5: Principal topological elements of the SCSB hydrofoil [5]](https://thumb-eu.123doks.com/thumbv2/123doknet/14680857.559224/23.917.142.786.849.1050/figure-principal-topological-elements-scsb-hydrofoil.webp)


![Table 3.1: Baseline propeller geometry and operating parameters [32]](https://thumb-eu.123doks.com/thumbv2/123doknet/14680857.559224/39.917.206.698.148.710/table-baseline-propeller-geometry-operating-parameters.webp)


