HAL Id: hal-01617373
https://hal.archives-ouvertes.fr/hal-01617373
Submitted on 16 Oct 2017
HAL is a multi-disciplinary open access
archive for the deposit and dissemination of
sci-entific research documents, whether they are
pub-lished or not. The documents may come from
teaching and research institutions in France or
abroad, or from public or private research centers.
L’archive ouverte pluridisciplinaire HAL, est
destinée au dépôt et à la diffusion de documents
scientifiques de niveau recherche, publiés ou non,
émanant des établissements d’enseignement et de
recherche français ou étrangers, des laboratoires
publics ou privés.
Statistic-based method to monitor belt transmission
looseness through motor phase currents
Antoine Picot, Etienne Fournier, Jérémi Regnier, Mathias Tientcheu Yamdeu,
Jean-Marie Andréjak, Pascal Maussion
To cite this version:
Antoine Picot, Etienne Fournier, Jérémi Regnier, Mathias Tientcheu Yamdeu, Jean-Marie Andréjak,
et al.. Statistic-based method to monitor belt transmission looseness through motor phase currents.
IEEE Transactions on Industrial Informatics, Institute of Electrical and Electronics Engineers, 2017,
vol. 13 (n°3), pp.1332-1340. �10.1109/TII.2017.2661317�. �hal-01617373�
Any correspondence concerning this service should be sent to the repository administrator:
staff-oatao@inp-toulouse.fr
To link to this article:
DOI : 10.1109/TII.2017.2661317
URL: http://dx.doi.org/10.1109/TII.2017.2661317
This is an author-deposited version published in:
http://oatao.univ-toulouse.fr/
Eprints ID: 18564
To cite this version:
Picot, Antoine and Fournier, Etienne and Regnier, Jérémi
and Tientcheu Yamdeu, Mathias and Andréjak, Jean-Marie and Maussion,
Pascal Statistic-based method to monitor belt transmission looseness through
motor phase currents. (2017) IEEE Transactions on Industrial Informatics, vol.
13 (n°3). pp.1332-1340. ISSN 1551-3203
O
pen
A
rchive
T
oulouse
A
rchive
O
uverte (
OATAO
)
OATAO is an open access repository that collects the work of Toulouse researchers and
makes it freely available over the web where possible.
Statistic-Based Method to Monitor Belt
Transmission Looseness Through
Motor Phase Currents
Antoine Picot, Etienne Fournier, J ´er ´emi R ´egnier, Mathias TientcheuYamdeu,
Jean-Marie Andr ´ejak, and Pascal Maussion
Abstract—Belt–pulley systems are widely used in the
in-dustry due to their high efficiency and their low cost. How-ever, only few works exist about the monitoring of their degradation. This paper details the impact of belt loose-ness on electrical measurements under steady and tran-sient state in order to identify spectral signatures. This anal-ysis enlightens the advantage of the transient state to detect belt looseness because it exacerbates belt slip. An innova-tive methodology is then proposed based on the application of a square-wave speed reference in order to monitor belt looseness. A statistical-based indicator is defined from the phase currents in order to automatically detect drifting of the indicator. A normalization process is also applied to in-crease the detection robustness. The proposed indicator is evaluated on a 30-kW induction machine and a direct-current machine coupled with two trapezoidal belts for three speed and four load conditions. It reaches very good results with almost 90% correct detections for 1% false alarms. These results are way better than those obtained with a classic spectral analysis during the steady state. Moreover, results demonstrate that higher load conditions are more accurate for the monitoring of belt looseness.
Index Terms—Belt–pulley systems, fault diagnosis,
induction motors (IMs), robustness, spectral analysis, statistical-based indicator, torque–speed segmentation.
NOMENCLATURE
δΩ Speed square-wave peak-to-peak amplitude.
Ω Motor speed.
σn Standard deviation of coefficientscn.
cn Fourier series coefficient at rankn.
di Center distance between motor and load.
Color versions of one or more of the figures in this paper are available online at http://ieeexplore.ieee.org.
Digital Object Identifier 10.1109/TII.2017.2661317
fb Rotation frequency of the belts.
fc Square-wave frequency.
ff Supply frequency.
fl Rotation frequency of the load.
fr Rotation frequency of the induction motor.
fs Sampling frequency.
i1, i2, i3 Motor phase currents.
ia Currents instantaneous amplitude.
if Currents instantaneous frequency.
mn Average of coefficientscn.
X(f ) Fourier transform of the variable x(t) at
frequencyf .
I. INTRODUCTION
I
NDUSTRIAL systems’ maintenance has become animpor-tant economical issue over the past years. The dependence between machines and production lines makes electromechani-cal systems one of the critielectromechani-cal elements of industrial plants. Their failure may indeed provoke unexpected production shutdowns and important safety issues. In this context, many diagnosis strategies have been developed to monitor electrical machines.
Studies have mainly focused on the diagnosis of faults directly related to the electrical motors such as bearing faults [1]–[3], rotor faults [4]–[6], or winding faults [7]–[9]. If vibration sig-nals were first used as a robust indicator for the monitoring of electrical machines [10]–[12], recent studies would have mainly focused on the processing of electrical measures such as phase currents since they are often available for control purposes. The main technique used for the monitoring of electrical machines is probably the exploitation of frequential signatures induced by different faults. This technique is known as motor current sig-nature analysis (MCSA), and a review of different techniques can be found in [13]. A lot of different signal processing tools have been explored to extract and track specific fault compo-nents such as the Fourier transform, the wavelets transform, or the empirical mode decomposition, with similar performance. A complete state of the art can be found in [14]. However, less attention has been paid to the monitoring of a transmission sys-tem such as gears of belt–pulley drives. In these cases, MCSA techniques are often limited [15] due to the fact that signatures are distorted by the transmission system and original techniques must be developed.
Belt–pulley systems are extensively employed in industrial applications such as compressors, pumps, fans, etc. The main advantages of belt transmission are its high efficiency, the non-necessity of aligned shafts, its tolerance for misalignment, and its low cost [16]. They are generally composed of two pulleys, one or several belts, and eventually other mechanical elements (tension roller, guide roller, etc.). The most popular types of belts are the flat and trapezoidal ones (also known as V-belts). Belt transmission systems working under degraded conditions can, therefore, lose their mechanical properties over time and lead to belt rupture, severe pulleys wear, or excessive belt slip [17], [18]. Among different failure modes, belt looseness is an important issue. Indeed, it increases the belt slip and thus accel-erates the wear process of the transmission system [19]. Recent study [20] has focused on the effects of belt looseness on a sys-tem driven by an induction motor (IM). This work concluded that phase currents were sensitive to belt looseness conditions and that the belt slip were exacerbated when applying a speed step reference to the motor, implying that the transient state was more interesting for diagnosis purpose.
This work presents a belt looseness indicator based on the analysis of the transient state of a belt–pulley system driven by an IM. This strategy was recommended in [20]. Since this indi-cator must be suitable for industrial applications, it must be able to adapt itself to the application, so it does not have to be exten-sively tuned by the operator. Recent works [2], [21] have shown that statistical processing of the data could be an interesting approach to automatically detect a drifting of the parameters. Moreover, it must also be able adapt to the load condition, since it seems not realistic to suppose that the belt–pulley system (such as pumps or fans) will work under a single load during its lifetime. In order to overcome this point, Fournier et al. have shown in [22] that an adequate segmentation of the torque– speed plane helps to increase the robustness of the monitoring. We propose here to use this strategy with a proper belt looseness indicator in order to develop a robust monitoring system for belt transmission application. The proposed monitoring scheme has been designed in partnership with the machine manufacturer Leroy Somer in order to be acceptable for a wide range of ap-plications working in open-loop condition such as compression, ventilation, and pumping processes.
The outline of this paper is the following. The belt transmis-sion system used in this study is presented in Section II. The degradation protocol and different measures are detailed in this section. The effects of belt looseness on electrical measures for steady and transient states are presented in Section III. This sec-tion sums up work presented in [20] and focuses on the use of the instantaneous frequency to monitor the system. The relevancy of different frequency signatures is studied in this section. A monitoring method is then proposed in Section IV. This method is based on the use of a small transient state to increase the effect of belt looseness. In order to make the proposed indicator robust to load variations, a torque–speed mapping protocol in-spired by Fournier et al. [22] is also proposed. Section V details the results for different load conditions and transmission ratios. These results are compared to those obtained in the steady state and discussed.
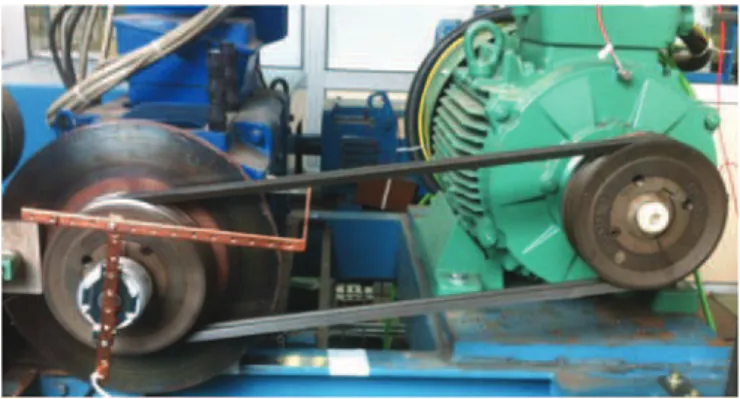
Fig. 1. Experimental test bench composed of an 30-kW IM (right), a belt–pulley transmission system (middle), and a direct-current machine (left).
II. BELTTRANSMISSIONSYSTEM
A. Test Bench Presentation
The experimental test bench used in this study is displayed in
Fig. 1. It has been developed in association with Leroy Somer. This test bench is composed of the following:
1) a squirrel-cage IM with one pair of poles, a rated power of 30 kW, and a rated speed of 2946 r/min;
2) a transmission system composed of two 160-mm-diameter pulleys and two trapezoidal belts with a length ofLbelts= 1600 mm (Texrope VP2 1600 SPA);
3) a direct-current machine used to vary the torque delivered by the IM.
The IM is fed by a pulse-width-modulated inverter with a
constant V /f open-loop control law. This way, it is possible
to control the IM speed (neglecting the slip) by imposing the stator current frequency. This control mode is widely used for different kinds of applications, and Leroy Somer estimates that about 90% of their IMs sold are used with this control mode. The
center distanced between the load machine and the IM can be
adjusted in order to increase or decrease belts tension. Tests can thus be carried out for healthy conditions, with a proper tension of the belts, and for faulty conditions by gradually decreasing the distanced between the motor and its load. In this test bench, the diameters of the driven pulleyDdriven and the driver pulley
Ddriverare equal. The transmission ratioRt= Ddriven/Ddriveris
then equal to 1. This ratio has been chosen in order to simplify the analysis of different results during the description of the proposed method. Results for a nonunitary ratio are presented in Section V in order to confirm the performance of the proposed indicator in a more realistic case.
B. Measurements
An eight-synchronous-channel data acquisition system has been used to record mechanical and electrical signals with a
sample frequency fs= 100 kHz. Different recorded data are
the following:
1) the radial and axial vibration signals (respectively,γrand
γa) via two accelerometers (Dytran 3055A2) placed on
TABLE I
CENTERDISTANCES ANDRELATEDBELTSCONDITIONUSEDDURING THE
EXPERIMENTALTESTS
Center distance Belts condition
d1 Healthy belts
d2 Moderate belt looseness
d3 Strong belt looseness
d4 Critical belt looseness
2) the motor and load mechanical speed signals (respec-tively,ΩmotorandΩload), thanks to two encoders;
3) the motor phase currentsi1,i2, andi3.
All recordings have the same lengthTrecequal to 5 s. The belt
slip, notedSΩ, is calculated fromΩmotorandΩloadaccording to
SΩ= Ωmotor− Rt.Ωload (1)
withRtbeing the transmission ratio. It can also be defined in
relative terms by
sΩ = SΩ
Ωmotor
· 100 (2)
for all measurements.
Four different center distances have been tested fromd1 to
d4. These distances correspond to different belt looseness
con-ditions represented inTable I.
The center distanced1 is the correct belt tension, which
en-sures an optimal functioning of the system. On the contrary, the center distanced4 provokes a critical looseness of the belts,
which even prevents the system to work under the rated load and
speed. Two intermediate center distancesd2 andd3 have also
been tested between these two extreme cases. They, respectively, induce moderate and strong belt looseness.
Tests have been carried out for at half the nominal speed
(Ωn/2 ≃ 1500 r/min) for five different load conditions of
the IM. The load conditions are I0≃ 15 A, In/2 ≃ 26 A,
3In/4 ≃ 38 A, 7In/8 ≃ 45 A, and In ≃ 52 A, with I0the
no-load condition andIn the nominal load condition. More tests
have been carried out for the evaluation of the proposed method. They are described in Section V-A.
III. EFFECTS OFBELTLOOSENESS ONELECTRICAL MEASURES
A. Effects on Belt Slip
The relative belt slip sΩ has been computed for each load
condition according to (2). It is supposed to increase with the belt looseness because of the loss of adhesion. Moreover, its spectral content should be affected by torque oscillations due to belt flapping.
Fig. 2displays the evolution of the belt slip depending on the looseness for different load conditions. Darker colors corre-spond to higher load conditions. It can be seen in this figure that the average belt slip is increasing with the looseness. Its value is about 2% of the motor speed with healthy belts whatever the load condition. The relative slip reaches, however, higher value (till 8% of the motor speed) in the critical condition. The effect
Fig. 2. Evolution of relative belt slipsΩ with the load condition atΩ = 1500 r/min.
Fig. 3. Belt slip spectrum for different looseness conditions atIn = 52 A andΩ = 1500 r/min.
of the looseness is especially obvious as the load condition in-creases. It can be concluded that it is better to use a high-load condition in order to observe belt slip. In this case, belt slip seems to be a relevant indicator of belt looseness.
The belt slip spectrum has also been computed for different
looseness conditions at In = 52 A. The results are plotted in
Fig. 3. Higher looseness corresponds to warmer colors. Three harmonic families can be noticed in this spectra: one depending
on the rotation frequency of the belts fb, one depending on
the rotation frequency of the load fl, and one depending on
the rotation frequency of the motor fr. Here, fr and fl are
almost the same due to the fact that the ratio 1:1 is used for the transmission.
The belt rotation frequencyfbcan be defined according to (3)
in the case of no slip between the belts and the motor pulleys. In this equation,Lb is the length of the belts andDm is the motor
pulley diameter:
fb =
π.Dm
Lb
· fr. (3)
It can be seen inFig. 3that harmonics multiples offbsuch as
SΩ(fb) and SΩ(2.fb) are affected by the belt looseness: SΩ(fb)
is decreasing, whileSΩ(2.fb) is increasing with the looseness.
The harmonic SΩ(fl) is also impacted by the increase of the
looseness. Its value seems to remain the same, but its posi-tion changes with the looseness. This can be explained by its
Fig. 4. Evolution phase currents instantaneous frequency spectrum |IF(f )| with the looseness severity for In = 52 A and Ω = 1500 r/min.
definition (4), with< sΩ(t) > being the average value of the
relative belt slip. The belt slip obviously impacts the value of fl, which explains the frequential shift with the looseness
fl = (1− < sΩ(t) >) · fr. (4)
The harmonicSΩ(fr) seems to increase for strong and critical
belt looseness. It is, however, difficult to tell in the case of looseness of healthy belts and moderate belts, since they are very close toSΩ(fl).
B. Effects Under Steady-State Operation
Fournier et al. have demonstrated in [20] that belt looseness had a strong impact on mechanical variables such as motor speed or vibration signals. Nonetheless, it is more convenient to use electrical variables for the monitoring since speed or vibration sensors are expensive and electrical quantities (such as phase currents) are often already accessible through the speed drive for control purposes. Belt looseness induces speed oscillations that impact the spectral content of phase currents.
Instantaneous frequency is well fitted for the monitoring of torque oscillation [23]. The phase current instantaneous fre-quency if(t) has been computed by the Concordia transform on the data. Their power spectra|IF(f )| are displayed in Fig. 4. Higher looseness corresponds to warmer colors.
It can be seen inFig. 4that the same frequency families as those identified in Section III-A are modified with belt loose-ness. The frequency multiples offb,fl, andfr are impacted
by belt looseness. Their behavior seems to be very similar to the one of the corresponding harmonics in the belt slip spec-trum. A modeling of the electromechanical system would be necessary here to perfectly understand the connection between the dynamic of the belt and the stator current, which is not the purpose of this paper.
Three harmonic families are likely to allow the monitoring of belt looseness. Nevertheless, belt slip and load speed are usually not measured on industrial drives. The rotation frequency seems then the only suitable candidate for belt looseness monitoring. So, a first indicator of belt looseness is the evolution of|IF(fr)|.
The mean increase of this indicator from its healthy value has
been computed for each belt condition.Table IIdisplays these
values for different operating points.
TABLE II
EVOLUTION OF THECURRENTINSTANTANEOUSFREQUENCYHARMONIC IF(fr) AVERAGEVALUEWITH THEBELTLOOSENESSSEVERITY FOR
DIFFERENTLOADCONDITIONS ATΩ = 1500R/MIN
Load level Moderate looseness Strong looseness Critical looseness
I0≃ 15 A +1 dB +0 dB +0 dB
In/2 ≃ 26 A +12 dB +17 dB +18 dB
3In/4 ≃ 39 A +10 dB +17 dB +16 dB
7In/8 ≃ 45 A +11 dB +16 dB +17 dB
In ≃ 52 A +10 dB +14 dB +14 dB
Fig. 5. Relative belt slip response to the speed reference step for healthy and loosen belts under the load levelI = 38 A.
The results shown in Table II demonstrate that |IF(fr)| is
suitable for belt looseness detection because its value increases in the case of belt looseness (compared to the healthy case). It seems, however, unable to monitor the fault severity, since there is not much difference between strong and critical looseness. Moreover, a minimal load torque is necessary to observe this difference. The level of|IF(fr)| is not impacted by the tension
loss in the no-load condition (Imotor= I0).
C. Effects Under Transient-State Operation
Although belt looseness has a clear influence on the phase cur-rents under steady operation, as shown in Section III-B, Fournier
et al. have demonstrated in [20] that belt slip is exacerbated
when sudden accelerations are imposed to the system.Fig. 5
displays the temporal response of the relative belt slip when applying a speed step rising from 2000 to 2500 r/min att = 1 s for looseness of healthy belts (green) and moderate belts (blue). It can be seen inFig. 5that the relative slip is slightly greater for moderate belt looseness than for healthy belts during steady states atΩ = 2000 r/min and Ω = 2500 r/min. This is consistent with results presented in Section III-A. Moreover, it is obvious fromFig. 5that the relative belt slip is strongly increased during the transient state because it reaches almost 10% for moderate belt looseness against 4% only for healthy belts.
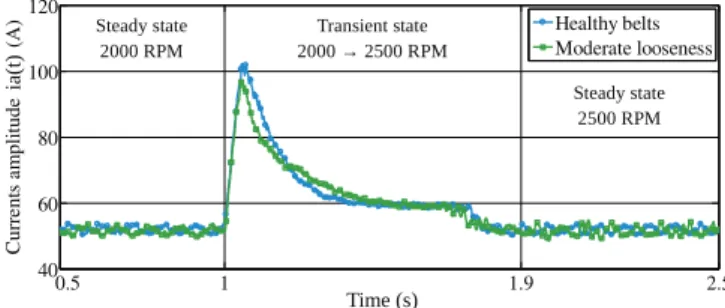
The effect of belt slip is clearly visible on the instantaneous amplitude ia(t) of the phase currents computed by the Concordia transform, as displayed inFig. 6.
It can be noticed inFig. 6that response of ia(t) during the transient state is distorted with belt looseness. Its amplitude peak is attenuated in the first part of the step response, and the drop is slower when loosen belts are used instead of healthy belts. It seems nevertheless difficult to impose such an acceleration in
Fig. 6. Dynamic response of motor current instantaneous amplitude
ia(t) to the speed reference step for healthy and loosen belts under the load levelI = 38 A.
Fig. 7. Proposed speed profile formed by the superposition of constant speed referenceΩ0 and a speed square inputδΩ/2 at frequency fc.
real-life applications in order to produce a fault signature related to the belt condition.
IV. BELTLOOSENESSMONITORINGMETHOD
A. Effect of a Square Waveform Speed Reference
According to the results presented in Section III, the effects of belt looseness are exacerbated under transient-state opera-tion due to the motor acceleraopera-tion, which makes them easier to monitor. Unfortunately, it seems inconceivable to use a strong speed step reference (as presented in Section III-C) since the application would be greatly impacted and might not tolerate it or to diagnose the system only when it is turned ON.
The solution proposed in this paper is to add a low-speed square inputδΩ to a constant speed reference Ω0 (withδΩ <<
Ω0) in order to provoke slight transients and reproduce the
ef-fects of a speed step reference with a known period Tc. The
proposed speed profile is presented inFig. 7. It is possible to impose such a profile because the IM is driven with a constant V /f open-loop control law. The amplitude of δΩ must be low
enough not to impact the application working. The periodTc
must be long enough to observe the impact of the motor accelera-tion and short enough to observe a large number of acceleraaccelera-tions during the recording durationTrec. This profile has been defined
in partnership with the motors’ manufacturer Leroy Somer in order to be acceptable for a wide range of applications such as compression, ventilation, and pumping processes.
The effect of such a speed profile will impact periodically the belt slip and so the instantaneous frequency ia(t). Since the effect of belt slip appears with a periodTc on ia(t), it can
then be expressed as a Fourier series according to the following
Fig. 8. Values of thecncoefficients for the instantaneous amplitude of the phase currents for healthy and faulty belt conditions at7In/8 = 45 A andΩ0= 2000 r/min. equation: ia(t) = +∞ X n = 0 cn · cos(2πnfct + φn). (5)
The coefficients cn characterize the amplitude of the
har-monic response of ia(t) to the square speed profile. Their values will then be modified if ia(t) is modified. Moreover, these co-efficients can be estimated as |IA(n · fc)|, the values of the
Fourier transform of ia(t) at multiple of the known frequency fc= 1/Tc, and used as fault signatures.
Fig. 8 represents the values of different coefficients cn =
|IA(n · fc)| for n from 1 to 10 for healthy belts (blue circles)
and for moderate belt looseness (green stars). These results have been obtained by applying the proposed speed profile with
a period Tc= 1 s and a speed square waveform of
peak-to-peak amplitudeδΩ ≃ 55 r/min added to a speed reference Ω0=
2000 r/min. Note that δΩ is less than 2% of the motor nominal
speedΩn = 2946 r/min, which should not impact much real-life
applications.
Fig. 8 shows that the coefficients of the Fourier series are impacted by the increase of the belt looseness. A decrease of harmonics from 2 to 7 and an increase of harmonics from 8 to 10 can be noticed. These changes reflect the distortion of ia(t) with the proposed speed profile. They can, thus, be used as indicators of belt looseness.
B. Proposed Indicator
Sincecn coefficients are varying along with belt looseness,
the purpose is to detect their significant variations in order to discriminate belt looseness cases from healthy cases. Picot et al. have presented a method to normalize the fault signature in [2] in order to enlighten meaningful variations. This approach is based on the computation of the mean and the standard deviation of the fault signature during the healthy functioning of the machine. Abnormal behavior of the machine can thus be detected by applying a statisticalt-test.
The same process is applied to normalize eachcn coefficient.
The average mn and the standard deviation σn are computed
from the firstNrefrecordings. Normalized signaturescCR(n) are
equation:
cCR(n) =
|cn − mn|
σn
. (6)
The coefficientscCR(n) are close to 0 in healthy cases because
mn andσn are computed with a healthy belt and should be
increasing in faulty cases due to the drift of thecn value from
the healthy one. The variablecCR(n) is supposed to follow a
standard normal distributionN (0, 1), and a detection threshold
depending on the numberNrefof recordings used to compute
the healthy reference can then be statistically defined.
It can be seen inFig. 8that the impact of belt looseness on cn coefficients is spread on different coefficient levels and not
focused on a specific one. It means a large number signatures
cCR(n) to monitor. We propose to merge these different
sig-natures in order to get a single fault indicator. A fault indicator XCRis thus defined as a linear combination of signaturescCR(n)
according to (7). The weight of eachcCR(n) is chosen
decreas-ing withn because it has been shown in Section III-C that belt looseness affects mainly the low frequencies
XCR= Pnlim n =1n1cCR(n) Pnlim n =1n1 . (7)
In the following, the number of considered signatures is set to nlim= 10. This number has been chosen empirically in order to
have enough coefficient so the indicator is stable. Adding more coefficients does not impact too much the indicator due to the 1/n weighting.
C. Diagnosis Process
Belt transmission systems are widely used in industrial appli-cations such as compressors, pumps, or fans. Their load condi-tion can then change during their lifetime and seems difficult to impose. Unfortunately, the fault indicator value might change with the load condition even in healthy cases. In order to over-come this issue and increase the reliability of the indicator, Fournier et al. have presented a promising technique in [22] based on the torque–load plan segmentation. The idea is to seg-ment the torque–load plan in several zones in order to compute a healthy reference by zone. This way, when the diagnosis is pro-cessed, it is compared to the healthy reference of corresponding load and torque, and the proposed indicator will work even if machine changes its load conditions during its lifetime.
Here, the torque–load plan has been divided into 50 zones according the recommendations of [22]. Five diagnosis speeds
have been chosen fromΩ1 = 300 r/min to Ω5 = 2700 r/min
every 600 r/min. Ten load conditions have been chosen at every 6 A. For each diagnosis phase, the speed is set to the closest diagnosis speed, so the application is not too much impacted by the diagnosis. During the machine lifetime, the diagnosis phase is processed regularly. At the beginning, the indicator values are used to compute the healthy reference, supposing that the application is correctly functioning. Once a sufficient number of measures have been obtained to compute a healthy reference for a zone, the zone is considered as active and can be diagnosed. After a certain amount of time, the learning part is
Algorithm 1: Diagnosis Process. while Application lifetime do
if Diagnosis phase then
Speed estimationΩe
Speed set to the closest diagnosis speedΩi
Sector definition Measurement Speed back toΩe
Computation ofcCR(n)
if Sector is “active” then
Computation ofXCR ifXCR> threshold then Alarm end if else Computation ofmn andσn
if Enough measurements then
Sector is set to “active”
end if end if end if end while
considered to be over in order not to used faulty cases to build the healthy reference. Sectors that are not active will be impossible to diagnose. Algorithm 1 details the diagnosis process over different zones.
V. RESULTS ANDDISCUSSION
A. Evaluation Protocol
The proposed methodology has been evaluated on the experi-mental bench presented in Section II-A. Healthy (d1), moderate
(d2), and strong (d3) belt looseness has been tested. Critical
belt looseness (d4) has not been evaluated here because the belt
slip was too strong for the application to work. Several load– torque conditions have been explored in order to simulate the functioning of a compressor-like application. It corresponds to
Ω3 = 1500 r/min, Ω4 = 2100 r/min, and Ω5 = 2700 r/min, and
toI5 = 26 A, I8 = 38 A, I9 = 45 A, and I10 = 52 A. So, a
total of 12 sectors have been tested.
A total number of 960 recordings have been performed in conditiond1. These recordings will allow the computation of the
healthy references in different conditions and also the evaluation of the indicator in healthy cases with data different than those used for the reference. For faulty conditions, 360 recordings
have been done in each belt conditiond2 andd3. The number
of recordings used to compute the healthy reference is set to Nref= 50. All recordings have a length of 5 s. Three indicators
are evaluated in this section:
1) |IF(fr)|, the instantaneous frequency at fr under the
steady state (cf., Section III-B);
2) IFCR(fr), the instantaneous frequency at fr under the
steady state with the normalization process presented in Section IV-B;
3) XCR, the proposed indicator using a square-wave speed
reference.
The detection threshold used for each indicator is a1% detec-tion threshold and is notedt1%. It is defined as the value which
guarantees a maximum of1% detection in the healthy condition,
i.e.,1% false alarms. This threshold is empirically defined for |IF(fr)| and statistically defined for IFCR(fr) and XCR. Three
criteria are used to evaluate different indicators:
1) FA, the percentage of false alarms in the healthy condition;
2) TD(d2), the percentage of good detections for moderate
belt looseness;
3) TD(d3), the percentage of good detections for strong belt
looseness.
Another test campaign has been run in order to evaluate the proposed indicator with a nonunitary ratio. The diameters of the driver pulley and the driven pulley used in this campaign are,
respectively, Ddriver= 250 mm and Ddriven= 160 mm, which
implies a transmission ratioRt ≃ 1.56. The length of the belts
has also been changed to Lbelts= 1757 mm in order to adapt
to the new configuration. Recordings have been done in the case of healthy belt (d1) and strong belt looseness (d3). The
same torque–load conditions were explored than in the first
test campaign except forΩ5. This speed would have needed
to increase the IM speed to 4212 r/min, which is higher than its nominal value. A total number of 1280 recordings were performed in this second campaign: half in thed1condition and
half in thed3condition.
B. Results
The diagnosis process presented in Section IV-C has been applied to different recordings. The three indicators are dis-played inFig. 9.|IF(fr)| is pictured in (a), IFCR(fr) in (b), and
XCRin (c). The thresholdt1%is depicted in red. The signatures
are displayed in function of the recording number. In each belt condition, lower recording number corresponds to lower load condition. The vertical lines corresponds to condition changes (load or speed).
The detection results are summed up inTable IIIfor different indicators.
Tables IVandVdetail the results obtained with the proposed indicatorss for each speed–torque condition for moderate and strong belt looseness, respectively.
Table VIdisplays the results obtained with a nonunitary trans-mission ratio. Results obtained with IFCR(fr) and XCRonly are
presented because it can be seen fromTable IIIthat|IF(fr)| has
poor performance.
C. Discussion
The analysis ofFig. 9shows that the raw indicator|IF(fr)| is
not well suited for robust detection all over the torque–load plan. It is very noisy, and its value in the healthy condition varies in such a way that it is sometimes higher in the healthy condition than for moderate or strong belt looseness. This is not the case for the normalized indicators. Their value is close to zero dur-ing the healthy functiondur-ing and increase only in the case of belt
Fig. 9. Evolution of (a)|IF(fr)| indicator, (b)IFCR(fr) indicator, and (c) XCR indicator with the t1 % threshold in red for healthy belt and moderate belt looseness, and strong belt looseness.
looseness. This point illustrates one of the advantages of the pro-posed method. The normalization step ensures that the healthy values are close to zero, and the torque–speed plan segmenta-tion ensures that this is the case whatever the load and speed conditions. Thus, only the significant increases are enlightened by the indicators, corresponding to belt looseness. The blanks of the normalized indicators correspond to the learning of the healthy reference for each sector. Moreover, it is interesting to note that the proposed indicator reacts more proportionally with belt looseness than IFCR(fr). This confirms that the use of the
transient state is better to observe belt looseness rather than the steady state.
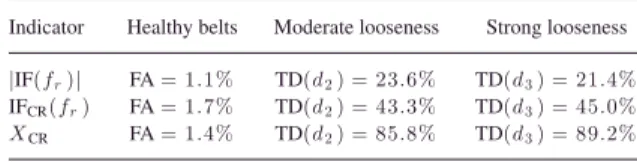
TABLE III
RESULTS OFDIFFERENTINDICATORS(UNITARYRATIO)
Indicator Healthy belts Moderate looseness Strong looseness
|IF(fr)| FA= 1.1% TD(d2) = 23.6% TD(d3) = 21.4%
IFCR(fr) FA= 1.7% TD(d2) = 43.3% TD(d3) = 45.0%
XCR FA= 1.4% TD(d2) = 85.8% TD(d3) = 89.2%
TABLE IV
DETECTIONRATE FOR THEPROPOSEDINDICATOR—MODERATE
BELTLOOSENESS Speed Ω3 Ω4 Ω5 Load I5 10% 20% 76% I8 100% 100% 100% I9 100% 100% 100% I1 0 100% 100% 100% TABLE V
DETECTIONRATE FOR THEPROPOSEDINDICATOR—STRONG
BELTLOOSENESS Speed Ω3 Ω4 Ω5 Load I5 27% 57% 70% I8 100% 100% 100% I9 100% 100% 100% I1 0 100% 100% 100% TABLE VI
RESULTS OFDIFFERENTINDICATORS(NONUNITARYRATIO)
Indicator Healthy belts Strong looseness
IFCR(fr) FA= 0.4% TD(d3) = 6.1%
XCR FA= 1.3% TD(d3) = 98.7%
The results ofTable IIIshow that there are 1% false alarms in all cases. These is normal because the threshold has been chosen in order to guarantee 1% false alarms. In the case of the normalized indicators IFCR(fr) and XCR, the percentage of
false alarms is slightly greater than 1%. This is explained by the fact that the threshold value has been chosen a priori, according to statistic laws. So, the experimental results confirm 1%. This point is very important because it demonstrates that the detec-tion threshold can be chosen a priori without any informadetec-tion on the indicator healthy values or on the application. This is another advantage of the normalization step. The torque–speed segmentation ensures that the normalization is done in every sector in order to increase the selectivity.
The detection results ofTable IIIconfirm the visual analysis. The proposed method reaches excellent results with more than 85% of correct detections of moderate belt looseness and almost 90% detections of strong belt looseness. The normalized steady
indicator IFCR(fr) only reaches 45% good detections of both
moderate and strong belt looseness, while the raw indicator |IF(fr)| barely detects 20% of belt looseness. This point shows
the advantage of the proposed method and confirms that the transient state is better to monitor belt looseness.
It can be noticed in Fig. 9 that different indicators mainly react for sectors with higher load conditions (the right part of
each zone) whatever the speed. The results of Tables IVand
V reflect this fact, and it looks like nondetection are closely linked to low-load conditions. This is very coherent withFig. 2
presented in Section III-A. The analysis of this figure showed that the relative belt slip increases with the load condition and that it remains almost the same for low-load conditions from I0 toIn/2. It can also be noticed from Tables IVandVthat
speed has only a little influence on results, except for low-torque conditions, where the detection is increased to 70% at speedΩ5.
So, it can be concluded that higher load conditions are better for diagnosis purposes. If it is not possible, high speed will be preferred for the diagnosis process.
The results obtained for a nonunitary transmission ratio (see
Table VI) confirm the efficiency of the proposed indicator in terms of robustness and sensibility. TheXCRindicator reaches
even a better detection rate with more than 98% strong belt looseness cases detected for only 1% false alarms. Contrari-wise, the results obtained with the IFCR(fr) indicator are rather
disappointed. Even if its robustness is good (FA= 0.4%), its
detection rate is very low with only 6.6% belt looseness cases detected. This fact can be explained by the use of a bigger pulley on the driver side. It increases the adhesion surface on the pulley rotating atfr. The signature obtained at this frequency are then
less sensible to the belt slip.
VI. CONCLUSION
This paper presents an innovative method to monitor belt looseness through the analysis of phase currents. The analysis of belt slip under steady and transient states for different speed and load conditions helped to define relevant spectral signatures for the monitoring. The conclusion of this study is that the transient state is more appropriate for belt looseness detection because a sudden acceleration amplifies the relative belt slip. Accord-ingly, an original method is proposed based on the addition of a low square-wave component to a constant speed reference. This method allows us to periodically observe the impact of belt looseness on phase currents and then to process it as a Fourier series. The Fourier series coefficients are normalized and av-eraged in order to detect drifts that are statistically significant. This indicator is computed on the torque–speed plan according to an original technique in order to increase the robustness of the detection.
The proposed indicator is evaluated on an experimental test bench with an IM of 30 kW for moderate and strong belt loose-ness. Three different speeds and four different load conditions have been tested. The method reaches excellent results with al-most 90% correct detections for 1% false alarms whatever the transmission ratio. As a comparison, indicators computed from the spectral analysis of phase currents under the steady state
reach barely 45% correct detections in the case of a 1:1 ratio. These results drop to 6.6% correct detections in the case of a nonunitary ratio. Moreover, the proposed method is robust to torque and speed changes even for low-load conditions, thanks to the torque–speed segmentation, and the threshold detection can be a priori chosen, thanks to the normalization process.
This method shows interesting results and confirms that the transient state is better for belt looseness monitoring. It has been demonstrated that high-load conditions must be privileged for diagnosis purposes. Future work will explore the use of other indicators, such as the phase, in addition of the signature ampli-tude in order to classify the fault severity and to propose a visual tool for the monitoring of belt looseness. Finally, this technique needs to be evaluated for other kind of faults or applications in order to evaluate if it enables fault discrimination.
ACKNOWLEDGMENT
The authors would like to thank H. Egreteau from Leroy Somer for his precious help and advices during the experimental tests carried out in this study as well as for the time he dedicated to perform them.
REFERENCES
[1] M. Delgado, G. Cirrincione, A. G. Espinosa, J. A. Ortega, and H. Henao, “Dedicated hierarchy of neural networks applied to bearings degradation assessment,” in Proc. 2013 9th IEEE Int. Symp., Diagnostics Electr. Mach., Power Electron. Drives, Aug. 2013, pp. 544–551.
[2] A. Picot, Z. Obeid, J. R´egnier, S. Poignant, O. Darnis, and P. Maussion, “Statistic-based spectral indicator for bearing fault detection in permanent-magnet synchronous machines using the stator current,” Mech. Syst. Signal Process., vol. 46, no. 2, pp. 424–441, 2014.
[3] T. W. Rauber, F. de Assis Boldt, and F. M. Varej˜ao, “Heterogeneous feature models and feature selection applied to bearing fault diagnosis,” IEEE Trans. Ind. Electron., vol. 62, no. 1, pp. 637–646, Jan. 2015. [4] H. Razik, M. E. K. Oumaamar, and G. Clerc, “A hybrid kangaroo
al-gorithm to assess the state of health of electric motors,” in Proc. 2013 9th IEEE Int. Symp., Diagnostics Electr. Mach., Power Electron. Drives, Aug. 2013, pp. 43–48.
[5] A. Soualhi, G. Clerc, and H. Razik, “Detection and diagnosis of faults in induction motor using an improved artificial ant clustering technique,” IEEE Trans. Ind. Electron., vol. 60, no. 9, pp. 4053–4062, Sep. 2013. [6] M. Y. Kaikaa, M. Hadjami, and A. Khezzar, “Effects of the simultaneous
presence of static eccentricity and broken rotor bars on the stator current of induction machine,” IEEE Trans. Ind. Electron., vol. 61, no. 5, pp. 2452– 2463, May 2014.
[7] K. H. Kim, “Simple online fault detecting scheme for short-circuited turn in a PMSM through current harmonic monitoring,” IEEE Trans. Ind. Electron., vol. 58, no. 6, pp. 2565–2568, Jun. 2011.
[8] F. R. Bl´anquez, C. A. Platero, E. Rebollo, and F. Bl´anquez, “Evaluation of the applicability of FRA for inter-turn fault detection in stator windings,” in Proc. 2013 9th IEEE Int. Symp., Diagnostics Electr. Mach., Power Electron. Drives, Aug. 2013, pp. 177–182.
[9] B. Aubert, J. R´egnier, S. Caux, and D. Alejo, “Kalman-filter-based indica-tor for online interturn short circuits detection in permanent-magnet syn-chronous generators,” IEEE Trans. Ind. Electron., vol. 62, no. 3, pp. 1921– 1930, Mar. 2015.
[10] S. McInerny and Y. Dai, “Basic vibration signal processing for bearing fault detection,” IEEE Trans. Educ., vol. 46, no. 1, pp. 149–156, Feb. 2003. [11] S. Djurovi´c, D. Vilchis-Rodriguez, and A. C. Smith, “Vibration monitoring for wound rotor induction machine winding fault detection,” in Proc. XXth Int. Conf. Electr. Mach., Sep. 2012, pp. 1906–1912.
[12] J. Harmouche, C. Delpha, and D. Diallo, “A global approach for the classification of bearing faults conditions using spectral features,” in Proc. IECON 2013-39th Annu. Conf. IEEE, Ind. Electron. Soc., Nov. 2013, pp. 7352–7357.
[13] M. E. H. Benbouzid, “A review of induction motors signature analysis as a medium for faults detection,” IEEE Trans. Ind. Electron., vol. 47, no. 5, pp. 984–993, Oct. 2000.
[14] M. Riera-Guasp, J. A. Antonino-Daviu, and G. A. Capolino, “Advances in electrical machine, power electronic, and drive condition monitoring and fault detection: State of the art,” IEEE Trans. Ind. Electron., vol. 62, no. 3, pp. 1746–1759, Mar. 2015.
[15] A. Picot, D. Zurita, J. Cari˜no, E. Fournier, J. R´egnier, and J. A. Ortega, “Industrial machinery diagnosis by means of normalized time-frequency maps,” in Proc. IEEE 10th Int. Symp., Diagnostics Electr. Mach., Power Electron. Drives, Sep. 2015, pp. 158–164.
[16] H. Yamashina, S. Okumura, and I. Kawai, “Development of a diagnosis technique for failures of V-belts by a cross-spectrum method and a dis-criminant function approach,” J. Intell. Manuf., vol. 7, no. 1, pp. 85–93, 1996.
[17] G. Gerbert, “Belt slip—A unified approach,” J. Mech. Design, vol. 118, no. 3, pp. 432–438, Sep. 1996.
[18] K. Seyfert, “Belt maintenance,” Motor, p. 41, May 2004.
[19] H. P. Bloch and F. K. Geitner, “Installation and maintenance of v-belt drives,” in Major Process Equipment Maintenance and Repair (ser. Practical Machinery Management for Process Plants), vol. 4, H. P. Bloch and F. K. Geitner, Eds. Houston, TX, USA: Gulf, 1997, pp. 310–328, ch. 7. [Online]. Available: http://www.sciencedirect.com/ science/article/pii/S1874694297800090
[20] E. Fournier, A. Picot, J. Regnier, C. Andrieux, J. Saint-Michel, and P. Maussion, “Effects of transmission belt looseness on electrical and mechanical measurements of an induction motor,” in Proc. IEEE 10th Int. Symp., Diagnostics Electr. Mach., Power Electron. Drives, Sep. 2015, pp. 259–265.
[21] A. Hazan, M. Verleysen, M. Cottrell, and J. Lacaille, “Probabilistic outlier detection in vibration spectra with small learning dataset,” in Proc. Int. Conf. Surveillance, 2011.
[22] E. Fournier, A. Picot, J. R´egnier, P. Maussion, M. TientcheuYamdeu, and J. M. Andr´ejak, “A generic diagnosis protocol for the monitoring of in-duction motors based on multiple statistical references in the torque-speed plane,” in Proc. 40th Annu. Conf. IEEE Ind. Electron. Soc., Oct. 2014, pp. 3348–3354.
[23] M. Blodt, M. Chabert, J. Regnier, and J. Faucher, “Mechanical load fault detection in induction motors by stator current time-frequency analysis,” IEEE Trans. Ind. Appl., vol. 42, no. 6, pp. 1454–1463, Nov./Dec. 2006.