HAL Id: tel-01315224
https://tel.archives-ouvertes.fr/tel-01315224
Submitted on 12 May 2016
HAL is a multi-disciplinary open access archive for the deposit and dissemination of sci-entific research documents, whether they are pub-lished or not. The documents may come from teaching and research institutions in France or abroad, or from public or private research centers.
L’archive ouverte pluridisciplinaire HAL, est destinée au dépôt et à la diffusion de documents scientifiques de niveau recherche, publiés ou non, émanant des établissements d’enseignement et de recherche français ou étrangers, des laboratoires publics ou privés.
ion specific effects on the aggregation of soft matter
system
Li Zhang
To cite this version:
Li Zhang. The study of phase separation in the miscibility gap and ion specific effects on the ag-gregation of soft matter system. Soft Condensed Matter [cond-mat.soft]. Université Paris Saclay (COmUE); Northwestern Polytechnical University (Chine), 2016. English. �NNT : 2016SACLS106�. �tel-01315224�
NNT : 2016SACLS106
T
HESE DE
D
OCTORAT
DE
N
ORTHWESTERN
P
OLYTECHNICAL
U
NIVERSITY
ET DE
L
’U
NIVERSITE
P
ARIS
-S
ACLAY
PREPAREE A L
’U
NIVERSITE
P
ARIS
-S
UD
ÉCOLE DOCTORALE N°564
P
HYSIQUE ENI
LE-
DE-F
RANCESpécialité de doctorat : P
HYSIQUE ParMme Li Zhang
The study of phase separation in the miscibility gap and ion specific effects on the
aggregation of soft matter systems
Thèse présentée et soutenue à Xi’an, le 7 Avril 2016 : Composition du Jury : Mme Y. P. Zheng M. J. Oberdisse M. W. X. Chen M. F. Muller Mme. A. Salonen M. N. Wang
Dr, Northwestern Polytechnical University Dr, Université de Montpellier
Dr, Xi’an Technological University Dr, ECE-PARIS
Dr, Université Paris-sud, Université Paris Saclay Professeur, Northwestern Polytechnical University
Présidente du Jury Rapporteur Rapporteur Examinatrice Directeur de thèse Directeur de thèse
1
Acknowledgements
I would like to extend my sincere gratitude to Prof. Nan Wang and Prof. Anniina Salonen for their instructive advice and patience throughout my thesis. This thesis is finished under their professional suggestions and inspiring encouragements. Their profound understanding in phase transition, foam and colloidal scie nce has helped me a lot in designing the ideas and experiments scientifically. Their enthusiasm for scientific research always encourages me to solve the difficulties conquered during the experimental process and data analysis.
Thank Prof. Nan Wang for giving me the opportunity to study in abroad, and Prof. Dominique Langevin and Prof. Anniina Salonen for offering me the chance to perform the research in Laboratoire de Physique des solides.
I really feel lucky that I am surrounded by the intelligent and lovely mates in the labs in China and France. I have benefited greatly from Prof. Anniina Salonen for providing me the chance to study the fascinating topic in LPS, for the experimental guidance, instrumental set up and use, data discussion and interpretation, valuable suggestions on the preparation for the conference, as well as for caring my daily life
2
in France, from Prof. Nan Wang for providing me an interesting topic through which I trained how to do scientific work, for persisting guidance on learning to think, experimental equipment design and data analysis, from Prof. Dominique Langevin, Prof. Doru Constantin, Prof. Giuseppe Foffi, Prof. François Muller, Prof. Fabrice Cousin, Dr. Alesya Mikhailovskaya, Dr. Joseph Tavacoli and Dr. Pavel Yazhgur for their valuable discussion and suggestions, from Dr. Julien Schmitt, and Dr. Cyrille Rochas for their helping in the SAXS experiment, from Dr. Delphine Hannoy for the surface tension measurement, From Zenaida Cenorina I.Q.UAN and Clément Honorez for helping in using rheometer, from Dr. Delphine Hannoy for teaching me in doing Zeta Potential measurement, from Dr. Eric Raspaud for generously letting me use the light scattering equipment, from Dr. Yin Li Peng and Liang Zhang for helping in the transparent system experiment.
I would like to thank Lorène Champougny, Wiebke Drenckhan, Emilie Forel, Thibaut Gaillard, Anaïs Giustiniani, Emmanuelle Rio, Matthieu Roche for being dedicated lab mates. Gratitude is extended to Lin Ji, Lei Wang, Li Li tian, Huan Yang, Yang Bai, Tong Qi Wen, Jia Chen Guo, Yun Fei Li for the support in my daily life and work.
Finally, I would like to give my warmly thanks to my parents, young brother and boyfriend for their permanent encouragement and immerse support in these years. Moreover, I am sincerely grateful for all my friends both in China and France, thanks for their helping when I met problems and cherishing the good memory we were together.
The thesis is supported by Doctorate Foundation of Northwestern Polytechnical University, the European Space Agency (MAP Hydrodynamics of wet foams), partially funded by ESA and the European Infrastructure Network QualityNano, and the China Scholarship Council.
Contents
Acknowledgements
... 1Chapter 1 Introduction
... 6Chapter 2 Background
... 102.1 Phase behavior in miscibility gap ... 10
2.1.1 Thermodynamics of liquid-liquid phase separation ...11
2.1.2 Kinetics of liquid-liquid phase separation: Nucleation growth and spinodal decomposition ... 13
2.1.3 Schematic phase diagram type of the systems with miscibility gap ... 15
2.1.4 Marangoni force ... 16 2.2 Colloidal gels ... 17 2.2.1 DLVO theory... 18 2.2.2 Gel structure... 19 2.3 Foam... 21 2.3.1 Surfactants ... 21 2.3.2 Foam structure... 22 2.3.3 Foam aging ... 23
2.3.4 Slowing down the ageing of foam ... 24
2.4 Hofmeister series... 25
2.4.1 Ions at interface ... 26
2.4.2 Interactions between colloidal partic les in the presence of electrolyte ... 27
Chapter 3 Materials and methods
... 293.1 Materials... 29
3.1.2 Gels ... 29
3.1.3 Foam ... 30
3.1.4 Gel foam... 30
3.2 Methods... 31
3.2.1 Sample preparation in miscibility gap and calculation ... 31
3.2.2 Gel sample preparation and measurements ... 33
3.2.3 Foam sample preparation and stability studies ... 35
3.2.4 Foam aging with gel phase ... 39
Chapter 4 Phase separation mechanisms studied in miscibility gap
... 414.1 Introduction ... 41
4.2 Results and discussion ... 42
4.2.1 Phase separation of SCN-H2O system in a uni-directional temperature field ... 42
4.2.2 Phase separation of SCN-H2O system at isothermal field ... 47
4.2.3 Growth rate and volume fraction of minority phase to the effect of the microstructure ... 50
4.2.4 The probability of produced muti-layer structure ... 51
4.2.5 The phase separation pattern to the effect of the solidif ied structure ... 52
4.3 Conclusions ... 54
Chapter 5 Influence of salt type on gelation kinetics (NaCl or KCl)
... 565.1 Introduction ... 56
5.2 Results and discussion ... 58
5.2.1 Gel General observations and phase diagrams... 58
5.2.2 Gel structure... 60
5.2.3 Kinetics ... 62
5.2.4 Scaling ... 65
5.2.5 Gel rheology at a given time ... 70
5.3 Conclusions ... 72
Chapter 6 Influence of different salts on the gelation kinetics
... 736.1 Introduction ... 73
6.2 Results and discussion ... 75
6.2.1 General observation of gel samples ... 75
6.2.2 The scaling behavior ... 76
6.2.3 Half-time of the transmitted intensity... 79
6.2.4 Stability of the gel system ... 81
6.3 Conclusions ... 83
Chapter 7 Mix salt and surfactant to make ultrastable and stimulable foam
... 857.1 Introduction ... 85
7.2 Results and discussion ... 86
7.2.2 Influence of changing SDS concentration on foam generation and stability ... 89
7.2.3 Kinetics of crystals formation ... 93
7.2.4 Structure of crystallites inside the foam... 95
7.2.5 Stimulating the foam by temperature ... 97
7.3 Conclusions ... 99
Chapter 8 Foam aging modified by the gel phase
...1008.1 Introduction ...100
8.2 Results and discussion ...101
8.2.1 The evolution of bubbles in the gel foam...101
8.2.2 The mechanical properties of the bulk gel phase...105
8.2.3 The effect of gel strength on foam aging ...106
8.2.4 Correlation behavior ...108
8.2.5 Small angle Neutron Scattering measurements ... 110
8.3 Conclusions ... 116
Chapter 9 Conclusions
... 118Bibliography
...121Chapter 1 Introduction
Many common industrial products and processes are composed of multiple phases that are incompatible. Depending on the processes the systems can be required to remain separate, such as foams and emulsions (mixtures of gas and fluid or 2 fluids) where the dispersions are stabilized through the use of interfacial active molecules or particles. Such systems also include particulate suspensions (such as paints, paper, soil, clays and so on), which are often stabilised by surface charges. However, in other cases the mixtures are not stabilised and phase separation occurs through coarsening. The phase separation process can be important as it determines the structure of the final material. For example, metal alloys with special microstructure are made by cooling from a temperature above the melting temperature, similarly to many polymer systems. Meanwhile, particles can aggregate as the solid phase comes out.
There is a wide range of systems that exhibit phase separation and my thesis has concentrated on the study of various types of such systems. I have studied the phase separation of a transparent system in the miscibility gap in China, but in 09.2013 as I got the opportunity to spend one and a half years in France as part of my studies I concentrated on slightly different systems. My project is to study the ion specific
effects on the aggregation of soft matter systems. Therefore, in my thesis, Chapter 4 is my work in China and Chapter 5, 6, 7 and 8 are the work in France.
My work in China concentrated on studying the phase separation in the miscibility gap. When the temperature is quenched into the miscibility gap, a phase separation process occurred. Which is either nucleation growth (NG) or spinodal decomposition (SD). The study of the phase separation pattern in the miscibility gap is significant from a practical viewpoint for providing a novel approach to create special regular microstructures. This suggests that it is necessary to study the evolution of microstructure under certain conditions and formation kinetics of minority phase. In this dissertation, a transparent system with a miscibility gap is used to investigate the aging of microstructure for SD and NG type with the thermal gradient and the growth rate of minority phase with isothermal field.
In France I worked on making stable foam through the formation of a gel inside the foam. Adding salt to the dispersion of colloidal particles can lead to aggregation due to screening of repulsive electrostatic force between particles and make gels, which have many applications such as in food and material science. It’s important to know how the gel ages with time, which has already been widely studied. However, previous studies tend to observe the macroscopic gelation time and using the same salt at various concentrations when comparing the gel properties. In this dissertation, we first observe the microscopic gelation time and then compare the gel properties in the presence of different types of salts.
Obtaining stable foams is an important issue in the view of their large variety of applications. There are many ways to make stable foa ms up to now. However, many of them are complicated. In this dissertation, by adding high concentrations of salt (NaCl or KCl) to surfactant SDS, ultrastable foam can be made and the foam is temperature sensitive. In addition, solid foams also have numerous applications due to their low mass density and high surface area properties. This indicates that it’s important to know how the aging of bubbles during the foam changes as the continuous phase goes from a liquid to a solid (gel). In this dissertation, ge l phase is used to modify the foam stability.
Outline of the thesis is as follows:
the manuscript.
Chapter 3 describes the experimental methods and materials used.
Chapter 4 Presents SD and NG type phase separation in the miscibility gap. Under the temperature gradient, layer structures can be formed with both types but their morphologies are not the same due to the higher growth rate and volume fraction of minority phase with SD type. If the parameters are controlled appropriately, multilayer structure can be formed as well. In the high speed solidification process, the initial network like structure of SD type can be preserved. So these two types can
produce different morphologies both in the early and late stages of phase separation. Chapter 5 describes the gelation process in the presence of salt NaCl or KCl.
Macroscopic and microscopic timescales show that the solidification with KCl is much faster than with NaCl. But their properties can be scaled onto a single master curve, both the local structure and rheology. This suggests that the ion types only change the kinetics but not the final structure of gels. At the same timescale, the gel structure formed is more flexible with NaCl and more robust with KCl.
Chapter 6 continues the study started in Chapter 5 and explores the kinetics of gel formation using a wider range of salts, but restricting the experiments to light transmission. The transmitted light intensities can be scaled onto single master curve, showing that (at least at the length-scales probed using light transmission) the gelation process differs only in the kinetics even with a wider range of salts.
Chapter 7 shows that ultrastable foams can be made below the Krafft temperature through adding a high salt concentration NaCl or KCl to SDS. The foams are stable or not dependant on the kinetics of crystal formation. If crystallization is too slow, the foam has time to disappear. If the crystals have time to form on the surfaces of the bubbles the foams are stable over months or until they are heated to melt the crystals at which point they start to age and disappear quickly. However, unstable foam still can be obtained if too much foam produced at certain formed crystals even the crystal formation kinetics is not so slow.
Chapter 8 combines what we have learnt in the previous chapters to try and create solid foams by forming a silica gel inside the foam matrix. Combining the results of rheology measurements, averaged bubble size measurements and the
correlation behavior, we show that the foam aging can be arrested with higher gel strength and faster gelation time, indicating that the gel strength and gelation kinetics are two important factors to control the foam stability.
Chapter 2 Background
2.1 Phase behavior in miscibility gap
The definition of a miscibility gap from the science dictionary is that the region of temperature and composition in which two kinds of liquids form two layers or phases when brought together. A miscibility gap in the liquid state exists in a considerable number of largely different systems such as organic liquids [1], metal- metal/oxide systems [2, 3], polymer mixtures [4-8], glasses [9], or most common ingredients to daily experience in cooking, water and oil. The list of materials being immiscible in the liquid state is endless.
The materials in the miscibility region have a wide range of applications. For example, immiscible organic liquids are widely used in cosmetic and food industry, metallic systems are often used as switches, electrical contacts and bearing in car engines [3], immiscible glasses are mostly used as shock-resistant ceramics, low-thermal expansion glasses and so on [9].
final microstructure. Therefore, studying the phase behavior in the miscibility gap can lead to a better understanding and control of the microstructure.
2.1.1 Thermodynamics of liquid-liquid phase separation
According to the theory of thermodynamic s, the system can spontaneously occur only when the change of Gibbs free energy is less than 0, the liquid- liquid phase separation obeys this criterion too. In the following we will use the law of regular solution to discuss the thermodynamic process of liquid- liquid phase separation.
When components A and B exist independently, the free energy of the system is given by Equation 2.1 as
( )
L L L
A B A A B B
G x G x G (2.1) Where xA, xB are the molar fractions of A and B respectively; GAL、GBL are the molar free energies of A and B; G(LA B ) is the molar free energy of the whole system when A and B are not mixed.
The molar free energy of mixing A and B, at constant temperature T and pressure P, can be written as
( )
L L
A B mix
G G G (2.2) whereGmixis the molar mixing free energy.
According to the Helmholtz-Gibbs Equation, the relationship between molar mixing free energy Gmix and molar mixing enthalpyHmix and molar mixing entropySmix as
mix mix mix
G H T S
(2.3) For a regular solution, Hmixcan be expressed as
mix A B
H x x
(2.4) Where
is a coefficient related to the change of free energy and coordination number when components A and B mixed.xAandxBare the molar fraction of A and B, and satisfy the relationship xAxB 1. From statistical thermodynamics, we know that the mixing entropy of the solution can be expressed as( ln ln )
mix A A B B
S R x x x x
(2.5)
Where R is the gas constant. xAandxBare smaller than 1, soSmixis always positive. The mixing free energyGmixis given by Equations (1.3), (1.4) and (1.5) as
A B ( Aln A+ Bln B) mix
G x x RT x x x x
(2.6)
The second term on the right of Equation (1.6) is negative, so a value of mixing free energy higher or lower than 0 depends on the first term. There are two conditions:
(1) For exothermic solutions, the mixing enthalpyHmix0 at all temperatures and all compositions mixed results in the decrease of the free energy (Gmix 0). The system can occur spontaneously.
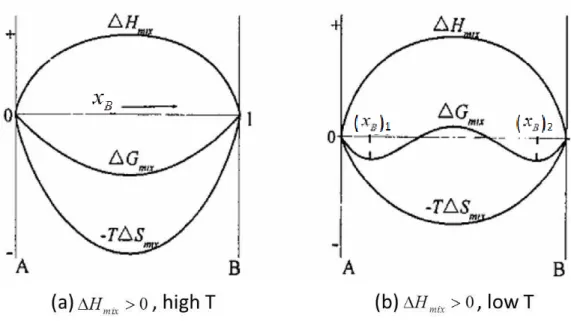
(2) For the endothermic solutions, the mixing enthalpyHmix 0, and whether the system can occur spontaneously depends on the temperature and composition of the system. When the temperature is high, T S mixis higher thanHmixfor all the compositions andGmixis still lower than 0 as shown in Figure 2.1(a). Therefore, the system still can occur spontaneously. When the temperature is low, for some compositionsT S mixis higher thanHmixand for some compositionsT S mixis lower
Figure 2.1 The curves of mixing Gibbs-free energy (Gmix) at different temperatures when the
mixing enthalpy ΔH>0, A and B represent two components, xBrepresents the molar fraction of
component B, Smixis the molar mixing entropy and T is the temperature. (a) at high temperature,
thanHmix, so Gmixis not always lower than 0 at all the compositions as shown in Figure 2.1(b). In other words, the system cannot occur spontaneously at all the compositions.
2.1.2 Kinetics of liquid-liquid phase separation: Nucleation growth
and spinodal decomposition
Figure 2.2(a) gives the curve ofGmix plotted versusxBat temperature T1. The points A and B represent the points where the straight dashed red line touch A and B is tangential to the curve and called the binodal points. All the binodal points at all the temperatures make the binodal curve, which can be obtained from the Equation
0 m B T G x
Put into Equation (1.6) this gives
B A x ln 0 x A B x x RT
B
B B 1- 2x 1- x ln x T R (2.7)This is the Equation of the binodal curve in a liquid- liquid immiscible gap as shown in Figure 2.2(b).
The points P and Q are the points of inflection, where the curvature of the curve mix
G
changes sign, and are called the spinodal points. All the spinodal points at all the temperature range assemble the spinodal curve, which can be obtained from the Equation 2 2 0 m B T G x
Used with Equation (2.6) this gives
A B 1 1 2 ( + ) 0 x x -
RT
B B x 1- x 2 T R (2.8)This is the Equation of the spinodal curve in a liquid- liquid immiscible gap as shown in Figure 2.2(b).
misciblility gap into another two regions:
(1) Metastable region: The region between binodal curve and spinodal curve, where the phase separation pattern is called nucleation growth (NG).
(2) Unstable region: The region surrounded by the spinodal curve, where the phase separation pattern is called spinodal decomposition (SD).
Figure 2.2 Schematic diagram of ∆Gmix versus XB at temperature T1 (a) and the formed binodal
and spinodal curves (b).
NG type phase separation is associated with metastability, which means that the existence of an energy barrier, small fluctuations in compositions can lead to the increase of the free energy. However, it can decrease for larger fluctuations if the mixture separates into two phases of compositions corresponding to the two points A and B in Figure 2.2(a). In this condition, domains of a minimum size, of the so-called critical nucleation radius, are necessary. The concentration profile of NG is illustrated in Figure 2.3(a) [10], this kind of phase separation mechanism results in domain size increasing with time and the domains tend to be spherical in nature.
As shown in Figure 2.2(b), SD type phase separation is associated with instability, which takes place in a completely different way compared with NG type. Small fluctuations in composition between the point P and Q as shown in Figure 2.2(a) can lead to the lowest free energy. The concentration profile of SD is illustrated in Figure 2.3(b), a continuous growth of the amplitude of a concentration fluctuation
without change the wavelength, starting from the infinitesimal values and to the final state of the two equilibrium phases. The initial phase separation structure is interconnected. However, it must be pointed out that with time both kinds of domains (NG and SD) may coalesce and form larger and larger spherical structures in the late stages of phase separation.
Figure 2.3 Schematic drawing of the concentration profiles during phase separation [10] via (a)
nucleation and (b) spinodal decomposition.
2.1.3 Schematic phase diagram type of the systems with miscibility
gap
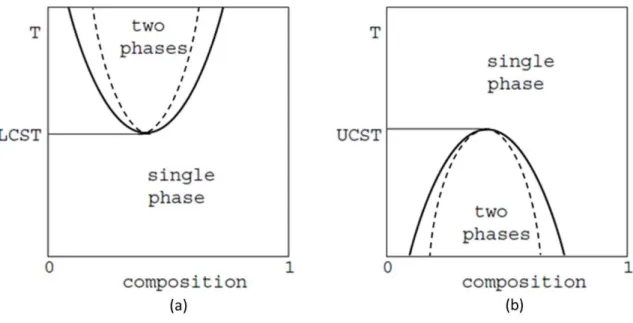
For the variety of systems with a miscib ility gap, normally there are two types phase diagram as shown in Figure 2.4, the solid line is binodal line and the dash one is the spinodal line [11]. (a) is the first type with a lower critical solution temperature (LCST) above which there are two phases with increasing T that a certain range of concentrations increase in width and below which there is a single phase for all the compositions. (b) is the second type with an upper critical solution temperature (UCST) below which there are two phases with decreasing T that a certain range of concentrations increase in width and above which there is a single phase for all the concentrations. Normally, many polymer systems have LCSTs, and most solutions of
small molecules have UCSTs. However, more complicated type of behavior with more than one UCST or LCST or neither type of critical solution temperature are also observed for polymers.
Figure 2.4 Schematic phase diagrams for mixtures showing binodals and spinodals with (a) lower and (b) upper critical solution temperature.
2.1.4 Marangoni force
Young, Ratke et al [12-15] showed that in the liquid-liquid miscibility gap if there is an interfacial tension gradient between the second phase droplets formed through NG or SD and the matrix phase, the droplets would be pushed to the lower interfacial energy region by the Marangoni force [15], which results from the interfacial tension gradient. The resulting terminal velocity of the droplets is given by
x T T r v m d m
2 3 3 2 (2.9) Where r is the radius of the droplet, d and m are the viscosities of the droplet and the liquid matrix, is the interfacial energy, T is the temperature, and x is the distance.2.2 Colloidal gels
Colloids are particles that are small enough to be influenced by thermal fluctuations and not dominated by gravity. This means that they typically have a size in the range from around 1nm to 1 μm. Colloidal particles are important in many fields of science and technology, in particular to change the rheological properties of fluids [16-21]. Often, the dispersed colloidal particles are insoluble in water, but stabilized to form aqueous dispersions through electrostatic repulsion, which should be stronger than the Van der Waals attraction.
However, if the suspension is destabilized the particles aggregate and can form a gel. The basic definition of a gel from Britannica encyclopedia: coherent mass consisting of a liquid in which particles are either dispersed or arranged in a fine network throughout the mass. In rheological terms the gel point can be defined as the point where the Storage modulus (G’) becomes higher than the Loss modulus (G’’) indicating that the fluid has transitioned from fluid like behavior to solid elastic behavior [22]. However, the resulting gels can be very different, they can be jellylike or elastic, or quite solid and rigid (like silica gels) [23].
Previous experiments and theoretical predictions have shown that the gelation of any particle system with short–range attraction is a direct consequence of liquid- gas phase separation [24-27]. The typical phase diagram of particle gelation with short range attraction (for example due depletion because to the addition of polymer) is given in Figure 2.5, where you can see the red binodal line and black dashed spinodal line as in the systems with miscibility gap. The x-axis is the packing fraction and the y-axis is temperature, which is inversely related to the attraction strength. The scenario of an arrested phase separatio n is observed if a quench is performed at a temperature below the temperatureTgsp . On the other hand, if the temperature is higher than Tgsp in the two phase region, the system would undergo a standard phase separation into a gas and liquid phase [28].
Gels have a variety of applications and can be produced in many systems. In this dissertation, we are working with charged colloids by adding salt to screen the repulsive electrostatic force between them to make gel. This is the reason why we only talk about colloidal gels.
Figure 2.5 Schematic picture of the interrupted phase separation or arrested spinodal scenario [29].
2.2.1 DLVO theory
As discussed above, the repulsive electrostatic and the attractive van der Waal forces play an important role in the stability of colloidal particle dispersions. In this setting, the interaction between these two forces can be qualitatively explained using the theory developed by Derjaguin, Landau, Verwey and Overbeek (DLVO)[30].
A major advance in colloidal science occurred during the 1940s when two groups of scientists-Boris Derjaguin and the renowned physicist Lev Landau in the Soviet Union and Evert Verwey and Theo Overbeek in the Netherlands- independently published a quantitative theoretical analysis of the problem of colloidal stability. The theory they proposed became known by the initial letters of their names: DLVO , which assumes that the more long-ranged interparticles interactions mainly control colloidal stability. Two types of force are considered. A long range van der Waals force (UA(r)) and a repulsive double- layer force (UC(r)) [31, 32]. The total interaction between the charged particles is thus given by a sum of the Van der Waals attraction and the Coulombic repulsion:
UDLVOUVDW UEL (2.10)
The fast aggregation (the aggregation process is solely limited by mutual diffusion or Brownian motion) of colloidal systems is governed by an attractive
interaction potential and the slow aggregation (the aggregation process is limited by some remaining repulsive electrostatic forces) is controlled by a thermally activated energy barrier crossing. The aggregation of particles is faster at higher salt concentrations or for weakly charged particles, while it is slower at low salt concentrations or for highly charged particles [31, 33]. The transition from an attractive potential to a barrier controlled aggregation is called the critical coagulation concentration (CCC). The DLVO theory has successfully predicted how the CCC decreases with an increased ion valence, consistent with the Schulze-Hardy rule. Since the 1940s, the theory has been widely used to explain different phenomena found in colloid science. It has worked reasonably well for low electrolyte concentrations, where electrostatics dominates [34-36].
The DLVO theory for the stability of lyophobic colloidal suspensions is based on the hard sphere- like colloidal particles interacting with the point- like ions through the Coulomb potential. It showed that the primary minimum interaction potential between colloidal particles is arising from the mutual van der Waals attraction, which is not accessible at low electrolyte concentrations because of a large energy barrier. When the electrolyte concentration is higher than the critical coagulation concentration (CCC), the barrier height of the energy drops down to zero, which leads to the aggregation of colloids and precipitation. However, the DLVO theory predicts that the CCC should be the same for all monovalent electrolytes, which is apparently not the case [37-41]. The total interaction between the particles should include the non-DLVO force, such as the dispersion force and so on:
VDW EL DIS
U U U U (2.11) We will describe the specific salt effects more in section 2.4.
2.2.2 Gel structure
Once the colloids are no longer stable in solution they start to aggregate. Depending on their concentration they form different types of structures. In many cases the aggregation process leads to the formation of a gel, so a large solid network that spans macroscopic space. However, at very low volume fractions of colloidal particles, the aggregation can be so slow that the clusters sediment before they can form a spaces panning gel [42, 43]. Classical light scattering studies of the
aggregation of colloidal particles show that the structure of the aggregates can be characterized in the frame of fractal geometry using the equation:
f
D
S( q ) q (2.12) Where S(q) is the structure factor, q the scattering vector, and Df is the fractal
dimension [44-46]. This method is what the researchers often use to get the structure of gels.
Lin et al [47-50] have shown that using a combination of dynamic and static light scattering. Colloidal aggregation exhibits two universal limits: diffusion limited colloid aggregation (DLCA) which is characterized by a complete destabilization of the colloidal suspension with aggregation taking place upon every collision and reaction limited colloid aggregation (RLCA) for which some remaining electrostatic forces allow only a small fraction of collisions to result in aggregation. The structure of the aggregates in DLCA is rather open and a fractal dimension of Df ~1.8 has been
found both in experiments and computer simulations [50]. For comparison, the lower sticking probability in RLCA results in denser aggregates with Df ~2.1, which has also
been confirmed in experiments and computer simulations [49, 51-53].
Figure 2.6 A schematic illustration of the storage modulus (G’) and the loss modulus (G’’) evolution with time during gel formation [54].
The aggregate structures are linked to the mechanical properties of the gels. Small amplitude oscillations are often performed to monitor the gel formation in colloidal dispersions as illustrated in Figure 2.6, where the storage and loss moduli are
shown as a function of time measured at a certain frequency and amplitude. The storage modulus (G’) in viscoelastic solids measures the stored energy, representing the elastic portion; the loss modulus (G’’) measures the energy dissipated as heat, representing the viscous portion. As the definition given in the previous part, the gel point shown in Figure 2.6 is the point where storage modulus is equal to the loss modulus indicated by the black arrow. The mechanical properties of colloidal gels are important in many technological areas. The fabrication of products such as paper, paint, pharmaceuticals, composites, or ceramics is often based on colloidal processing.
2.3 Foam
Aqueous foams are formed by the dispersion of gas bubbles in a water phase [55, 56]. In order to generate the foam, energy is needed to create the interface between the liquid and gas. The interfaces cost energy, which is why without suitable stabilizers foams are completely unstable and disappear very quickly. In order to prolong their stability various stabilizers are used, the stabilizers adsorb onto the gas/liquid interfaces. In this section I will summarize the basic properties of foams, in particular how they age and how their ageing can be slowed down or controlled. However, I will start by a short section describing surfactants which is what I have used to stabilize the gas/water interfaces.
2.3.1 Surfactants
Surfactant molecules have two parts o ne that is water soluble (oil insoluble) and another that is water insoluble (oil soluble). This gives rise to their unique properties and makes them adsorb onto interfaces and to modify the surface properties. In aqueous foams the surfactant molecules adsorb on the surfaces of the bubbles, with the water soluble hydrophilic head groups in the water phase and water insoluble hydrophobic tails extend into the gas phase.
Surfactants adsorb onto interfaces, and because of the hydrophobic parts they have a limited solubility in water. As more and more surfactant is added into solution at some point the surfactants no longer stay as monomers but start to aggregate, to form micelles (although other assemblies are also possible). The concentration at
which micelles start to form is called the critical micellar concentration (CMC), at this point the surface tension also saturates to almost a plateau. In some surfactant systems there is no CMC, but as the concentration increases at some point the surfactants precipitate out of solution. This concentration also depends on the temperature and is called the “Krafft boundary” [57].
2.3.2 Foam structure
The physical properties of foam depend strongly on the liquid fraction and the bubble size. The liquid fraction is defined by the liquid contained in a foam,
l V / Vl foam
= , the ratio of the volume of liquid to the total volume of the foam. At high liquid fractions, above random close packing of 36 % (critical liquid fraction C), they are not called foams, but bubbly liquids. Below this liquid fraction the bubbles become deformed and films are formed between bubbles. Typically the foams are called wet down to a liquid fraction of around 10% and foams below this are dry foams.
Figure 2.7 (a) Gas-liquid interface. (b) Cross section of a Plateau border with three films attached to it at point C [58], (c) Four Plateau borders (PBs) attached by a node, L is the length of PB and r
is the radius of PB [58], (d) Bulk foams.
The bubbles in foams self-organize to minimize the surface energy. Foam structure is complicated as they have specific structural features at a range of length-scales. Starting at the smallest length-scales (nanometers) the surfactants are arranged at the gas/water interfaces to stabilize the foam as shown in Figure 2.7. Where two bubbles meet a film is formed, and their thickness can vary from tens of nanometers up to microns depending on the bubble size and the liquid fraction (b). Where three films join together is called a Plateau border (PB) (b, c) and the junctions
between the PBs are nodes (c). The liquid skeleton of channels inside the foam is then composed of films, PBs and nodes. At even larger length-scales above that of individual bubbles (d) the macroscopic properties of the foam are determined. The properties of the foams is why are they are widely used, but understanding the microscopic origin of the properties is complicated as the properties are determined by those in all the length-scales below.
2.3.3 Foam aging
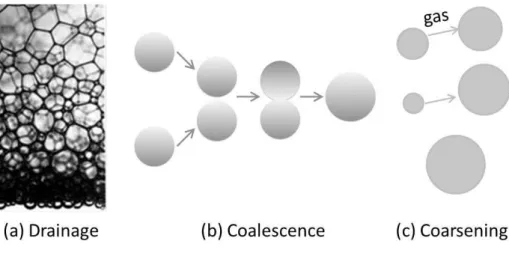
All foams are thermodynamically unstable. After the generation of foam, the liquid drains, and the bubbles grow with time. Eventually the foam disappears. The three destabilization mechanisms in foam are: drainage, coalescence, and coarsening as schematically illustrated in Figure 2.8.
Drainage
Drainage is the flow of liquid out of the foam and it results in drier foams. Gravity driven drainage occurs because of the density difference between gas and water leading to the flow of liquid out to the bottom of the foam. The liquid flows through the network of PBs and nodes, which can be quite narrow. This is why drainage depends strongly on the bubble size and the liquid fraction which determine the size of the channels. Drainage reduces the liquid fraction and leads to the drier foams, however in freely draining foam the foam is not homogeneous and it is the driest at the top (Figure 2.8.a) [55, 58-60].
Coalescence
Coalescence (Figure 2.8.b) of the bubbles is due to the rupture of the film, between two bubbles. It is also responsible for the collapse of foam, as the bubbles at the top coalesce with the atmosphere above leading to the complete disappearance o f the foam [61].
Coarsening
The last destabilization mechanism is coarsening (Figure 2.8.c), which is driven by the Laplace pressure as given by the Laplace-Young equation [62]:
2
P R
where R is the bubble’s principle radius of curvature.
Figure 2.8 Schematic drawing of the three main foam destabilization mechanisms. (a) is drainage of the liquid due to gravity, (b) Coalescence of two bubbles, (c) Coarsening of the bubbles due to
the Laplace pressure.
The gas pressure inside small bubbles is larger than inside large ones due to the curvature of the bubble surface. As a consequence, the gas diffuses through the aqueous films from the small towards the large bubbles leading to the disappearance of the smaller bubbles [63]. In this way, the bubbles disappear one after another and the remaining average bubble size increased.
2.3.4 Slowing down the ageing of foam
As discussed above, foams are thermodynamically unstable, although some surfactants are very efficient in slowing down the ageing mechanisms. In order to obtain very long lived (or ultrastable) foams, we need to find ways to radically slow down or even stop the mechanisms that destabilize the foams.
The simplest way to slow down drainage is to increase the fluid viscosity. For instance, adding some glycerol in the liquid phase leads to an increase of the bulk viscosity which leads to a decrease of the drainage rate [64]. However, this will never arrest the drainage. It will just be slowed down. In order to arrest drainage, the continuous phase has to be either solidified (to have a yield stress) or larger particles need to be trapped inside the channels to stop the channels from becoming smaller and therefore to stop the drainage. It has been shown that drainage can be arrested
using a colloidal gel (made of Laponite), as the yield stress of the gel becomes higher than the gravitational stresses driving the drainage of the foam [65].
In coarsening, the diffusion of gas through the liquid phase is the key step in the in the process. Therefore using a gas which is poorly soluble or insoluble in the liquid will slow down the gas transport through the liquid phase. Therefore, foam stability is higher in the presence of fluorinatedgases than nitrogen or air because their solubility is much lower in water. However, this again does not stop the coarsening completely.
In order to stop coarsening, theoretical and numerical studies on the dissolution of a single bubble have shown that either interfacial elasticity can arrest the foam coarsening when the Gibbs stability criteria is satisfied:
Ed > σ/2
(2.14)
Or the foam coarsening can be arrested through making the bulk elastic enough [66].
2.4 Hofmeister series
All salts are not equal, the first person to classify them according to their ability to salt out or salt in proteins was Franz Hofmeiste r after who the series of salts is named. According to their ability to precipitate proteins, the order of cations is usually given as follows:
N(CH3)+ < NH4+< Cs+ < Rb+ < K+ < Na+ < Li+ < Mg2+ < Ca2+
The sequence indicates that the negatively charged proteins remain stable in the presence of high concentration of electrolyte containing the ions on the right side, while they already precipitate at low concentration of electrolyte containing the ions on the left side. Although the first studies of Hofmeiste r effect was more than 100 years ago [67-69], the reasons behind the ordering in the Hofmeister series are still under debate. In a colloidal system, over more than a half century the aggregation behavior of colloidal particles has been explained quite well with the DLVO theory.
However, as has been discussed in 2.2.1 the CCC predicted by the theory is the same for all the monovalent electrolytes, which is not correct. It can’t explain the ion specific effects on the particle aggregation within the Hofmeister series, since it assumes that the ions have no difference except in their valence. In order to solve this
problem, one of the approaches is based on Collins’s concept of matching water affinities [70]. Depending on how the ions interact with water, they can be divided into two main groups: Kosmotropes and chaotropes as given in Figure 2.9. Kosmotropes have a large hydration shell around the ion and experience a repulsive dispersion potential with the surface. In contrast, chaotropes have a poor hydration shell around the ion and experience an attractive dispersion potential [71].
Figure 2.9 The Groups of IA alkali cations and VIIA halide anions are divided into kosmotrope (strongly hydrated) and chaotropes (weakly hydrated) according to their size [70]. The ions are
drawn approximately to scale of their bare radii.
2.4.1 Ions at interface
Although the properties of bulk electrolyte solutions can be described by the theory of Debye and Hückel (DH) [72], the surface properties of electrolytes remain a puzzle. The mystery first appeared when the surface tension of various electrolytes was measured by Heydweiller [73] and it was observed that it is larger than the interfacial tension of pure water. Recently theory and experiments have given new insight into this problem. By using only one adjustable parameter-the hydrated radius of sodium cation, ah=2.5 Å, Levin et al. [74] presented a new theory which can explicitly calculate the surface tension, the ionic density profiles, and the electrostatic potential difference across the solution-air interface. Predictions of the theory are found to be in excellent agreement with the experiments. Schelero et al. [75-78] investigated salt effects on the film thickness and stability of wetting films. They found that with increasing the ion size (decreasing charge densit y), both cations and anions show a stronger tendency to adsorb at the interface. The results demonstrate that the effect of the hydration shell of ions dominates over electrostatics on their adsorption at the air-water interface.
Except the air-water interface, the ions are absorbed on the surfaces of the colloidal particles screening the electrostatic interactions and leading to the aggregation of the colloidal particles [38-40, 79-81]. Oncsik et al. showed that the differences in the aggregation rates in the presence of different types of salts could be rationalized by taking into account the changing surface charge with the varying ion adsorption [82], poorly hydrated counterions absorb strong on the surface of
hydrophobic latex particles and well hydrated counterions adsorb weakly or not at all.
2.4.2 Interactions between colloidal particles in the presence
of electrolyte
The interactions between colloidal particles in aqueous electrolytes solut ion are relevant to fields ranging from molecular biology and bioengineering to the colloidal-based technologies. As we discussed above, for more than half century, their interactions are explained by the famous DLVO theory [83, 84], which is a very successful theory can reproduce many phenomena. However, specific ion effects are not taken into account in this theory.
Over the past 20 years, there has been a growing realization the importance of ionic polarizability (the effective rigidity of the electronic charge distribution), which play a significantly role in the ion specificity [85-88]. Ninham et al. [37, 89, 90] developed a more analytical approach to ion specificity published a series papers over the past decade and a half. They proved that the proper inclusion of quantum mechanical non-electrostatic dispersion interactions missing from the classical theories of electrolytes can explain ion specific effect at surfaces and in colloidal suspensions. The London- Lifshitz theory predicts that the dispersion interaction between a surface and an ion decays with the third power of separation and is proportional to the ionic polarizability [91]. The chaotropic ions (K+, Cs+) have an attractive dispersion potential with the micelle surface and the kosmotropic ions (Li+, Na+) have a repulsive dispersion potential [71]. Force measurements between silica surfaces in electrolyte solutions have given results consistent with the above theory. Taking ions at the same concentration, more chaotropic ions adsorbed onto the silica surfaces leading to a smaller force between the silica surfaces compared with the kosmotropic ions. Moreover, as the ion concentration is increased more cations absorb to the negatively charged silica surface and neutralize the surface charge, leading to screening the electrostatic repulsion to reveal the Van der Waals attraction. However,
the concentration needed to neutralize the surface is not the same for different cations, and it decreases as the cation radius increase. At even higher salt concentrations, repulsion reemerges due to the surface charge reversal by excess adsorbed cations [92]. Oncsik et al [82] also show that the ions of SCN- adsorption on positively charges particles leads to charge reversal. Therefore, we can see that the ions with same valence but different radius have different ability to aggregate particles.
Chapter 3 Materials and methods
3.1 Materials
3.1.1 Phase separation
Succinonitrile (SCN, ≥99.9 %) was purchased from J&K and used without further purification. Milli-Q water (18.2 MΩcm) was used to prepare the samples. Iron(Fe, ≥99.99 % ) and tin(Sn, ≥99.999 %) were purchased from Alfa Aesar. Argon (Ar) was used to eject the melted alloy to form ribbons. The mixture of HNO3 and alcohol was used to etch the samples.
3.1.2 Gels
Silica particles (Ludox TMA from Sigma Aldrich (TMA in the following)) with a particle diameter of 27 nm (from SAXS measurements) and a stock concentration of 34 wt% were used. The pH of the stock solution measured was 7.0. Sodium chloride (NaCl, ≥99.5 %), potassium chloride (KCl, ≥99.0 %), lithium chloride (LiCl, ≥99 %),
cesium chloride (CsCl, ≥99.9 %) and magnesium chloride (MgCl2, ≥ 99.9 %) were all from Sigma Aldrich and were used without further purification.
In the light transmission experiments, same silica particles were bought from the above company, but the pH is around 4, so the pH was changed to 7 by the addition of NaOH.
Milli-Q water (18.2 MΩcm) was used for the preparation of all the samples.
3.1.3 Foam
Sodium dodecyl sulfate (SDS, ≥99.0 %) was purchased from Sigma Aldrich and used without further purification. Sodium chloride (NaCl) and potassium chloride (KCl) were the same as in gel. Milli-Q water (18.2 MΩcm) and D2O were used for the preparation of aqueous solutions. Air was used as gas for most of the experiments and perfluorohexane C6F14 was added for the SANS experiments to slow down foam coarsening. Stock solutions of 1 M NaCl, 1 M KCl and 555 mM SDS were used in the sample preparations. Due to the hydrolysis of the SDS the surfactant stock solution was used within a week of preparation.
3.1.4 Gel foam
Sodium dodecyl sulfate (SDS) and sodium chloride (NaCl) were the same as in the foam. Silica particles were brought from the same company Sigma Aldrich as in the gel and have the same diameter with pH around 4. In all the related experiments, we change the pH of the silica to 8 by using NaOH to make the particles less charged and for the gel to form faster. Perfluorohexane C6F14 was used as gas to slow down the foam aging. Stock solutions of 4 M NaCl and 555 mM SDS were used in the sample preparations. The stock SDS solution was used within a week of preparation to avoid the hydrolysis of SDS.
3.2 Methods
3.2.1 Sample preparation in miscibility gap and calculation
3.2.1.1 SCN-H
2O system sample preparation
SCN was added to the water solution and heated to 353 K for 20 min, then the samples were immediately injected into the sandwiched cells with a dimension of 25
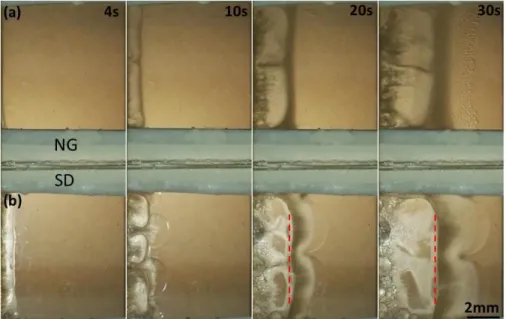
10 0.5 mm and sealed. The cell’s covers are made of glass and its height was controlled by the Teflon film spacers. During the experiment, a round copper block was used for producing an isothermal field and its temperature was controlled b y the 3504 Eurotherm. The isothermal field was used for the micro phase separation of nucleation growth (NG) and spinodal decomposition (SD) and observed by the optical microscope. Two copper blocks with 10 or 12 mm distance were used for producing a uni-directional thermal gradient and their temperature was controlled by the flow inside the copper blocks. The uni-directional thermal gradient was used for the macro phase separation of NG and SD simultaneously (the samples were put side by side or
separated) and observed by aSamsung camera. The samples were immiscible at room
temperature, and they were put in copper block at 353 K for 5 min before put in the copper block for observation.
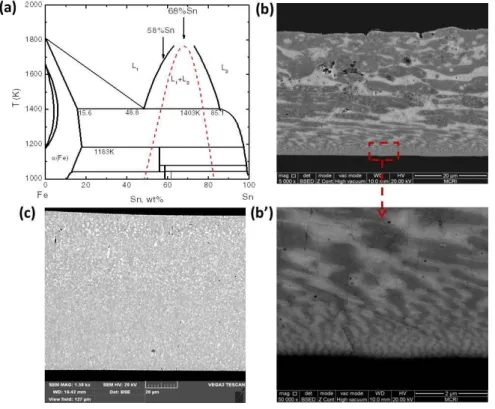
3.2.1.2 Fe-Sn ribbons preparation
The Fe-Sn alloys were melted by radio- frequency (RF) induction heating and overheated to about 100 K above its liquidus temperature for several minutes under an argon atmosphere in a 13 mm ID 15 mm OD 160 mm fused silica tube. The overheated samples were ejected by Ar atmosphere with an overpressure of 50 kPa through a nozzle (=0.7 mm) at the bottom of the silica tube onto a Cu single roller. The wheel speed was set as 3 or 10 m/s.
Then the Fe-Sn ribbons were mounted in epoxy, sectioned, polished, a nd etched with a mixture of 3 mL HNO3 + 100 mL alcohol. The solidification microstructures were examined by Zeiss MAT optical microscope and TESCAN VEGA3 LMH scanning electron microscopy (SEM). The chemical compositions of the identified constituent phases were determined with an energy dispersive spectrometer (EDS) fitted in SEM.
3.2.1.3 Calculation of the spinodal curve and volume fraction
According to the theories of the thermodynamics, the spinodal curve is calculated under the condition, 2 2 0
x
G , for given temperatures, in which G
is the difference in Gibbs free energy during phase transformation, and x is concentration.
On the basis of the thermodynamic theories, G can be expressed as [93]
n k k j i j i k i j i j i i i i x xx L x x x RT G 0 , ln (3.1)where R is the gas constant, T the temperature, xi and xj denote the
concentrations of pure substances i and j, ij k
L, is the kth binary interaction
parameter between i and j and may dependent on the temperature as A+BT, in which A and B are model parameters.
For SCN-H2O system, i j k
L, s are given as follows (k = 0, 1, 2, 3) [94]
2 0 19240 44.85 SCN,H O L T 2 1 9871 25.32 SCN,H O L T 2 2 9412 25.52 SCN,H O L T 2 3 19181 60.85 SCN,H O L T (3.2) For Fe-Sn system, ij
k
L, s are given as follows (k = 0) [95] 12.818T + 6676 0 Fe,Sn L (3.3) The spinodal curves of the SCN-H2O and Fe-Sn systems are calculated on the
basis of the above equations.
3.2.1.4 Calculation of the volume fraction
The density of SCN is 0.985g/cm3, which is close to the density of water 1 g/cm3.
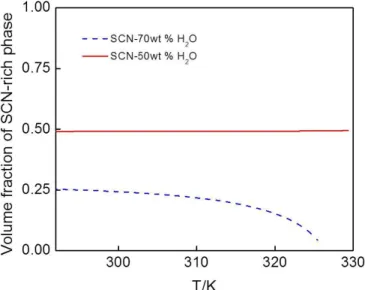
So the volume fraction is close to the mass fraction in the phase diagram. The schematic phase diagram in the miscible gap is shown in Figure 3.1. When the temperature is quenched to T, a sample with composition C separates to two phases L1 and L2, the corresponding concentration were C1and C2. We use the lever rule to
calculate the volume fraction, the volume fraction of L1 is 1 2 2 1 L C C f C C and 2 1 1 L L
f f . TM is the bottom temperature of the miscibility gap.
Figure 3.1 Schematic phase diagram in the miscible gap.
3.2.2 Gel sample preparation and measurements
3.2.2.1 Gel sample preparation and rheology measurement
Silica stock was added to salt solutions ranging from 0-500 mM in concentration and immediately agitated with a vortex mixer for 10 s to ensure homogeneous mixing. Samples were then sealed to avoid solvent evaporation and stored for observation - save for those samples prepared for SAXS and rheological experiments. These were immediately transferred into SAXS capillaries (see below) and into folded paper containers respectively, both of which were sealed and stored until the measurements. The paper containers allowed transfer of the samples into the rheometer with minimal perturbation.
After the gels go from liquid to solid, there a re several two ways to measure how their mechanical properties evolve. One way is to measure G’ and G’’ at different time after gelation by using small amplitude oscillations (fixed frequency of 10 Hz and strain 1 %), another way is to measure G’ and G’’ a t fixed time by using the strain sweep measurement (at constant strain rate amplitudes 5s-1, where the strain is from 0.05 to 25). The former is to obtain the mechanical properties evolution with time without destroying the structure of gel and the latter is to acquire the mechanical properties evolution with strain at breaking the gel structure. From these
measurements, we can know how the gel ages with time its yield strain.
3.2.2.2 SAXS measurements
The SAXS measurements were performed at the Europea n Synchrotron Radiation Facility (ESRF, Grenoble, France) on the bending magnet beamline BM02 (D2AM), at a photon energy of 7 keV. The experimental setup is described in detail in reference [96]. The data were acquired using a CCD Peltier-cooled camera (SCX90-1300, from Princeton Instruments Inc., New Jersey, USA) with a resolution of 1340 × 1300 pixels. Data preprocessing (dark current subtraction, flat field correction, radial regrouping and normalization) was performed using the bm2img software developed at the beamline.
The samples were contained in cylindrical glass capillaries (Mark-Rörchen) 1 mm in diameter and the exposure times were between 2 and 10 seconds, depending on the concentration. The samples which phase separate were measured in the lower solid-like phase.
3.2.2.3 Modeling SAXS data
The intensity scattered by the spherical silica colloids can always be written as: I(q)= ∆ρ2×n×S(q)×P(q) (3.4) where S(q) is the effective structure factor, P(q) is the form factor of individual colloids which is a constant characteristic of the system, ∆ρ is the electronic contrast of the colloids and n is the colloidal density.
The form factor, P(q), in the case of spherical silica colloids is [97]: P(q)=|F(q,R)|2=|3×sin(qR)-qR× cos(qR)
(qR)3 |
2
(3.5)
where F(q,R) is the scattering amplitude of a sphere of radius R.
Experimentally, the form factor (in fact ∆ρ2×n×P(q)) can be evaluated in two ways: i) from the scattered intensity I(q) of dilute solutions with high salt concentration (where the electrostatic interaction is screened, and the structure factor can be considered equal to 4); ii) from adjusting the scattering intensity I(q) at high q-values from various individual curves; a method allowing to estimate the uncertainty on and the effective values of ∆ρ2×n.
The effective structure factor is then obtained for each image as: S(q)
=
I(q)∆ρ2×n×P(q) (3.6)
During the formation of gels, S(q) becomes time-dependent (since I(q) is also time-dependent due to the clustering of the colloids) and is composed of two different contributions: i) the contribution of the effective interact ions between individual colloids inside the clusters; ii) the contribution of the cluster dimension. The first contribution arises at intermediate q-values while the second is at low q- values. In the case of mass fractal gels (as expected at the lowest volume fractions), the latter is characterized by an increase in forward scattering corresponding to the dependence of the signal as q-Df where D
f is the fractal dimension [44, 45]. However, our
experiments probe mainly the local colloidal environment due to the q-range accessible (the lowest q-value is around 4 × 10⁻³ Å-1
). In addition most of our experiments are at relatively high silica volume fractions where the experimental determination of the fractal dimension from the S(q) is not direct [98]. As a consequence, we use a simple model, where the contribution of the cluster inner structure is taken as a constant baseline, B, to which a power law is added, resulting in Aq-α+B. This has been applied for q<0.01Å-1 on the data once the S(q) have stopped evolving to obtain . We use the power exponent to compare the results at different volume fractions.
3.2.2.4 Light transmission observation for gels
Gel samples were prepared the same way as in 3.2.5. After the gel samples were prepared, they were transfer to a black box, light source was provided by the white light. Images were taken by a UEye camera every 5 minutes. Before starting to observe, a black cloth was covered on the black box to avoid environment light to influence the experiments.
3.2.3 Foam sample preparation and stability studies
3.2.3.1 Preparing KDS
KDS was obtained from SDS by an ion exchange in KCl solution [99]. SDS powder was dissolved in KCl solution (1M) at 50 °C up to a ratio of the components
of KCl:SDS = 2:1. Then the solution was allowed to stand at 50 °C for 2 h and at room temperature for next 12 h [99]. The sediment was filtered out using a Shott filte r, washed with Milli-Q water and acetone and dried in air until the mass remained constant. The product yield was about 95%.
3.2.3.2 Determination of the dissolution temperature and kinetics of
crystal formation
The samples were crystallized by cooling them below the dissolution temperature. The temperature was slowly increased by 1 ℃ every 30 minutes. Once the crystals started to dissolve this was slowed down to 0.5 ℃ every 30 minutes. The dissolution temperature was defined as the temperature when the cr ystals became invisible to the eyes. Then the samples were placed in a water bath heated 1 ℃ higher than the measured dissolution temperature above until no crystals can be observed. The temperature was then set to the target temperature at which the sample was observed and the time at which crystals started appearing was noted as the crystallization time.
3.2.3.3 Making foam
All the foams were prepared at room temperature (T=21±2℃), unless otherwise stated in the text. The foams were prepared using a setup consisting of two disposable syringes connected by a constriction. The volume of a syringe is 20 mL and the diameter of the constriction is 2 mm. The syringes are filled with air (with some C6F14 for the SANS experiment) and foaming solution. Salt solution and water start in one syringe, and the SDS solution in another. This ensures that they come into contact only as the foam generation process begins. Different ratios of liquid to gas were used to make the foams, most often 1:4 or 1:8, and the total volume of foam made was varied. The foam is formed by pushing the liquid and gas forward and backward through the constriction 40 times.
3.2.3.4 Foam stability studies
After making the foam, the samples were transferred into glass vials. Images were taken by a UEye camera every 5 minutes at room temperature and at varying intervals when heated (according to the foam disappearance rate). Some of the samples were photographed under a microscope to observe the bubble surfaces more
closely. For the heated samples, the temperature was set above the previously measured precipitation temperature, using the microscope to observe the micro evolution of the foam bubbles and a UEye camera to obtain the foam’s macro evolution.
3.2.3.5 Small angle neutron scattering experiments
The experiments were carried out at the Orphée reactor in Saclay on the PAXY spectrometer. Three different configurations were used with wavelengths of λ = 15 Å and λ = 4 Å and sample to detector distances of 6.75 m and 1.250 m. This gives an accessible scattering vector q-range from 2 × 10⁻³ to 5 × 10⁻¹ Å-1. Samples were enclosed in quartz cells of 1 mm inner thickness with pure D2O as solvent. All the measurements were performed at atmospheric pressure and room temperature. The scattered intensities were corrected for the detector background by cadmium scattering, for the parasitic intensity scattered by quartz cell and empty beam by subtraction and normalized to the water scattered intensity. Standard procedures for data reduction [100] were done using the Pasinet software [101]. Absolute values of the scattering intensity, I(Q)in cm-1, were obtained from the direct determination of the number of neutrons in the incident beam and the detector cell solid angle [102]. The scattering intensity of the solute was obtained by subtraction of the intensity of the solvent (measured independently) to the one of the solution. In the following, this final intensity will be noted I(q).
At high q (> 0.2 Å-1) the intensity saturates to a constant value for both samples due to the incoherent scattering. The intensity of the sample with KCl is higher, because the foam prepared with potassium is more stable and there is more sample. The foam made with NaCl the foam partially collapsed during the experiment.
3.2.3.6 Calculating the enthalpies of dissolution of NaDS and KDS
The equilibria between crystals and micelles are set by kinetic constants, which depend on the concentrations of the constituents. These kinetic constants can be linked to the change in Gibbs free energy as ∆G0= -RTlnK= ∆H0-T∆S and a Van’t Hoff plot will allow us to estimate the enthalpies of dissolution from
ln K= -
∆HRT
![Figure 2.3 Schematic drawing of the concentration profiles during phase separation [10] via (a) nucleation and (b) spinodal decomposition](https://thumb-eu.123doks.com/thumbv2/123doknet/14657110.738839/17.893.311.645.274.659/figure-schematic-concentration-profiles-separation-nucleation-spinodal-decomposition.webp)
![Figure 2.5 Schematic picture of the interrupted phase separation or arrested spinodal scenario [29]](https://thumb-eu.123doks.com/thumbv2/123doknet/14657110.738839/20.893.237.682.152.442/figure-schematic-picture-interrupted-separation-arrested-spinodal-scenario.webp)
![Figure 2.7 (a) Gas-liquid interface. (b) Cross section of a Plateau border with three films attached to it at point C [58], (c) Four Plateau borders (PBs) attached by a node, L is the length of PB and r](https://thumb-eu.123doks.com/thumbv2/123doknet/14657110.738839/24.893.143.755.618.797/figure-interface-section-plateau-attached-plateau-borders-attached.webp)