Characterization of laser-induced plasma and application to surface-assisted LIBS for powder and liquid samples
164
0
0
Texte intégral
Figure
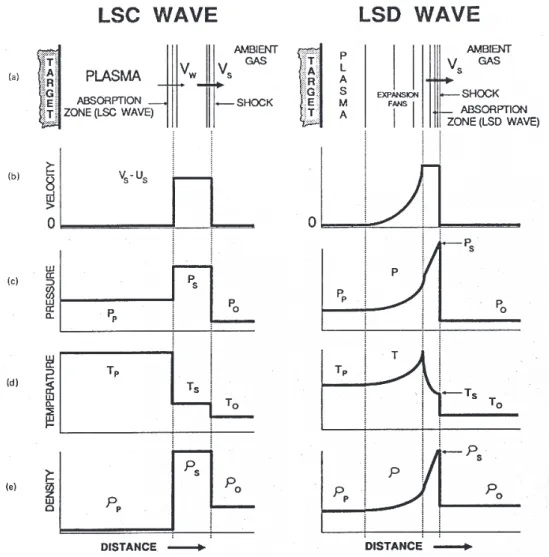
![Figure 1.2 Illustration of the spatial structure of laser-induced plasma in ambient gas [51]](https://thumb-eu.123doks.com/thumbv2/123doknet/14592323.730184/20.892.235.710.842.1089/figure-illustration-spatial-structure-laser-induced-plasma-ambient.webp)
+7


![Figure 3.5 Emissivity images of O I (in blue) of the plasmas induced on the aluminum plate with a thin film of powder [(a) to (d)] and on a glass sample [(e) to (h)]](https://thumb-eu.123doks.com/thumbv2/123doknet/14592323.730184/94.892.297.634.304.731/figure-emissivity-images-plasmas-induced-aluminum-powder-sample.webp)
![Figure 3.6 LIBS spectra in the spectral range from 240 nm to 420 nm of cellulose [(a), (c)] and alumina [(b), (d)] powders spiked into a Ti concentration of 400 ppm by weight, prepared in thin film [(a), (b)] or in pellet [(c), (d)]](https://thumb-eu.123doks.com/thumbv2/123doknet/14592323.730184/95.892.158.700.475.928/figure-spectra-spectral-cellulose-alumina-powders-concentration-prepared.webp)
Documents relatifs
