HAL Id: hal-02787429
https://hal.inrae.fr/hal-02787429
Submitted on 5 Jun 2020HAL is a multi-disciplinary open access archive for the deposit and dissemination of sci-entific research documents, whether they are pub-lished or not. The documents may come from teaching and research institutions in France or abroad, or from public or private research centers.
L’archive ouverte pluridisciplinaire HAL, est destinée au dépôt et à la diffusion de documents scientifiques de niveau recherche, publiés ou non, émanant des établissements d’enseignement et de recherche français ou étrangers, des laboratoires publics ou privés.
Exploration of pepsin diffusion in solid food particles by
dynamic fluorescence techniques
Elham Rakhshi
To cite this version:
Elham Rakhshi. Exploration of pepsin diffusion in solid food particles by dynamic fluorescence tech-niques. Food and Nutrition. 2019. �hal-02787429�
Mémoire de première année
Master Nutrition et Sciences des Aliments
Année universitaire* : 2018 - 2019
Parcours : MIAM Exploration of pepsin diffusion in solid food particles by dynamic fluorescence techniques
Par : Elham RAKHSHI
Document confidentiel : oui
Soutenu à Rennes le 25 Juin
Devant le jury : Françoise Nau
Sous la présidence de:Jean-François Hubert
Maître de stage : Juliane Floury Enseignant référent : Juliane Floury Autres membres du jury (Nom, Qualité):
"Les analyses et les conclusions de ce travail d'étudiant n'engagent
que la responsabilité de son auteur et non celle des établissements porteurs du diplôme.
« Lu et validé par le maître de stage, accord pour la soutenance »
Date : Signature :
( 65, rue de Saint Brieuc CS 84215
35042 Rennes cedex )
65, rue de Saint Brieuc CS 84215 35042 Rennes cedex 2, rue du Thabor 35000 Rennes 1, quai de Tourville BP 13522 44035 Nantes Cedex 1 Rue de la Géraudière 44322 NANTES Cedex 3
Pepsin diffusion in cooked complex food is mainly driven by the dry matter content Abstract:
Digestive enzymes diffusion, particularly pepsin in different food structures is a key factor to control protein-based foods digestion and absorption in the gastro-intestinal tract. The enzymes diffusion is believed to depend on food microstructure and dry matter content. This study aimed to investigate how the microstructure of complex food matrices after routine process (cooking) impacts pepsin diffusion. Four different foods (custard, pudding, sponge cake and biscuit) of identical dry matter ratio (i.e. comparable protein, lipid and sugar contents on dry basis) but different water contents were used as food models. Confocal imaging illustrated a gel-like protein-continuous structure in biscuit, pudding and sponge cake, whereas, a sol structure comprising of protein aggregates, lipid droplets and sugars suspended in a serum pool was observed for custard. FRAP analysis was exploited to calculate pepsin diffusion coefficients within the food matrices and the resulting data proved that an inverse correlation existed between pepsin diffusion and microstructure density.
Results showed that with the decrease in water content a more compact and more homogenous network is observed in food matrices. Pepsin diffusion coefficient estimated by FRAP technique is significantly correlated to the dry matter following a non-linear order which is in line with obstruction-scaling model.
Keywords: Confocal microscopy; Diffusion; FRAP; Solid food; Protein aggregation.
1. Introduction:
Proteins as a valuable source of nutrition for human beings are increasingly studied for their gastrointestinal digestibility. Protein digestibility is a major index of protein quality because not
all of the amino acids which are present in a food can be produced by human bodies for protein synthesis. The first stage of protein digestion is catalyzed by pepsin in the acidic environment of the stomach (Floury et al., 2018) (Luo et al., 2017). Pepsin is an aspartic protease with two aspartic acid residues at the catalytic site; and it prefers to cleave a peptide sequence containing phenylalanine, tyrosine, tryptophan and leucine residues (Luo et al., 2017).
Cross-linking, racemization and heat treatment may decrease protein digestibility and consequently reduce bioavailability of amino acids. For instance, cooking especially when carried out at severe conditions, may decrease the bioavailability of proteins due to formation of disulfide cross linkages and protein aggregation which limits the accessibility of digestive enzymes such as pepsin to proteins (Chapleau et al., 2002) (Duodu et al., 2002).
An existing consensus within the scientific community claims that disintegration of protein-based food particles would be manipulated by their structure (Silva et al., 2013) (Thévenot et al., 2017) (Somaratne el al., [2019]) (Floury et al., 2018). In other words, pepsin diffusion into food matrices and their subsequent breakdown are strongly correlated with the food matrix structure (Thévenot et al., 2017). In spite of several investigations done to make this claim clear, it still remains unknown and not systemically proved. This might be attributed to the lack of available techniques for visualization of the disintegration behavior of dense microstructures of food matrices during gastric digestion by pepsin
However, it is now possible to quantitatively characterize food microstructure and digestive enzymes diffusion process within a given food matrix thanks to the recent advances in confocal laser scanning microscopy (CLSM) and in fluorescent tracers.
Also, Fluorescence recovery after photobleaching (FRAP) has proved to be an efficient technique to follow up pepsin diffusion within solid and liquid model foods (Silva et al., 2013) (Thévenot et al., 2017) (Chapeau et al., 2016).
In some investigations model matrices has been examined while the application of FRAP analysis on real food especially solid matrices remains rarely explored. For instance, Silva et al exploited FRAP analysis to measure the effective diffusion coefficients of macromolecules (from 4 kDa to 2 MDa) in the UF model cheese (Silva et al., 2013). Also, a model matrix based on ultra-filtrated milk was investigated by to measure diffusion properties with FRAP technique.(Lorén et al., 2009) On the other hand, in one particular investigation done by Chapeau et al, FRAP technique was applied for the first time on real cheese, in order to investigate the relationships between molecular diffusion and its microstructure. It is noteworthy that diffusion of fluorescent-labeled dextran with different molecular weights was investigated in b-lactoglobulin solutions and gels over a wide range of salt and protein concentrations at pH 7 by combining confocal laser scanning microscope (CLSM) with FRAP (Balakrishnan et al., 2012).
The current research focuses on gastric proteolysis by the action of pepsin. The objective of this study was to determine how pepsin diffusion within a real food matrix is affected by the microstructure of the matrix. Using FRAP technique, the diffusion coefficient of fluorescently-labeled pepsin was measured in four different types of food particles having only different dry matter compositions and hence different network densities. Four real foods (custard, pudding, sponge cake and biscuit) as lipoprotein matrices were designed to accomplish this task. The real food that we propose as a complex food matrix is based on an animal-plant source of protein accompanied with oil and sugar. Pea and wheat grains, accompanied with egg white as high
nutritional quality foods are considered to be the animal-plant sources of protein. (Saharan, Khetarpaul, 1994) (Yildiz et al., 2018) (Donovan et al., 1975).
It has been reported that a higher water content present a protein matrix can augment protein digestibility because it increases the accessibility of digestive enzymes to proteins (Correia et al., 2011). Nonetheless, pepsin diffusion coefficient as a function of food moisture content within matrices can support or reject this claim. CLSM imaging was applied to investigate the structural design of particles by distinguishing lipids, and proteins, and the auto-fluorescence areas in the structure. Image analysis were performed and qualitatively related to diffusion behavior of fluorescein isothiocyanate (FITC)-pepsin in these model food matrices.
2. Material and methods
2.1 Materials and pepsin labeling
Foods were formulated using wheat flour (Francine T45, Grands Moulins de Paris, Ivry Sur Seine, France), extruded dehulled pea flour (Sativa 32/100, Sotexpro, Bermericourt, France), powdered sugar (Saint-Louis Sucre, Paris, France), sunflower oil (Lesieur, Asnières-sur-Seine, France), standard pasteurized egg yolk and granulated pasteurized egg white powders (Liot, Pleumartin, France) and sterilized water. Fast Green, Nile Red, pepsin from porcine gastric mucosa and FITC were purchased from Sigma-Aldrich (St. Louis, MO, USA). The FITC–pepsin was dissolved in sterile water to a concentration of 50 mg/mL and used to investigate the diffusion rate of a chemically inert molecule within the particles. To validate the protocol, the FITC-pepsin solution was diluted 100 times to obtain diffusion coefficient of pepsin in water at 37°C. All reagents, unless specified in the text, were provided by Sigma and were of analytical grade.
2.2 Preparation and characterization of food matrices
Four different foods with identical dry matter composition were prepared performing whisking, mixing, cooking (180°C (30 minutes) for biscuit, sponge cake and pudding, 110°C (20 minutes) for Custard), and cooling and storage steps. Custard cooking was operated by a kitchen robot Thermomix® TM5 (Vorwerk, Wuppertal, Germany) while biscuit, sponge cake and pudding were cooked using a semi-professional convection oven (De Dietrich, Niederbronn-Les-Bains, France). All foods contained 17% protein, 52% carbohydrate, and 30% lipid on dry basis. Custard was prepared just before experiments. Pudding, sponge cake, and biscuit were stored at -20°C until use and then defrosted at room temperature. Water content was measured for each matrix after cooking using oven dry method by following the method NF-V-04-282 AFNOR, 1985.
2.3. CLSM imaging
CLSM observation was performed using the ZEISS LSM 880 inverted confocal microscope (Carl Zeiss AG, Oberkochen, Germany) set at the magnification 40× (EC Plan-Neofluar objective, Oil, NA=1.30). Solid food matrices (biscuit, sponge cake and pudding) were cut to squares of 5 to 6 mm sides and 1 mm height and then transferred onto glass slides. The dimensions were measured using a digital caliper with accuracy of 1 μm. The protein network and fat components were stained using a 1% (w/v) Fast Green aqueous solution and a 0.1% (w/v) Nile Red 1,2-propanediol solution, respectively (Sigma Aldrich, St Louis, USA). Both fluorescent solutions were first mixed at a ratio 1:1. Then 6 µL of this mix was either deposited on the surface of the slice for solid matrices, or directly added to the custard. The samples were held at 20 °C for at least 30 min to permit the diffusion of the fluorescent dyes into the solid matrices. One drop of the labelled custard was
deposited on a glass slide. A cover slip sealed with several adhesive frames (Geneframe, ABgene House, UK) was then added on the top of the slices, before observation using 405, 488 and 633 nm excitation wavelengths in sequential beam fluorescent mode, for auto-fluorescence, fat and protein detection respectively, at a 1.5 µs pixel dwell scanning rate. Red Nile and Fast Green were detected using a GaasP between 500 and 585 nm and a PMT between 635 and 735 nm, respectively. Autofluorescence was detected using a second PMT between 412 and 483 nm. Micrographs had a resolution of 0.076 µm/pixel and were recorded in the samples at a constant depth of 10 to 15 µm from the glass slide. Images shown in this paper correspond to superimpositions of images of the same area observed separately with the three detectors, with proteins coded in green, fat in red and auto-fluorescence in blue. Aqueous phase and any gas bubbles in the slices may appear as black holes in the micrographs.
2.4. Pepsin labeling
For the FRAP analysis, pepsin was labeled with FITC according to the manufacturer’s instructions as described in a previous study (Thévenot et al., 2017). The pepsin inactivation by the labelling reaction was checked by measuring the FITC-pepsin activity using hemoglobin (Hb) as the substrate according to the method described in (Minekus et al., 2014).
2.5. FRAP analysis
Effective diffusion coefficients (Deff) of fluorescently-labelled pepsin were determined using an
adaptation of the FRAP protocol described by (Floury et al., 2012) and (Thévenot et al., 2017). Food matrices were prepared on individual glass slides as reported before (2.3), and 3 µL of 50 mg/mL FITC-pepsin (40kDa) was added to the surface of the sample. To ensure fluorescent molecules migration from the surface of sample toward its bottom, samples were kept at room
temperature (20°C) for approximately 30 minutes before measurements. For each matrix, three different samples were prepared separately to ensure the reproducibility of sample preparation. The FRAP analysis was performed on the CLSM (Zeiss LSM880, Oberkochen, Germany). All diffusion measurements were performed at 37 °C. The FITC-pepsin was excited using argon laser system at a wavelength of 488 nm and detected on a 495–580 nm spectral bandwidth. The 488 nm argon laser was set to between 0.5 and 5% for imaging and 100% for bleaching step. The pinhole was set to 1 airy unit. Samples were observed at a constant depth of 15 μm from the sample surface using the 40× objective lens (oil immersion) with a numerical aperture of 1.30. The bleached region was a circular region within each image with a radius of 5 μm. A rectangle region was selected as the background.
The bleached region was scanned with 20 pre-bleach images, and then bleached with iterations followed by fluorescence recovery. A total of 480 images were captured during post- bleaching at 0.1 ms intervals until full recovery was reached. Ten FRAP acquisitions were carried out on different locations of each food matrix except the areas which contain lipid droplets and air bubbles. The protein network were preferred both as ROI and background. The coloration of protein network with FG which is explained in section 2.3 allowed to differentiate between different areas. Control FRAP experiments were carried out in the same conditions on water by the FITC-pepsin with a concentration of 0.5 mg/mL according to the method as described by (Silva et al., 2015). Briefly, the fluorescent water (100 μL) was poured between a glass slide and a cover slip sealed with an adhesive frame (Geneframe, ABgene House, UK). Data were analyzed using the analytical method described in (Thévenot et al., 2017) with the assumptions of pure isotropic diffusion in a homogeneous medium and a two-dimensional and Fickian diffusion process. Analyses of the recorded images were performed using FIJI software and the effective diffusion
coefficients (Deff) were obtained by data fitting via nonlinear least squares with RStudio software.
The reduced diffusion coefficient was calculated as the ratio of effective diffusion coefficient for the FITC–pepsin in matrices divided by the diffusion coefficient of the same probe in water. 2.6. Statistical analysis
One-way analysis of variance (ANOVA) and Tukey’s paired comparison test were applied to the diffusion coefficient data of pepsin obtained with the four different matrices and the water control sample, in order to determine which mean values were significantly different from one another at the 95% confidence level. Spearman method is used to examine the significance of variables correlation. The statistical analysis was performed using R software (R 3.1.2. Project for statistical computing).
3. Results and discussion
3.1- Macrostructural assessment
Water content and cooking temperature variation among the samples significantly affected the macrostructure of food matrices (Figure 1).
Matrix Cooking temperature and duration Water content after cooking( gr in
100 gr matrix)
Biscuit 180°C - 18 minutes 5,56 ± 1,59
Sponge cake 180°C - 30 minutes 38,29 ± 3,48
Pudding 180°C - 20 minutes 48,26 ± 1,70
Custard 110°C - 20 minutes 68,44 ± 0,05
Table 1. Cooking time and temperature for different matrices and the results of water content measurements. (Values are means ± SD)
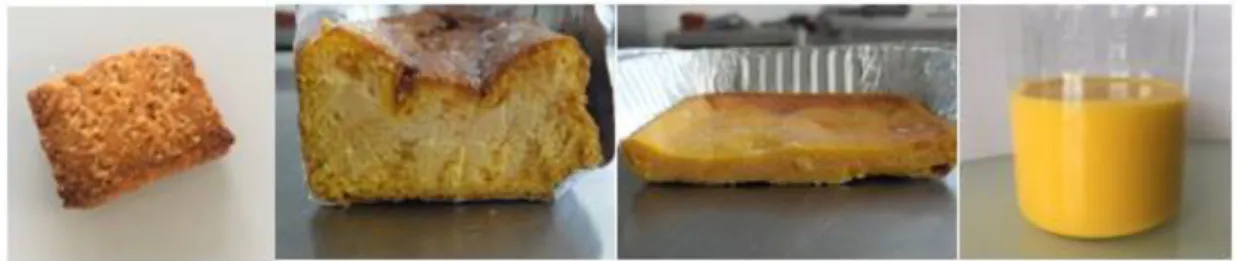
The biscuit which contained lowest water content (5, 56 ± 1, 5) and underwent a high cooking temperature (180°C) had a porous brittle structure. The sponge cake and the pudding which have been submitted to the same heat treatment but had different dry matter contents, looked like a dry porous and a wet porous gels, respectively. The custard which was submitted to the lowest heat treatment and contained the lowest dry matter, can be regarded as a thick liquid. These four complex food models contained three different sources of proteins: egg white, wheat and pea proteins. In biscuit and sponge cake, a gluten network was formed during mixing and disulfide bonds formed between cysteine residues were reinforced during cooking which resulted in a dry solid matrix(Belton, 1999). As a matter of fact, it has been reported that high temperature and low water content in matrix containing wheat flour results in aggregation of disulfide bonds and forming a compact network (Shewry, Tatham, 1997 ; Fischer, 2004). The brown color of biscuit and sponge cake crust was a consequence of non-enzymatic reactions, specifically the Maillard and caramelization reactions, which are absent in the two other matrices. The solid shape of pudding was attributed to the gelation of egg white proteins rather than to the formation of a gluten network. Indeed, the pudding was in a liquid form compared to biscuit and sponge cake which were solid before cooking, the denaturation of egg white proteins and formation of disulfide bonds could make it gel-like (Somaratne et al 2019). In the custard, although the egg white proteins were denatured and disulfide bonds were formed due to cooking temperature (110°C) which is highly above the denaturation temperature of egg white proteins (ovotransferrin, 62°C , Ovalbumin 75°C (Hsieh et al., 1993) , the constant mixing in Thermomix ruptured the structure and it stayed as a thick liquid product.
Figure 1. Macroscopic images of the four model foods: Biscuit, Sponge Cake, Pudding and Custard (from left to right).
3.2 Microscopic observation
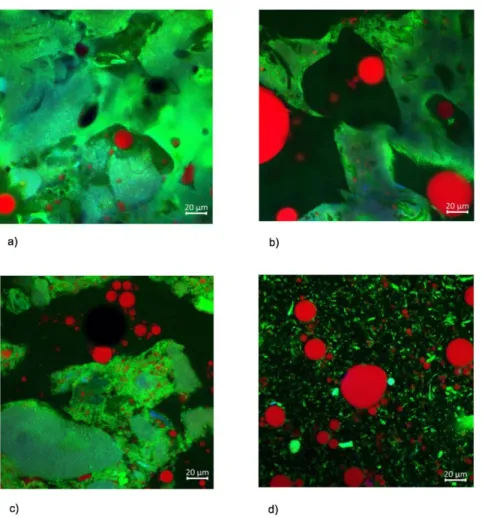
Confocal imaging of the four model foods are illustrated in Figure 2. The protein network represented in green was much more continuous in the microstructure of biscuit, followed by those of sponge cake and pudding compared to the microstructure of custard. This observation indicates that the water content played a remarkable role in the microstructural organization of food matrices. Wheat flour could develop a highly continuous gluten network, resulting in a protein-dominated matrix which embedded oil and sugar. Likewise, egg white proteins were gelled in the sponge cake and the pudding.
Figure 2. Confocal Microscopy Images; (a) biscuit (b) sponge cake (c), pudding, and (d) custard at magnification x40 (lipids appear in red, proteins in green, autofluorescence in blue)
Lipid phase which consisted of sunflower oil and egg yolk is observed as small globular red droplets, surrounded by the protein network. In custard microstructure, rupture of gel-like network during mixing results in small and unconnected protein areas suspended (like colloids) in the aqueous media containing sugar. It is observed that lipid droplets in custard were surrounded by the aqueous phase rather than a protein network. It is known that gluten network is formed at the mixing stage even before cooking (Belton, 1999). Therefore, starch granules and egg white powder were confined within the gluten matrix during mixing. Starch gelatinization and egg white protein denaturation occur between 65 °C and 84 °C depending on various variables for both. These
temperatures are lower than the cooking temperature of all matrices. Hence, it is presumed that lipid droplets and gas cells in solid matrices were captured within the matrix because of early stage formation of the gel-like structure during heating (Donovan et al., 1975)
-Validation of FRAP protocol
FRAP tests were performed to find out pepsin diffusion rates through food matrices at 37°C, which is the physiologically relevant temperature during human digestion. To validate the accuracy of the FRAP protocol performed at 37°C for the first time, the experimental diffusion coefficients of pepsin measured in water was first compared to its corresponding theoretical value.: Assuming that pepsin molecules in aqueous solution have a dynamical behavior similar to random walking particles, the theoretical diffusion coefficient (D) in water can be estimated using the Stokes-Einstein equation:
D = kBT
6πη Rh [Eq.1]
Where kB is the Boltzmann constant, T the absolute temperature (K), η viscosity of the medium
(Pa.s), and Rh the hydrodynamic radius of the molecule (m). Given that at 37°C (310 K), water has
a viscosity of 0.6915 mPa.s and at 20°C (293 K) its viscosity is 1 m Pa.s (Braga et al., 2004), the value of diffusion coefficient of pepsin in water at 37°C should be theoretically 1.53 higher than at 20°C. Somaratne et al (2019) measured the diffusion coefficient of pepsin in water at 20°C using the same FRAP technique and obtained experimental values equal to 104.5±10.7µm²/s. In the present study, we have obtained an experimental diffusion coefficient of pepsin in water equal to 137.55±14.61 µm²/s at 37°C, which is 1.31 times higher than the value previously obtained at 20°C. Experimental and calculated D ratios Dw (37°C)/Dw (20°C) were of the same order of
with the theoretical values and that the FRAP protocol was adapted to measure the diffusion of pepsin at 37°C. This estimation results showed that our results are in line with the theoretical values.
3.3- Effective and reduced diffusion coefficients of model food matrices
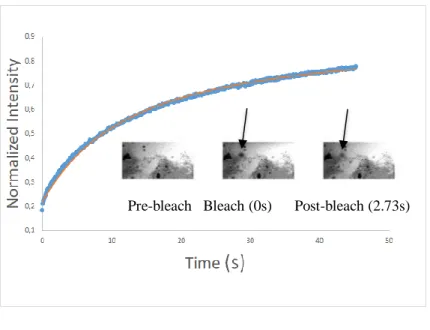
Typical fluorescence recovery curves with the FITC-labeled pepsin solutes in food matrices are presented in Fig. 3. Diffusion profiles along with selected FRAP images before, during, and after photo-bleaching revealed distinct profiles for each matrix (Fig. 3). As it is shown in the images, the protein part (appears in white) is selected as ROI for all the matrices, since the FITC-pepsin is hydrophilic and could not it diffuse inside the lipidic droplets.
Nearly complete fluorescence recovery for all the curves was observed, suggesting isotropic diffusion of fluorescent molecules within the matrices.
(a)
(b)
(c)
Pre-bleach Bleach (0s) Post-bleach (2.73s)
(d
Figure 3. Representative FRAP profiles and images before bleaching and after 0 and 2.73 s (30 th
post-bleaching image) for diffusion of FITC-pepsin in custard (a), FITC-pepsin in pudding (b), FITC-pepsin in sponge cake (c), FITC-pepsin in biscuit (d). Data points (blue color) denote the normalized experimental data and solid lines (red color) denote the data curve fit. The arrow shows the ROI.
The effective diffusion coefficients obtained from the modelling of the experimental data are summarized in Table 2. It has been reported that pepsin is inactivated as a result of a completely irreversible alkaline denaturation in a narrow pH range, between pH 6 and pH 7 which is the labeling condition (Kamatari et al., 2003). Moreover, the pH value of the matrices are definitely higher that the pH required for activity of pepsin (optimal pH around 2 and largely decreasing when the pH increase from 3 to 5 and completely inactivated after pH value equal to 6. (Cornish-Bowden, Knowles, 1969) (Piper, Fenton, 1965) (Kondjoyan et al., 2015). Thus, FITC-pepsin diffusion did not affect the microstructure of the matrices, and the reported values of pepsin diffusion in this study represent the effective diffusivity value within the “native” matrices.
Sample (Dry Matter %)
Effective diffusion coefficient (µm2/s) Reduced diffusion coefficient Water (0%) 137.6 ± 14.6a 1 Custard (26%) 48.5 ± 24. 5b 0.352 Pudding (43%) 15.5 ± 14.0 c 0.112 Sponge cake (51%) 18.4 ± 12. 9 c 0.133 Biscuit (86%) 2.0 ± 2.1 d 0.014
Table 2. Effective diffusion coefficient (Deff) and Reduced diffusion coefficient of FITC-pepsin values in different matrices with reported dry matters values. Values are means ± SD (n=30). Different letters represent statistically significant differences (p<0.05).
In agreement with the fluorescence recovery curves, we observe an increase in diffusion coefficient of FITC-pepsin with augmentation of water content regardless to the cooking condition (Figure 4). However, the large difference between the effective diffusion coefficient in custard and the other three matrices can be attributed to the difference in their microstructure: liquid versus gelled to solid aggregated cooked products. In all these matrices, the Region of Interest (ROI) chosen for the FRAP experiments, has been positioned in an area of the sample containing the proteins, located thanks to the Fast Green fluorescent dye (Figure 2). The results can be interpreted as an estimation of the protein network density in the different matrices which is in agreement with the results of Thévenot et al, which in pepsin diffusion is hindered by increasing the concentration casein in dairy gels as a consequence of aggregation of proteins. Also, it has been shown that the
Pepsin is a small globular molecule with small hydrodynamic radius (add a value and corresponding ref) and its concentration was constant in all matrices. The remarkable difference between pepsin diffusion coefficients in custard (48.5 ± 24.4) and in biscuit (2.0 ± 2.1) can be attributed both to the much higher amount of water available in the custard and also to the different microstructure with the formation of a highly continuous and densely packed protein network in the biscuit compared to the liquid custard. Very high standard deviation of the values were obtained for the effective diffusion coefficient of FITC-pepsin in custard. Indeed, in this product, the kinetics of fluorescence recovery during the FRAP experiments were highly dependent on the location of the ROIs. As mentioned before, despite an aggregation of the egg white proteins could have occurred during the heat treatment, the subsequent mixing step avoided the formation of a gel-like structure but led to a highly heterogeneous liquid suspension. The large variability of the effective diffusion coefficients of FITC-pepsin in custard can therefore be explained by the high heterogeneity of the structure of this product, which contained protein aggregates, lipid droplets and sugars, all suspended within a serum pool (Figure 2D). Indeed, despite an aggregation of the egg white proteins could have occurred during the heating step of the custard, the subsequent mixing step avoided the formation of a gel but led to a highly heterogeneous liquid suspension. No statistical significant difference (p>0.05) is observed between average effective diffusion coefficients of FITC-pepsin in the pudding and sponge cake. In fact it is not so surprising because their dry matter content is of the same order of magnitude (difference less than 10%) and they both showed a similar gel-like protein microstructure (Figure 2B &2C) in which the pepsin diffusion was hindered by the mesh of the network (Thévenot et al., 2017).
The reduced diffusion coefficient values of FITC-pepsin in different matrices is presented in table2. The matrices diffusion coefficients compared to water allow us to highlight their order of
magnitude. For instance, a ten-time reduction is observed for pudding and sponge cake, while for biscuit the value is almost 100 times lower. This can be interpreted as a result of the high aggregation disulfide bonds during cooking with low water content in biscuit. Therefore, the protein hydrolysis by pepsin is hindered by low mass transfer in this matrix.
Figure 5 shows that pepsin effective diffusion coefficient is negatively correlated to the dry matter content of the matrices following an exponential order which can be explained by the obstruction-scaling model proposed by Amsden et al which describes the restricted movement experienced by a solute moving through a homogenous hydrogel. The model is based on the premise that the diffusive process is affected by the physical obstruction (Amsden, 1999). The rank correlation between dry matter and effective diffusion coefficient is estimated by spearman method and the value – 0.79 is obtained.
y = 169e
-0,04x R² = 0,9593 0 20 40 60 80 100 120 140 160 180 0 20 40 60 80 100 Effe ct iv e D iffu si on Co effi ci en t ( µm 2 /s ) Dry Matter (%)Figure 5. Effective diffusion coefficient of FITC-pepsin in matrices with different dry matter. The line represents the exponential trend applied to the experimental data (points).
4. Conclusion
This study is the first report on the microstructural differences of complex food model matrices of same composition but with different water contents, and exposed to different cooking temperatures. Results indicate that liquid form of custard formed a more open and heterogeneous microstructure in comparison to the dense and less heterogeneous structure of the solid matrices (biscuit, pudding, sponge Cake).
This study also showed that pepsin diffusivity within the solid particles is mainly conditioned by the dry matter content of the product. Indeed, it controls the density of the protein network and therefore the amount of solvent phase, trapped in the microstructure and available for the solute diffusion. Thus, the lack of protein network of the custard exhibited significantly a higher rate of FITC-pepsin diffusion than the three other matrices.
In conclusion, these results suggested that pepsin diffusion in complex food matrices can be modulated by the microstructure of the matrix which is in agreement with both experimental results from previous investigations and the theoretical model such as obstruction-scaling model proposed by Amsden. Such knowledge could assist to understand the effect of complex food microstructure on digestion kinetics for desired health outcome. However, in the present work, we have studied the diffusion behavior of inactivated pepsin, due to the labelling with the fluorescent dye and being far from the pH required to activate pepsin. We contributed to better understanding of the digestion process and particularly gastric phase using an engineering approach that requires the physical parameters like the pepsin diffusion coefficients in the food particles.
This Knowledge may be used further to predict the digestion of solid food in general, from protein-based food to more complex food structures. During gastric digestion, pepsin is active and therefore its diffusion through the matrix might be accompanied by the disintegration of the food particles, and thereby might strongly influence the further pepsin mobility. Future research should therefore focus on the effect of pepsin activity on further pepsin diffusion within the food particles microstructures in the course of digestion.
References;
AMSDEN, Brian, 1999. An Obstruction-Scaling Model for Diffusion in Homogeneous Hydrogels. In : Macromolecules. février 1999. Vol. 32, n° 3, p. 874‑879.
DOI 10.1021/ma980922a.
ANON., [sans date]. Somaratne-paper1.pdf. S.l. : s.n.
BALAKRISHNAN, Gireeshkumar, NICOLAI, Taco et DURAND, Dominique, 2012. Relation between the gel structure and the mobility of tracers in globular protein gels. In : Journal of Colloid and Interface Science. décembre 2012. Vol. 388, n° 1, p. 293‑ 299. DOI 10.1016/j.jcis.2012.08.032.
BELTON, P.S., 1999. Mini Review: On the Elasticity of Wheat Gluten. In : Journal of
Cereal Science. mars 1999. Vol. 29, n° 2, p. 103‑107. DOI 10.1006/jcrs.1998.0227.
BRAGA, José, DESTERRO, Joana M.P. et CARMO-FONSECA, Maria, 2004. Intracellular Macromolecular Mobility Measured by Fluorescence Recovery after Photobleaching with Confocal Laser Scanning Microscopes. In : Molecular Biology of
the Cell. octobre 2004. Vol. 15, n° 10, p. 4749‑4760. DOI 10.1091/mbc.e04-06-0496.
CHAPEAU, A.L., SILVA, Juliana V.C., SCHUCK, Pierre, THIERRY, Anne et FLOURY, Juliane, 2016. The influence of cheese composition and microstructure on the diffusion of macromolecules: A study using Fluorescence Recovery After Photobleaching
(FRAP). In : Food Chemistry. février 2016. Vol. 192, p. 660‑667. DOI 10.1016/j.foodchem.2015.07.053.
CHAPLEAU, N., DELÉPINE, S. et DE LAMBALLERIE-ANTON, M., 2002. Effect of pressure treatment on hydrophobicity and SH groups interactions of myofibrillar proteins. In : HAYASHI, Rikimaru (éd.), Progress in Biotechnology [en ligne]. S.l. :
Elsevier. Trends in High Pressure Bioscience and Biotechnology. p. 55‑62. [Consulté le 26 janvier 2019]. Disponible à l’adresse :
http://www.sciencedirect.com/science/article/pii/S092104230280079X.
CORNISH-BOWDEN, A. J. et KNOWLES, J. R., 1969. The pH-dependence of pepsin-catalysed reactions. In : Biochemical Journal. juin 1969. Vol. 113, n° 2, p. 353‑362. DOI 10.1042/bj1130353.
DONOVAN, John W., MAPES, Carol J., DAVIS, John Gorton et GARIBALDI, John A., 1975. A differential scanning calorimetric study of the stability of egg white to heat denaturation. In : Journal of the Science of Food and Agriculture. 1 janvier 1975. Vol. 26, n° 1, p. 73‑83. DOI 10.1002/jsfa.2740260109.
DUODU, K. G., NUNES, A., DELGADILLO, I., PARKER, M. L., MILLS, E. N. C., BELTON, P. S. et TAYLOR, J. R. N., 2002. Effect of Grain Structure and Cooking on Sorghum and Maize in vitro Protein Digestibility. In : Journal of Cereal Science. 1 février 2002. Vol. 35, n° 2, p. 161‑174. DOI 10.1006/jcrs.2001.0411.
FISCHER, Thomas, 2004. Effect of extrusion cooking on protein modification in wheat flour. In : European Food Research and Technology. 1 janvier 2004. Vol. 218, n° 2, p. 128‑132. DOI 10.1007/s00217-003-0810-4.
FLOURY, J., MADEC, M.-N., WAHARTE, F., JEANSON, S. et LORTAL, S., 2012. First assessment of diffusion coefficients in model cheese by fluorescence recovery after photobleaching (FRAP). In : Food Chemistry. juillet 2012. Vol. 133, n° 2, p. 551‑556. DOI 10.1016/j.foodchem.2012.01.030.
FLOURY, Juliane, BIANCHI, Tiago, THÉVENOT, Jonathan, DUPONT, Didier, JAMME, Frédéric, LUTTON, Evelyne, PANOUILLÉ, Maud, BOUÉ, François et LE FEUNTEUN, Steven, 2018. Exploring the breakdown of dairy protein gels during in vitro gastric digestion using time-lapse synchrotron deep-UV fluorescence microscopy. In : Food
Chemistry. janvier 2018. Vol. 239, p. 898‑910. DOI 10.1016/j.foodchem.2017.07.023.
HSIEH, Yin Liang, REGENSTEIN, Joe M. et RAO, M. Anandha, 1993. Gel Point of Whey and Egg Proteins Using Dynamic Rheological Data. In : Journal of Food Science. janvier 1993. Vol. 58, n° 1, p. 116‑119. DOI 10.1111/j.1365-2621.1993.tb03223.x. KAMATARI, Yuji O., DOBSON, Christopher M. et KONNO, Takashi, 2003. Structural dissection of alkaline-denatured pepsin. In : Protein Science : A Publication of the
Protein Society. avril 2003. Vol. 12, n° 4, p. 717‑724.
KONDJOYAN, Alain, DAUDIN, Jean-Dominique et SANTÉ-LHOUTELLIER, Véronique, 2015. Modelling of pepsin digestibility of myofibrillar proteins and of variations due to heating. In : Food Chemistry. avril 2015. Vol. 172, p. 265‑271.
LORÉN, Niklas, NYDÉN, Magnus et HERMANSSON, Anne-Marie, 2009. Determination of local diffusion properties in heterogeneous biomaterials. In : Advances in Colloid and
Interface Science. août 2009. Vol. 150, n° 1, p. 5‑15. DOI 10.1016/j.cis.2009.05.004.
LUO, Qi, BORST, Jan Willem, WESTPHAL, Adrie H., BOOM, Remko M. et JANSSEN, Anja E.M., 2017. Pepsin diffusivity in whey protein gels and its effect on gastric
digestion. In : Food Hydrocolloids. mai 2017. Vol. 66, p. 318‑325. DOI 10.1016/j.foodhyd.2016.11.046.
MINEKUS, M., ALMINGER, M., ALVITO, P., BALLANCE, S., BOHN, T., BOURLIEU, C., CARRIÈRE, F., BOUTROU, R., CORREDIG, M., DUPONT, D., DUFOUR, C., EGGER, L., GOLDING, M., KARAKAYA, S., KIRKHUS, B., FEUNTEUN, S. Le, LESMES, U., MACIERZANKA, A., MACKIE, A., MARZE, S., MCCLEMENTS, D. J., MÉNARD, O., RECIO, I., SANTOS, C. N., SINGH, R. P., VEGARUD, G. E., WICKHAM, M. S. J., WEITSCHIES, W. et BRODKORB, A., 2014. A standardised static in vitro digestion method suitable for food – an international consensus. In : Food & Function. 28 mai 2014. Vol. 5, n° 6, p. 1113‑1124. DOI 10.1039/C3FO60702J.
PIPER, D W et FENTON, B H, 1965. pH stability and activity curves of pepsin with special reference to their clinical importance. In : Gut. 1 octobre 1965. Vol. 6, n° 5, p. 506‑508. DOI 10.1136/gut.6.5.506.
SAHARAN, K. et KHETARPAUL, N., 1994. Protein quality traits of vegetable and field peas: Varietal differences. In : Plant Foods for Human Nutrition. janvier 1994. Vol. 45, n° 1, p. 11‑22. DOI 10.1007/BF01091225.
SHEWRY, P.R. et TATHAM, A.S., 1997. Disulphide Bonds in Wheat Gluten Proteins. In : Journal of Cereal Science. mai 1997. Vol. 25, n° 3, p. 207‑227.
DOI 10.1006/jcrs.1996.0100.
SILVA, Juliana V.C., LEGLAND, David, CAUTY, Chantal, KOLOTUEV, Irina et
FLOURY, Juliane, 2015. Characterization of the microstructure of dairy systems using automated image analysis. In : Food Hydrocolloids. février 2015. Vol. 44, p. 360‑371. DOI 10.1016/j.foodhyd.2014.09.028.
SILVA, J.V.C., PEIXOTO, P.D.S., LORTAL, S. et FLOURY, J., 2013. Transport phenomena in a model cheese: The influence of the charge and shape of solutes on diffusion. In : Journal of Dairy Science. octobre 2013. Vol. 96, n° 10, p. 6186‑6198. DOI 10.3168/jds.2013-6552.
THÉVENOT, J., CAUTY, C., LEGLAND, D., DUPONT, D. et FLOURY, J., 2017. Pepsin diffusion in dairy gels depends on casein concentration and microstructure. In : Food
Chemistry. mai 2017. Vol. 223, p. 54‑61. DOI 10.1016/j.foodchem.2016.12.014.
YILDIZ, Eda, GUNER, Selen, SUMNU, Gulum, SAHIN, Serpil et OZTOP, Mecit Halil, 2018. Monitoring the Effects of Ingredients and Baking Methods on Quality of
Gluten-Free Cakes by Time-Domain (TD) NMR Relaxometry. In : Food and Bioprocess
Technology. octobre 2018. Vol. 11, n° 10, p. 1923‑1933. DOI