Analysis of Global Channel Costs for the Pharmaceutical
Industry
by Eric C. Rimling
Bachelor of Science in Chemical Engineering Texas A&M University, 2003
and
Wontae Thomas Seoh
Bachelor of Science in Industrial Engineering Northwestern University, 2003
Submitted to the Engineering Systems Division in Partial Fulfillment of the Requirements for the Degree of
Master of Engineering in Logistics
at theMassachusetts Institute of Technology
June 2009© 2009 Eric C. Rimling and Wontae Thomas Seoh All rights reserved.
ARCHIVES
The author hereby grants to MIT permission to reproduce and to distribute publicly paper and electronic copies of this document in whole or in part.
Signature of Authors...
Master of Engineering in Logistics Program, Engineering Systems Division
- A a May 8, 2009 Certified by... Accepted by... Il ! ... ... . ... .. .. . .. o .. . o... Dr. Mahender Singh Research Director, SC2020 & MEHD Thesis Supervisor Prof. Yossi Sheffi Professor, Engineering Systems Division Professor, Civil and Environmental Engineering Department Director, Center for Transportation and Logistics Director, Engineering Systems Division
MASSACHUSETTS INSTITUTE OF TECHNOLOGY
JUN 3 0 2009
LIBRARIES
Analysis of Global Channel Costs for the Pharmaceutical
Industry
by
Eric C. Rimling and Wontae Thomas Seoh Submitted to the Engineering Systems Division in partial fulfillment of the requirements for the degree of
Master of Engineering in Logistics
Abstract
The pharmaceutical industry creates products which often have more than one supply chain channel, defined as a route through the supply chain network from sourcing to the end market. Each channel's specific cost characteristics are important to the pharmaceutical industry's ability to maintain positive profit margins while meeting high customer service requirements. Determining the optimal supply chain channel involves the analysis of fuel costs, logistics, taxes, wage differences, and many more. Additionally, variables such as time and risk significantly impact the total cost of a supply chain channel, but are extremely difficult to quantify.
In this research, we identify the relevant channel costs and variables for the supply chain of a large pharmaceutical corporation. After identification, our study categorizes each cost based on level of measurability and causes of variability to develop a framework identifying the most relevant costs by four product types. We then analyze market forces that affect costs over a product's lifecycle. Finally, we develop an operational model for using the framework to compare costs across multiple supply chain channels and time horizons.
Thesis Supervisor: Dr. Mahender Singh Title: Research Director, SC2020 & MEHD
Acknowledgements
First and foremost, we would like to thank our thesis advisor Dr. Mahender Singh for providing guidance and support throughout this process. We could not have reached the finish line without your insights and constant push for innovative thinking. Our
appreciation also goes to Shardul Phadnis, for sacrificing his time to help us critically evaluate our work. A warm debt of gratitude goes to Bill Haas for his critique and keen attention to the elements of style. And thanks to the MLOG faculty Dr. Chris Caplice, Dr. Jared Goentzel and Dr. Jonathan Byrnes for your support throughout the year. We would also like to thank our sponsor in the pharmaceutical industry Anthony B. for providing the topic and motivation to conduct this research. Thank you to John M., John
K., David R., Helen, Lisa, David K., Phil, Philippe, Rachel, Gulden, Mark, James, and Vijay for making the time to discuss their unique perspectives of the pharmaceutical
industry.
Eric C. Rimling:
I would like to thank my family, my parents Greg and Marilyn and my brother Todd, for providing support and advice through all the plans I've made and the places I've gone. I would also like to thank my friends for believing in me and encouraging me with their messages all year. Finally, I'd like to thank God for this incredible experience and making all of it possible.
Wontae Thomas Seoh:
First, I would like to thank my beautiful wife Hyungi Woo for her optimism, love and understanding throughout this academic year. I would also like to show my gratitude to my parents Bong Kyu and Jeong Hee Seoh and siblings Eugene, Marianne, and Daniel for unending believe in me. Finally, I would like to thank God for giving me the purpose and faith to achieve my goals.
Table of Contents
Abstract ... 2 Acknowledgements ... 3 List of Figures ... ... 7 List of Tables ... 8 1 Introduction... 9 1.1 Project Background ... ... 101.2 Development of a Cost Framework ... ... 11
1.3 Research Roadmap ... ... 12
2 Pharmaceutical Industry Overview... 14
2.1 M arket Structure and Dynamics... .. ... ... 14
2.2 R&D and Drug Introduction ... 16
2.3 Drug Lifecycle... ... 19
2 .4 R isk s ... 2 1 2.4.1 Risk of Growth Attainment... 21
2.4.2 Risk of Increasing Complexity ... ... 22
2.4.3 Risk of Technology Investment ... ... 22
2.4.4 Risk of High Attrition ... 23
2.4.5 Risk of Blockbuster Reliance... 24
2.4.6 Risk of Market Timing ... 25
2.4.7 Risk of Product Differentiation... 25
2.4.8 Risk of Regulative Force ... ... ... 26
2.5 Impact on Supply Chain Costs ... 26
3 Literature Review.. ... 28
3.1 Cost Allocation... 28
3.2 Landed Cost Models... . 29
3.3 Relevant Models and Frameworks ... ... 31
3.3.2 Qualitative Frameworks ... ... ... 32
3.4 Our Contribution ... ... 34
4 Data Collection and Analysis... 36
4.1 Interview Process ... ... 36 4.1.1 Format of Interviews ... 37 4.1.2 Finance ... ... 37 4.1.3 Sourcing Strategy ... 38 4.1.4 Distribution Hubs ... 39 4.1.5 Transportation/Logistics ... ... 40 4.2 Cost Identification ... ... 42 4.3 Categorization ... ... 44
4.3.1 Hard and Soft Costs ... 45
4.3.2 Variability Drivers ... 46
4.3.3 Categorization Profiles... 47
5 Results and Insights ... ... 52
5.1 Product Type M atrix ... 52
5.1.1 Blockbuster Products ... 54
5.1.2 Specialist Products ... 56
5.1.3 Commodity Products ... 57
5.1.4 Underperforming Products... 59
5.2 Introduction to Forces ... 60
5.2.1 Forces that Impact Pricing Power ... ... 61
5.2.2 Forces that Impact Demand ... ... 64
5.3 Channel Cost Operational Model... ... ... 67
5.3.1 Quantifying Hard Costs ... ... ... 69
5.3.2 Quantifying Soft Costs... 69
6.1 Sensitivity Analysis Using Simulation Techniques ... . 72
6.2 Net Present Value Analysis... 73
7 C onclusion ... 75
References ... 77
Appendix A: The Balanced Scorecard... 79
Appendix B: Import Landed Costs ... 80
Appendix C: Export Landed Costs ... 81
Appendix D: GE-McKinsey 9-Box Matrix... 82
Appendix E: List of Costs by Product Type ... ... 83
Appendix F: List of Costs by Channel and Product Attributes ... 84
Appendix G: Finance Interview Notes ... ... 85
Appendix H: Sourcing Strategy Interview Notes ... ... 87
Appendix I: Distribution Hubs Interview Notes ... 88
Figure 2.1: Figure 2.2: Figure 2.3: Figure 2.4: Figure 2.5: Figure 3.1: Figure 3.2: Figure 3.3: Figure 3.4: Figure 5.1: Figure 5.2: Figure 5.3: Figure 5.4: Figure 5.5: Figure 5.6: Figure 5.7: Figure 5.8: Figure 6.1:
List of Figures
R&D and Drug Introduction... 16
Drug Development Timeline... 18
Effective Patent Protection 1960 - 1990 ... ... 20
A Pharmaceutical Product's Lifecycle ... ... 20
Attrition Rate in Pharmaceutical R&D by Phase ... 24
Total Cost Equation... 31
Safety Stock Equation ... 32
BCG Growth/Share Matrix ... ... 33
Porter Value Chain Framework... 34
Product Type M atrix ... 53
Product Type Matrix with Market Forces ... ... 60
Pricing Pressure Force ... 61
Barriers to Entry Force ... 62
M arket Pressure Force ... ... 65
M arket Growth Force ... 66
Channel Cost Operational Model ... ... 67
Holding Cost Equation ... 70
List of Tables
Table 2.1: Market Positions of the Top Pharmaceutical Companies... 15
Table 2.2: R & D Process ... ... 17
Table 2.3: Average Cost Structure of Newly Developed Drug ... 22
Table 3.1: Quantifying the Impact of Risk ... ... 30
Table 4.1: Identified Costs ... ... ... 43
Table 4.2: List of Strategic Drivers... 44
Table 4.3: Categorization of Costs Based on Measurability... ... 46
Table 4.4: Categorization of Costs Based on Variability Drivers ... 47
Table 4.5: Channel Attribute Costs Profile Table... ... 48
Table 4.6: Volume Based Costs Profile Table... ... 49
Table 4.7: Value Based Costs Profile Table ... ... 50
Table 4.8: Product Attribute Costs Profile Table... ... 51
Table 5.1: Blockbuster Relevant Costs... ... 54
Table 5.2: Specialist Relevant Costs... 56
Table 5.3: Commodity Relevant Costs ... 57
Table 5.4: Underperformer Relevant Costs ... ... 59
Table 5.5: List of Channel Attrittibute Costs ... . 68
Table 5.6: List of Product Attribute Costs ... 68
Table 5.7: Demonstrative Table of Hard Costs for a Blockbuster Product ... 69
Table 5.8: Quantifying the Impact of Risk ... ... 71
1 Introduction
The pharmaceutical industry creates products which often have more than one supply chain channel, defined as a route through the supply chain network from sourcing to the end market. It is important to note that there are different types of players in the
pharmaceutical industry ranging from companies that are primarily focused on bringing new drugs to the market by investing heavily on R&D, to companies that manufacture
only generics with limited or no investment in R&D. In this research we will refer to the companies that have significant investment in R&D as pharmaceutical companies. The results, however, can be adapted to study any type of pharmaceutical company.
Each channel's specific cost characteristics are important to the pharmaceutical industry's ability to maintain positive profit margins while meeting high customer service requirements. Channel selection can be difficult due to dynamic factors, such as risk of counterfeiting or supply disruptions triggered by political instability, which are not always easy to quantify. Our research offers a solution to this problem by developing a framework to identify relevant channel costs and a process to quantitatively evaluate these costs.
The structure of the pharmaceutical industry adds a further layer of complication to channel strategy for branded pharmaceuticals. It takes many years and millions of dollars to develop a new drug but there is only a short time under which the drug receives patent protection. Pharmaceutical companies must use this short time to recoup their costs before the patent expires and they are faced with intense competition from generic competitors selling the same drug formula at a much lower price point.
In spite of the challenges, pharmaceutical companies have used certain channels to deliver drugs because of the assumed cost advantages. For instance, the Asian supply channel is one of the most economical due to low labor wages and production costs in the region. The cost savings from these operational areas outweighed the logistics costs to ship from this region to others around the world.
1.1 Project Background
Due to recent fluctuations in fuel prices, the pharmaceutical industry began to challenge the assumption that operational savings outweighed logistics costs in Asia. For instance, did supplying the U.S. market from Central America now make more sense than shipping from Asia due to the lower logistics costs? Our sponsor pharmaceutical company wanted to understand how to incorporate cost fluctuations when making supply chain decisions.
They also wanted to find out how costs changed during a drug's lifecycle as it moves from patented to generic and how these changes should be incorporated into channel decisions.
We saw that the bigger problem was not just about fluctuating fuel prices or changes during a drug's lifecycle, but how to deal with various supply chain channel costs in general. Our solution was to develop a framework to capture relevant costs and identify market forces that impact these costs through underlying variability drivers. In our research, we define a variability driver as the primary cause of cost fluctuations. By simplifying the problem, we could understand the changing cost dynamics to better inform supply channel decisions.
1.2 Development of a Cost Framework
The first step to develop a cost framework was to isolate the costs that had the most impact on the supply chain. We began with research into the pharmaceutical industry to understand the unique aspects of the business and increase our knowledge of how the
industry works. Once we gained a better understanding of the industry, we conducted interviews with representatives throughout our sponsor pharmaceutical company to gather information and costs they felt were relevant to their functional group. Through these interviews and additional research into landed costs, we generated a list of 30 costs that we felt represented the most significant factors affecting the pharmaceutical supply chain.
Once we had the basic list of costs, we needed to incorporate into our framework an understanding of which costs change, why they change, and what forces were causing these changes. By looking at trends and patterns within the costs as well as further research, we identified common variability drivers that changed within the different channels. The variability drivers included channel specific features, volume changes, value changes, and product attribute differences. Variability drivers explained what was changing our costs, but we next had to figure out why they were changing.
By laying the costs on a matrix according to their volume and value variability drivers, we discovered four market forces that had an impact on costs and explained why they were changing. These four market forces were Pricing Pressure, Barriers to Entry, Market Pressure, and Market Growth. This discovery was influenced by Michael Porter's research and his concepts helped clarify why the forces were present and what their impact was on the variability drivers.
The last part of our project was to transform our research into a simple decision making process to compare two channels based on their costs and arrive at the optimal solution for a specific product, even if it changed over time. We had already
deconstructed a complicated problem down to the relevant costs that spanned
organizational divisions, but we needed a process to analyze the cost components. The solution we developed is a three-step method to compare channel costs through
quantifiable values. The method is easy to understand and arrives at one final number per channel that can be compared. Pending more detailed cost data, two other considerations can be added that make the analysis even more complete.
1.3 Research Roadmap
Our thesis is divided into sections that address the research areas already mentioned. Chapter 2 lays out the fundamental structure and dynamics of the pharmaceutical industry as well as the inherent risks a company is exposed to. Chapter 3 discusses previous research involving the identification of costs in a global supply chain and frameworks that can be used to analyze these costs. Chapter 4 reviews the information gained through our interviews and identifies the relevant costs in a pharmaceutical supply channel. This section also categorizes the costs based on Hard costs (which are easier to quantify) and Soft costs (which are harder to quantify but that impact decision-making), as well as the variability drivers for each cost.
Chapter 5 introduces the Product Type Matrix as a simple way to think about product categories. We explore the features, relevant costs, and business strategy for each product category before discussing the forces that act on the product categories. The conclusion of Chapter 5 develops the process for using our Product Type Matrix and
cost categorizations to make supply channel decisions. Chapter 6 expands upon this process with a sensitivity analysis and net present value equation that can make the process more complete if detailed cost data is available. Our Conclusion wraps up our findings and expands on the concepts discovered through this research in Chapter 7.
2 Pharmaceutical Industry Overview
The pharmaceutical industry is unique for a variety of reasons, from the complexity of the products to the regulations that govern every aspect of the business (Singh 2005). These constraints and market dynamics shape the way pharmaceutical companies do business and create a challenging environment for new competitors to enter. Although
our research is specifically focused on analyzing channel costs of pharmaceutical supply chains, knowledge of the overall industry was crucial to understand the underlying forces that drive supply chain decisions. To gain this understanding, we took a closer look at a number of areas that make the industry unique.
2.1 Market Structure and Dynamics
The market structure of the pharmaceutical industry is a complex combination of large, multi-national corporations driven by incredible research and development budgets, and many smaller companies developing niche drugs or generics. The difference between these categories is vast and there are significant barriers to entry - such as economies of scale - to move from a niche provider to a large pharmaceutical provider. The
powerhouse pharmaceuticals are characterized by a global spread and have R&D programs that run into the billions of dollars per year (PhRMA 2009). In 2008, an estimated $65 billion was spent on R&D in the pharmaceutical industry (ibid.).
The industry is also characterized with a high level of instability caused by competition. Table 2.1 shows how the position of the top pharmaceutical companies changed between 1982 and 2000.
Glaxo Wellcome 18 2 1 2
Merck 3 1 2 1
Hoechst Marion Roussel 1 5 3 5 Bristol-Meyers Squibb 10 3 4 8
Roche 8 16 5 6
Pfizer 6 15 6 3
American Home Products 4 10 7 7
Lilly 7 9 8 4
Pharmacia Upjohn 16 21 9 12
SmithKline Beecham 11 8 10 9
Source: Key Issues in the Pharmaceutical Industry (1999)
Table 2.1: Market Positions of the Top Pharmaceutical Companies
Innovation is vital in the pharmaceutical industry and the market offers rich rewards to players that are first to introduce a product in a particular therapeutic category. Sometimes one or two strong product launches can significantly boost a pharmaceutical company's sales and lead them to the top of the charts for an extended period of time (e.g. Lipitor and Viagra in the case of Pfizer).
The relationship between demand and pricing in the pharmaceutical industry is an interesting dynamic since it is very inelastic for branded drugs. In other words, a price increase does not cause more customers to leave the market, and a price decrease does not attract more customers to it (McIntyre 1999). For prescription drugs, the patient often does not know what drug they need or the dose they need it in and must rely on a doctor to make the right recommendation for them. In these cases, the price has almost no effect on whether the patient uses the drug since it is usually a necessity.
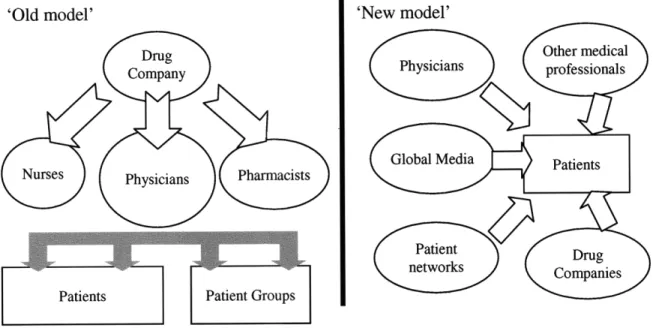
Pharmaceutical companies also face the problem of fixed demand. Since more people will not become afflicted with a disease through a marketing campaign, the best method for demand generation is to educate people on the symptoms of a disease they are trying to treat. This method works well to drive demand through doctors (so they
prescribe the drug) and as well as patients (so they request the drug). Figure 2.1 shows a change in the marketing model, towards a more direct to patient approach.
'Old model' 'New model'
Drug Other medical
Company Physicians professionals
Nurses Physicians PharmacistsGlobal Media Patients
Patient
Patients Patient Groups
Source: A Healthy Business: A Guide to the Global Pharmaceutical Industry (2001)
Figure 2.1: R&D and Drug Introduction
2.2
R&D and Drug Introduction
Research and development is the foundation of the pharmaceutical industry and is required to bring innovative treatments to market and to remain a competitive player in
the business. In large pharmaceutical companies, R&D consumes between 15% to 18% of sales (Greener 2001). This has resulted in cures and treatments that have helped millions of people live better lives, increasing overall social welfare and productivity.
Unfortunately, innovative drug discoveries do not come easily and many barriers must be overcome to launch a new commercial drug. Three of the biggest barriers are the low probability of success, long time between discovery and commercializing a product, and high upfront costs associated with the process (McIntyre 1999).
The first barrier is the low probability during the R&D process that a chemical compound will lead to a profitable commercial drug. McIntyre reports on the
development numbers:
For every 10,000 drug candidates synthesized at the discovery phase, 1,000 will enter preclinical testing and only 10 will enter clinical testing. Out of those 10, only 1 will eventually become a new introduction (McIntyre 1999).
As a result, much of the money invested in R&D leads to abandoned drugs that will never regain their investment. Table 2.2 describes the R&D process in more detail.
R&DIhas Dei
Random screening: approximately 10,000 chemical compounds are
tested for therapeutic activity.
Rational drug screening: between 500 and 1,000 chemical
compounds are synthesized and tested for therapeutic activity.
Pharmacological activity and toxicity determined for lead compounds and a patent dossier and Investigational New Drug application is submitted to appropriate authorities.
Phase I: 50-100 healthy volunteers are tested for absorption,
metabolism, distribution, etc. (if drugs are expected to be toxic, such as cancer, studies may enroll terminally ill patients)
Phase II: 200-400 patients tested for efficacy and toxicity.
Phase III: larger randomized trials conducted on patients to determine
efficacy and any adverse drug reactions.
Application for New Drug Application: all raw data from preclinical,
clinical, and animal testing submitted to authorities for marketing approval.
Phase IV: post-marketing surveillance to collect data on any further
side-effects and more generally to improve knowledge of the product.
Source: Key Issues in the Pharmaceutical Industry (1999)
Table 2.2: R&D Process Discovery (preclinical) Development (clinical) --I
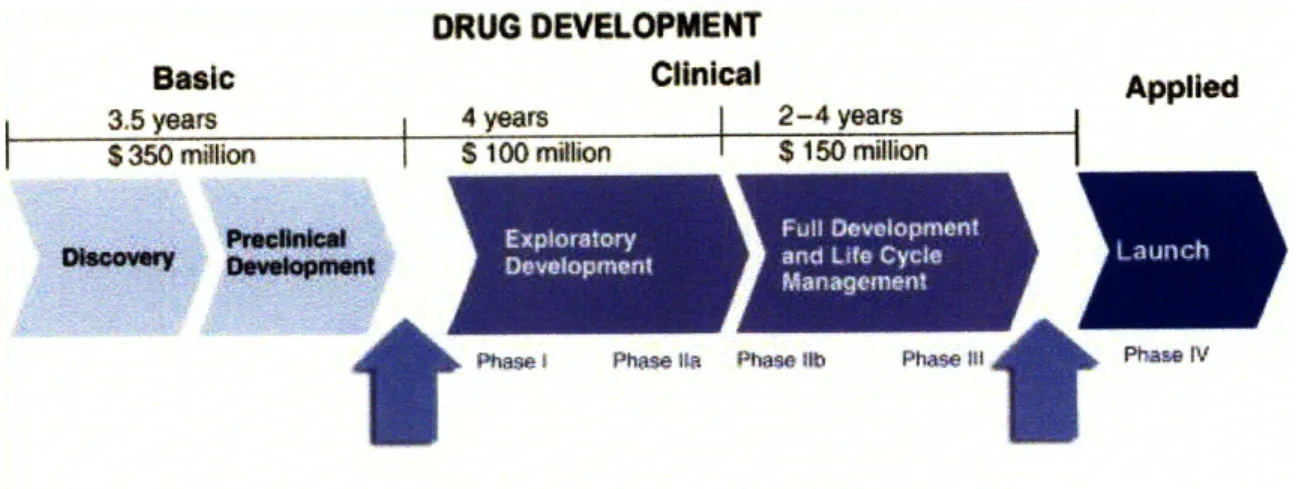
Another characteristic is the time consuming nature of R&D due to the number of trials and regulations a new drug must clear. Current estimates of the pharmaceutical R&D process suggest that the time from discovery to marketing is on average 12 years (DiMasi et al 1995). Figure 2.2 provides a breakdown of where the time and cost is allocated during the drug development process.
DRUG DEVELOPMENT
Basic Clinical Applied
3.5 years 4 years 2-4 years
S350 million $ 100 million $ 150 million
3
t
Phase . Phase I1 Ptwe. ib Phase III Pha IVSource: Differences in Drug Development (2008)
Figure 2.2: Drug Development Timeline
Even though the odds are heavily stacked against new drug discoveries and the process is extremely capital intensive, R&D has the potential to generate huge profits. In the pharmaceutical industry, a highly profitable drug is called a blockbuster. A
blockbuster is usually defined as a drug that achieves sales of more than $1 billion
annually (Greener 2001). Blockbusters are important to the pharmaceutical industry for a variety of reasons: they fill a large consumer need for a product, they fund further R&D operations for the next blockbuster, and they help with company growth and the
fulfillment of shareholder expectations (ibid.).
The significance of all this is that once a drug is approved, the full power of the operational side of the business must be aligned to immediately and efficiently take
P"
Exploratory full Devvioplivot
anti LJ4 Cycle
advantage of the new drug's earning potential. As we discuss in the next section, the period of time a drug is under patent is extremely valuable.
2.3 Drug Lifecycle
The pharmaceutical companies must deal with products they have spent hundreds of millions of dollars to develop, have taken years to bring to market, and have complex manufacturing requirements. Yet once these challenges have been surmounted,
companies have only a few years in which they can hold near monopoly power over the patented product. Despite this idiosyncratic nature of the industry, pharmaceuticals rank at the top of the industrial sectors of the Fortune Global 500 with a return on assets of 14.7% (Greener 2001). This swing from an extremely unprofitable R&D phase to an extremely profitable patented phase is a characteristic that makes the pharmaceutical industry unique compared to most industries.
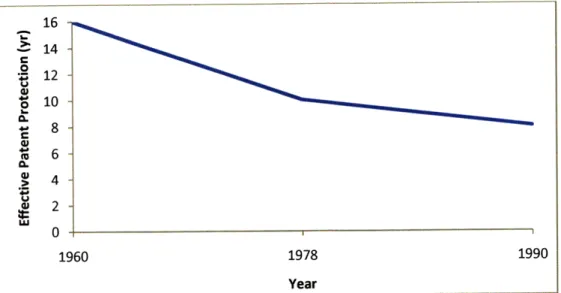
During the patented phase of a drug's lifecycle, the cost of R&D must be recouped as well as a sufficient profit is captured to fund further R&D for the next innovative drug. A patent application tends to be submitted at the discovery stage of the R&D process, approximately 10-12 years before a successful product might reach the market (McIntyre 1999). Patents last for 20 years in the U.S. but since the patent is filed so far in advance of commercialization, the longer the clinical trial phase, the shorter patent protection time the pharmaceutical company has to sell the drug at a premium. Figure 2.3 shows that as the R&D time of more recent drugs has lengthened (due to complexity and increasing government regulations), the effective patent protection on drugs has been falling.
16 14 t 12 S108 8 6 0. 1960 1978 1990 Year
Source: Keys Issues in the Pharmaceutical Industry (1999)
Figure 2.3: Effective Patent Protection 1960 - 1990
The lifecycle of pharmaceutical drugs has been researched and a well-established pattern has been developed. Figure 2.4 shows the lifecycle of a pharmaceutical from the beginning of R&D through the introduction of generic competition.
Sales New R&D Years 0 10 Out of patent 20 30
Source: A Healthy Business: Guide to the Global Pharmaceutical Industry (2001)
Figure 2.4: A Pharmaceutical Product's Lifecycle
Analyzing the lifecycle curve, it is apparent that companies should try to ramp up to mature sales volume as soon as possible and for as long as possible before competition
enters the market. To accomplish this, there have been two different approaches to lifecycle management over the years. Originally, companies would roll out their
international launches over several months and growing sales in one market would help fund the launch in the next market (Greener 2001). While this was a safer approach, it took longer for drugs to reach their mature potential. The newer approach is to launch a product in several countries at once to ramp up sales as quickly as possible (ibid.).
2.4 Risks
Due to the long timeframe and serious upfront costs of the R&D structure,
pharmaceutical companies face risk from a multitude of different areas. The eight primary risks in the pharmaceutical industry are as follows (Reepmeyer 2006):
1. Risk of growth attainment 2. Risk of increasing complexity
3. Risk of technology investment 4. Risk of high attrition
5. Risk of blockbuster reliance 6. Risk of market timing
7. Risk of product differentiation 8. Risk of regulative force
2.4.1 Risk of Growth Attainment
Pharmaceuticals have been one of the fastest growing markets over the last 40 years. From 1970 to 2008, the average annual growth rate of sales has been 10.4% (PhRMA 2009). This high and sustained growth rate has led to increasing shareholder expectations
of what the pharmaceutical industry is capable of. To continue this growth, big
pharmaceutical companies must introduce at least two to four new drugs per year, a rate that many are not capable of achieving (Reepmeyer 2006).
2.4.2 Risk of Increasing Complexity
As discussed earlier, R&D fuels the innovative developments made by pharmaceutical companies every year. With the growing use of high performance screening
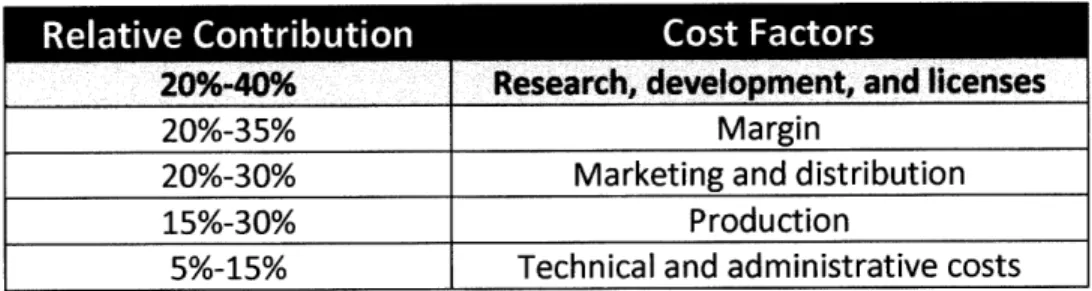
technologies, the ability of researchers and scientists to develop more complex drugs is also increasing. The risk of complexity is that the R&D approval process must be met and the drug made commercially available in a timeframe that is profitable. The cost of R&D already accounts for the majority of a new drug's cost structure (Table 2.3) and increasing complexity threatens to push this percentage even higher.
20%-35% Margin
20%-30% Marketing and distribution
15%-30% Production
5%-15% Technical and administrative costs
Source: Pharma Information (2002)
Table 2.3: Average Cost Structure of Newly Developed Drug
2.4.3 Risk of Technology Investment
Technology plays a crucial role in the pharmaceutical industry in two areas: the R&D phase of drug discovery and manufacturing phase of drug commercialization.
Reepmeyer explains the technology changes:
The technological approaches used in R&D today are mostly based on improved computing power, the rise of advanced computer applications, and a better
understanding of the human genome. High-throughput sampling is one example of new technology that is allowing the screening of more samples at a lower cost than ever before (Reepmeyer 2006).
On the production side, new equipment and processes must be developed to synthesize the complex new drug compounds. The risk of technology investment is high due to the many variables of the industry, including a drug's demand being less than anticipated or a competitor entering with a similar product that gains market share.
2.4.4 Risk of High Attrition
In most industries, a decision to terminate an R&D project is made on the basis of economic or financial reasons. In the pharmaceutical industry most R&D project are dropped due to scientific reasons, many in the late clinical stages due to lack of efficacy or safety concerns (Reepmeyer 2006). Obviously, a drug abandoned later in its
development process results in higher financial loss.
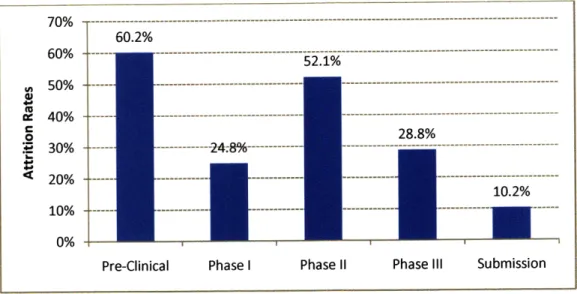
Since the probability of commercializing a drug is low, the costs of abandoned R&D projects are often accounted for in the direct costs of approved drugs. Figure 2.5
shows the attrition rate at varying stages of the R&D process. Over 60% of drugs are abandoned in the Pre-Clinical stage alone.
70% -- ---60.2% 60% - --- --- --- --- ---52.1% n 50% - --- - --4 40% ---- --- ---0 28.8% E 30% ---- --- 24.8%---10.2% --20% --- ---10% 0%
Pre-Clinical Phase I Phase II Phase III Submission
Source: Risk-sharing in the Pharmaceutical Industry: The Case of Out-licensing (2006)
Figure 2.5: Attrition Rate in Pharmaceutical R&D by Phase
2.4.5 Risk of Blockbuster Reliance
For many years, pharmaceutical companies have relied on a series of highly profitable blockbuster drugs - a drug with at least $1 billion in annual sales - to recoup their heavy
R&D expenses and achieve corporate growth. Some smaller pharmaceutical companies have used only one or two blockbusters to sustain profitability for many years, but the risk of relying on blockbusters is twofold.
First, as a blockbuster comes off patent and is exposed to generic competition, a significant revenue stream is greatly reduced. If the company does not have another blockbuster in their portfolio or in the late stages of development, both their stock price and sales can plummet (Reepmeyer 2006). The second risk is that with so much reliance on a small number of products, the company has significant exposure to unforeseen market events. These events could come in the form of a competitor who introduces a superior product with fewer side-effects or a drug that experiences an unpredicted safety issue.
2.4.6 Risk of Market Timing
In other industries, first mover advantage is usually important. In the pharmaceutical industry, it is crucial. As we discussed in the lifecycle model for pharmaceutical drugs, the growth rate and market share gained in the first year or two of a drug's introduction is
extremely important in determining the overall sales for that drug. The longer the drug takes to reach mature sales volume, the less time remains before the patent expiration date and the introduction of generic competition.
The probability of a new drug turning out to be a success is increased by three factors (Reepmeyer 2006):
1. Being early to enter a particular therapy area or product class 2. Being positioned well relative to its existing competitors 3. Being accompanied by heightened pre-launch awareness
Another risk of market timing is that during the long R&D phase of a drug's development, a competitor could introduce a similar product in the same category. If this happens, companies will often lose significant market share to their new competition even if their own drug is highly effective. Unfortunately, with the complex approval and regulatory process, market timing is a hard thing to control.
2.4.7 Risk of Product Differentiation
Product differentiation is usually determined by a drug's clinical profile in four areas: efficacy, side-effects, dosage/administration, and cost (Reepmeyer 2006). Differentiation can be an advantage or disadvantage to a pharmaceutical company depending on whether they have the superior product on the market. If a competing drug offers similar benefits
in one dosage instead of three, they will have a differentiating factor that may be hard to overcome with doctors and patients.
2.4.8 Risk of Regulative Force
The pharmaceutical industry faces more regulation than almost any other industry. Everything from the R&D approval process, to the patent applications, to the pricing is governed by regulations. While ensuring the public is safe from harmful side effects, regulations can also play a critical role in the success of a drug. In a national healthcare system, if a drug is not recommended by the health authorities to be reimbursed, the market potential of the drug can decline significantly (Reepmeyer 2006).
2.5
Impact on Supply Chain Costs
After developing basic knowledge of the industry, identifying market forces was crucial for understanding the channel costs of the pharmaceutical supply chain. Two major concepts emerged that we develop later in our research.
First, during drug introduction and throughout the patented portion of the
lifecycle, availability of the drug to end markets should be the major driver of the supply chain if the company is going to be profitable and successful (Singh 2005). Since years of upfront R&D costs and clinical trials have gone into the development, a drug must immediately capitalize on patent protection to start making a profit. The supply chain must be designed to meet this objective. Even if transportation costs are high, they usually pale in comparison to the opportunity cost of a lost sale and the sunk costs already involved in the drug introduction.
Second, once the drug comes off patent, the supply chain must change objectives to efficiently deliver the drug at the lowest cost. Since the profit margin is significantly reduced after competitive pressure rises, cost becomes the major driver of the supply chain. Transportation costs thus become a much higher percentage of total landed cost of the drug and must be minimized in order for the pharmaceutical company to continue its profitability.
3 Literature Review
Although research on channel costs in the pharmaceutical industry is limited, the cost and benefits of global supply chain systems is a much researched topic. The mass
globalization during the past century can be attributed to the advances in communication and transportation technologies, which have caused an unprecedented increase in the global demand for products (Mentzer, Myers, Stank 2007). As demand spanned multiple regions and countries, companies were faced with increased competition.
To gain a competitive advantage, companies learned over time that sourcing goods from overseas could help them gain pricing advantages (Cook 2007). Extending this
global strategy to their entire supply chain, companies began noticing tremendous gains in profitability and value. Our research looked at methods for measuring the costs and benefits of this global strategy through literature on Cost Allocation, Landed Cost Models, Relevant Models and Frameworks.
3.1 Cost Allocation
According to research by Cooper and Kaplan, most managers make decisions based on incomplete or inaccurate cost data (Cooper, Kaplan 1988). Much of this inaccuracy is due to outdated costing methods and increased complexity of systems and product lines in today's supply chain (ibid.). Furthermore, burden rates based on direct labor are increasingly becoming distorted. Particularly in the pharmaceutical industry, labor and other productivity variables can account for a significant source of costs, and
Schrader 2009). Activity based costing models can provide methods that remove some of this distortion from cost data (Cooper, Kaplan 1988).
In the complex analysis of total costs within a supply chain channel, managers often have to decide between financial or operational metrics, but not both (Kaplan, Norton 1992). These should complement each other - with financial metrics explaining the results of actions already taken, and the operational metrics explaining the drivers of future financial performance. Kaplan and Norton's Balanced Scorecard is a useful tool in considering the cost and interrelationships between these decisions (ibid.). Furthermore, they provide a process for linking costs to a strategy for decision-making (Kaplan, Norton
1996). Additional information on the Balanced Scorecard framework and corresponding strategic methodology is found in Appendix A.
3.2
Landed
Cost
Models
To further identify costs within a global supply chain we explored landed costs. Cook suggests an approach to delineate the domestic and international channels by import and export landed costs (Cook 2007). These landed cost models provided us with examples of how other industries have evaluated these costs when making off-shoring decisions. The import landed costs outlined the variables that contributed to the cost of importing a
good; export landed costs looked at the variables that contributed to the total costs for exporting a good.
In our research, we utilized Cook's landed cost models to identify relevant costs for a pharmaceutical supply chain. Furthermore, import and export landed cost variables identified risks that may occur in a global supply chain. For example, the rising cost of fuel and the fluctuations in global exchange rates have had transformative impacts on
supply chain channel evaluations. As fuel prices continue to rise, we may find that off-shoring to Mexico is more viable than China, even though the wage and manufacturing costs are much lower in China. A list of Cook's suggested import and export landed cost variables are found in Appendix B and C.
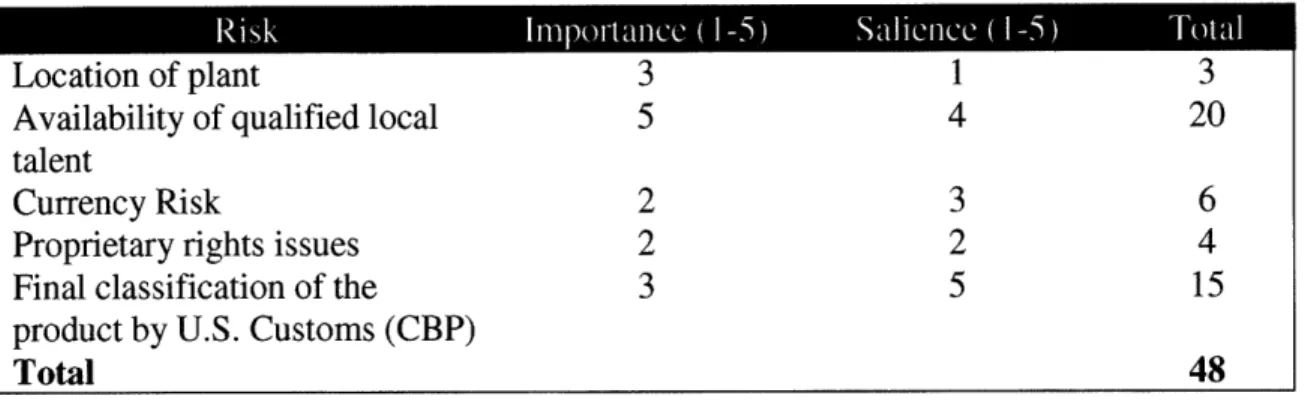
In addition to the landed costs, risk can also have a significant impact on landed costs for a company's supply chain. Risk is often viewed as intangible, uncontrollable costs, making it difficult to quantify. Cook's Risk Matrix provides a mathematical method for analyzing risk and its impact on the total landed cost. Although it does not quantify the actual costs associated with risk within a supply chain channel, Cook's Matrix provides a relative index which can be used to compare channel options.
Furthermore, Cook introduces the concept of "Salience", which is significant because it allows the user to assign weights unique to each risk factor (ibid.). An example of a manufacturing Risk Matrix is provided in Table 3.1.
Location of plant 3 1 3
Availability of qualified local 5 4 20
talent
Currency Risk 2 3 6
Proprietary rights issues 2 2 4
Final classification of the 3 5 15
product by U.S. Customs (CBP)
Total 48
Source: Global Sourcing Logistics (2006)
Table 3.1: Quantifying the Impact of Risk
Evaluating a supply chain channel requires the consideration of both absolute and relative costs, capabilities of the channel, as well as the evolution of the product and channel (Ranjan 2006). Relative costs including risk, quality, and time within the pharmaceutical supply chain channel, can be evaluated using a method of rating each
factor similar to Cook's Risk Matrix. Further analysis of these costs and their impact on the channel also requires mapping the particular industry (ibid.). The process of mapping
should involve analysis of major forces within industry to develop a model or decision framework for analyzing their costs.
3.3 Relevant Models and Frameworks
Models and frameworks are vital to analyzing the behavior and impact of cost variables. Quantitative models provide insight into the cost implication of each variable.
Qualitative frameworks describe cost behaviors and consider the changing impact of decision variables over time.
3.3.1 Quantitative Models
Pharmaceutical customers often require high service levels, especially for life-saving drugs. Due to this strict service level requirement, lead times can have a profound impact on safety stock requirements. Analyzing the impact of lead time can best be done
looking at the Total Cost (TC) model (Silver, Pyke, Peterson 1998). In this model, Total Costs is broken into ordering costs, holding costs, and shortage cost as provided in Figure 3.1 below.
TC=A - +
+
k vr + L (k)DFigure 3.1: Total Cost Equation
The equation in Figure 3.1 assumes shortage costs are on a per unit basis. The per unit shortage cost is particularly relevant for the pharmaceutical industry in which each unit short has an impact on the user - some life-saving drugs may have extremely high
shortage costs. Additionally, lead time has a direct impact on holding costs and the shortage cost (ibid.). Safety stock levels are dependent on the service level factor (k) and standard deviation of forecast errors over the replenishment lead time (CL). Calculating the Safety Stock levels is provided by the equation in Figure 3.2 below.
SS = krL
Figure 3.2: Safety Stock Equation
These equations show that lead time also affects the safety stock levels. In particular, safety stock is a direct multiple of service level factor and the standard deviation of forecasts over the lead time. With high service level requirements and long lead times, one expects to hold higher levels of inventory. Shorter lead times result in lower inventory levels.
3.3.2 Qualitative Frameworks
Research on qualitative frameworks provides a structured method for analyzing
unclassified information. The BCG "Growth/Share Matrix", in Figure 3.3 below, shows the relationship between capital use and generation (Henderson 1970).
High
Growth
(Cash Use) 10% o
Low
Cash Cow Dog
-.
A
High 1.0 Low
Relative Market Share (Cash Generation)
Source: The Boston Consulting Group on Strategy (2006)
Figure 3.3: BCG Growth/Share Matrix
The framework provides a method of identifying the current position of a product or business unit (Porter 1980). Furthermore, the predominant force within the
pharmaceutical industry is intellectual property protection. The migration of products off patent can cause products to reposition within this framework. Our research will look to develop a framework that integrates lifecycle changes for the purposes of aiding strategic decisions through the lifecycle of the product or business unit.
Porter describes another framework which has been attributed to GE, McKinsey, and Shell (ibid.). The "strategic mandate" based on interpretation of this framework as Porter describes, is to "Build", "Hold", or "Harvest" the business unit based on its industry attractiveness and positioning. Again this model provides a strong
recommendation for decision making, but omits long term implications from lifecycle maturation. A schema of this framework is found in Appendix D.
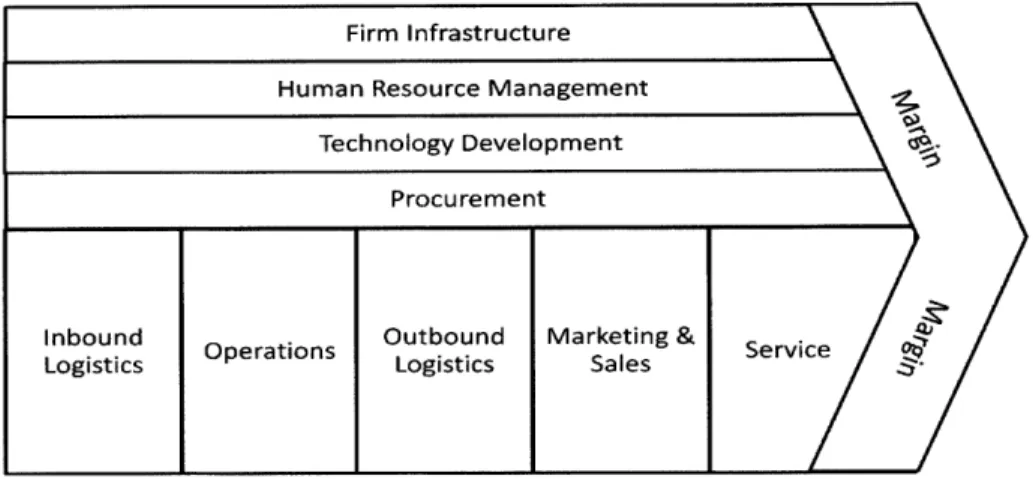
Porter's Value Chain model as depicted in Figure 3.4, provides a framework for looking at how the primary and supporting activities of a supply chain network provide competitive advantage for a firm (Porter 1985).
Firm Infrastructure
Human Resource Management
Technology Development Procurement
Inbound Outbound Marketing & Service
Operations Service 9
Logistics Logistics Sales
Source: Competitive Advantage (1985)
Figure 3.4: Porter Value Chain Framework
These activities provide a means to evaluate the way companies gain competitive advantage in its collection of activities to "design, produce, market, deliver, and support its product" (ibid.). Furthermore, Porter's research explores a method of cost allocation into three categories: purchased operating inputs, human resource costs, and assets by major category. Other methods include the grouping of costs by direct, indirect and quality assurance activities (ibid.). These allocation methods, in addition to the value chain framework, provide a means to evaluate the way costs impact a firms competitive positioning within its industry.
3.4 Our Contribution
Existing research on landed cost models will provide this study with a foundation for identifying the relevance and impact of cost variables for a large pharmaceutical supply
chain network. As an extension of Cook's broad landed cost study, our research will look to isolate total channel cost variables including both import and export landed costs and other production costs such as manufacturing costs, financing, inventory-in-transit, fuel costs, exchange rates, and physical logistics.
Another contribution from this research will be our categorization of these cost variables and an analysis of how changes may impact total acquisition cost values. The aforementioned research in this section describes various methods to categorize cost variables into an analysis framework. Our research will build on these existing frameworks by integrating the impact of lifecycle maturation into decision making process. Although this research will be conducted for the pharmaceutical industry, we expect this combined methodology to be applicable to other industries as well.
4 Data Collection and Analysis
The pharmaceutical company in our study organizes its supply chain channel into four core groups: Strategy and Planning, Finance, Operations, and Logistics. Other supply chain functions such as Procurement, HR Management, and Technology, as well as supporting functions including Sales/Marketing and Service also influence the supply chain activities within this organization (Porter 1985). For the purposes of our study, we focused on the core business functions that impact the channel costs of a supply chain network.
In order to best compare multiple channels we must identify landed costs, indicate how they impact the supply chain, and then organize these costs into a structural
framework (Cook 2007). Accordingly, we identified relevant variables that impact the total acquisition costs of our supply chain channel through interviews. Next, we analyzed the impact of these channel costs based on measurability and variability drivers. Finally, we categorized each cost to better understand the key forces that drive cost in our supply chain channel.
4.1 Interview Process
A significant portion of our research was conducted with the help and guidance of professionals working at our case company. These professionals worked in a variety of business units in locations around the world. Through the interviews, we were able to gain insight into the pharmaceutical supply chain from a number of different
perspectives. Each business unit considered only those costs, challenges, and metrics for which they were responsible. In the next few sections, we include the data gained from
the interviews and in later sections we categorize and analyze the data to develop meaningful trends.
4.1.1 Format of Interviews
We used a modified Delphi Study approach for our interviewing process (Dalkey 1972). These interviews were typically 30 minutes to 1 hour long and involved experts in the fields of sourcing strategy, logistics, manufacturing, and finance. Questionnaires (Appendix E) were sent to our panel followed by an interview. Iterative questions were asked based on feedback from previous questions according to Delphi techniques. Finally, our analysis was sent back to the panel to hone and refine cost identification and process results. As prescribed by the Delphi approach, our panel was segmented and interaction was minimized to remove bias from our results.
4.1.2 Finance
The Finance group plays a crucial role in managing transactions throughout the organization and checks expenses for each region. The group reviews buyer/seller relationships and handles customers who can range from pharmacies (in the European Union) to distributors (in the United States). The Finance group is responsible for
monitoring shipping costs in the main Distribution Hubs that transfer products to other parts of the company and use efficiency metrics to evaluate their third party logistics
(3PL) providers. Since the group is responsible for transactional efficiencies, they must find the right balance of owning and outsourcing the transportation requirements to arrive at the lowest channel cost. 3PL's offer agility and savings up front, but as a business grows and the product stabilizes, ownership of the transportation can be more beneficial. Fuel is a big cost but is built into many 3PL contracts.
Another function of the Finance group is setting budget guidelines and tracking how actual expenses are meeting these guidelines. With the high number of variable expenses, they must closely watch volume changes within different regions. Since the company operates on a global scale, a group located inside Finance handles the
implications of exchange fluctuations as products move around the world.
Freight is one of the biggest costs in the Finance group, both of local service providers as well as within their own operation. Flexibility is an important factor and priority is placed on the ability to service the customer under any condition. This can include using a faster form of transportation (i.e. air versus ground) even if it is more expensive. High plant utilization is another key to lowering costs and capacity decisions are made to maximize their assets. Some expenses that are not easily measured but important to the Finance group are environmental, health, and safety costs (EH&S), security costs, and customs clearance costs.
4.1.3 Sourcing Strategy
The Sourcing Strategy group is responsible for determining where to manufacture
products and ensures plants are right-sized to meet demand. There are four main decision factors when evaluating which plant should produce a drug:
1. Technology - Certain products require different technologies within the manufacturing locations, so some plants have different roles.
2. Complexity - Drugs also vary in their difficulty of production and might require the experience and knowledge of a certain plant. For instance, new products are usually low on the learning curve, so plants with high technical capabilities are used to develop and streamline the process.
3. Capacity - The volume of a plant is very important and the Sourcing Strategy group tries to maximize capacity utilization. They make sure a plant has enough volume to be efficient and cost-competitive in their manufacturing. As a drug becomes more popular, scale can become a big factor and plants can become undersized.
4. Factor costs - Plants in different locations have varying utility costs, labor costs, and facilities costs.
Lifecycle management plays a key role in Sourcing Strategy. As a drug moves through its lifecycle from patented to generic, cost becomes increasingly important as it comes off patent (usually around 10-12 years from launch). This can sometimes mean moving a drug during its lifecycle from a high capability/high cost plant to a lower cost plant once the production process is established.
Like many companies that have grown through acquisitions and mergers, the pharmaceutical company in our study must deal with legacy plants and try to eliminate redundancies in their system. Since taxes are a major expense to the company, tax incentives offered by different regions provide a strategic means to lower costs. Sourcing Strategy also evaluates logistics costs, migration costs, costs due to regulations, customer
service costs, and quality costs. Some Soft costs that affect decisions are the stability of the political environment and the ease of doing business in a country. We used these costs as important components in our framework.
4.1.4 Distribution Hubs
We conducted interviews with managers of the major Distribution Hubs within the company's logistics network. The Distribution Hubs are responsible for coordinating the
physical and transactional flow of products as well as handling the required
documentation for these transactions. The products can be in any state from base active pharmaceutical ingredients to finished drugs. The Distribution Hubs use a combination of warehousing and cross docking to move product efficiently through the hub, but also have ownership and control of products that flow through remote contract companies. The process of using remote companies allows control of the product while still taking advantage of tax havens.
The Distribution Hub is service oriented, and often expedites deliveries to provide high service levels. Other major costs include management of people, management of
facilities, system overhead costs, and import/export licenses. Costs incurred to meet the regulations and quality standards are also included in our framework.
4.1.5 Transportation/Logistics
The Transportation and Logistics group handles the movement of product around the world and manages the supply planning to ensure product availability. The group works with Manufacturing to coordinate demand planning and interfaces with Finance if a product needs to go through a certain Distribution Hub.
Since the availability of lifesaving drugs is paramount, stockout costs are very high. The Transportation group tracks their performance using in-stock percentage and the number of days a drug is in stock per month. There are a few main concerns that this group must deal with:
1. Volume shipped - Many of the transportation costs are variable and scale with the amount shipped.
2. Service - Ensuring the customer has the product they need, when they need it, is of the utmost importance. The goal is to maintain high service levels even though this incurs higher costs.
3. Shipping requirements - Special product requirements including refrigeration, substance control, and hazardous material handling add complexity and logistics costs to the channel.
4. Damaged goods - Many of the products pharmaceutical companies deliver are easily damaged, either by physical destruction or by extreme temperature. This adds additional cost to the channel and is incorporated into our framework as shrinkage costs.
5. Utilization - Maximizing the efficiency of the Distribution Hubs as well as the transportation network is crucial to high utilization.
The Transportation group must also tackle the lifecycle issue. Patented drugs gain more from tax advantages while generic drugs have lower delivered costs if they are produced in regions with low factor costs or produced closer to the end market.
Unfortunately, there is often a tradeoff between locations with tax-advantages and locations with lower operational and logistics costs. As the product moves from a patented to a generic drug, the optimal choice may shift for a pharmaceutical company to
stay cost competitive.
Following the trend across many industries, the company is looking for fewer partnerships that are more strategic in nature. With this as the guiding philosophy, transportation providers are evaluated on four characteristics:
2. Capability 3. Quality 4. Cost
To lower costs, ocean freight is used as much as possible. Since the value of drugs is high compared to their weight, one ocean container can be extremely valuable. This has led to problems with liability and insurance as the pharmaceutical company and the shipping company each try to manage the risk of product being damaged.
Throughout the shipping process, the security of the goods must be maintained to ensure product safety and quality.
Since this group is customer facing, reputation is important. The brand's quality and availability are at stake so service is always prioritized over cost. New product launches are particularly challenging since demand is unknown and varies greatly as the product becomes increasingly popular. Air freight usually has to be used to ensure product availability despite the increased cost due to the high value density of the drugs.
One of the other challenges facing the Transportation group is ensuring
availability in a highly price and product controlled market. Licenses must be obtained in every market a drug is sold and regulations control the batch sizes, the handling, the materials, and the movement of product within the network. Changing sources can take from 30 days to 2.5 years depending on the country and the regulations in place.
4.2 Cost Identification
The interviews provided a wealth of information about many aspects of the
groups interacted. The next step was to identify costs from both the interviews and our research that could help with supply chain decision-making. Table 4.1 summarizes the costs we identified.
sts I e
3rd Party Logistics The cost of transportation offered by 3rd party providers Cost of Capital The interest on the money borrowed to finance operations
Currency Exchange The costs of dealing with a foreign currency
The cost of doing business in a country (includes political, Ease of Business government, and regulatory considerations)
Environmental Fees The cost of fees associated with environmental restrictions Facilities Cost The cost of facilities
Fuel Surcharges The cost of fuel
Import/Export Fees The cost of moving goods into and out of countries
Insurance The cost to insure business operations
Inventory Holding Costs The cost of storage and maintenance to keep excess inventory Labor Costs The cost of wages plus benefits
Lead Time The additional costs incurred with extra lead time
Learning Curve Cost The cost of new product launch and process improvement Licensing Fees The cost of licensing a drug for sale in a market
Mode The cost difference between Air, Ocean, and Ground Other Overhead Any additional costs for maintaining the business Port Charges/Taxes The cost of utilizing a port
Quality The cost of meeting target quality levels
Regulations The cost of meeting government regulations in each market Risk The cost of unpredictable situations occurring
Safety Costs The costs for implementing safeguards
Security Fees The cost to prevent counterfeits or theft in the supply chain
The incremental cost for shipping high value products (mainly applies Shipment Liability Costs to shipping ocean containers)
Shrinkage Cost The cost of damaged or stolen products
The cost of shipping refrigerated products, controlled substances, or Special Handling hazardous materials
Stockout Cost The cost of a lost sale due to unavailability of a product
Taxes The cost of government duties on product values Technology The cost of technology to produce or ship product Utilities The cost of utilities
Utilization The cost of worker and machine efficiency
We also identified strategic drivers that have cost implications within a supply chain channel. These drivers, although they do not directly create cost, do create
constraints and conditions that result in channel costs. For example, the decision to hold more control over one's supply chain channel will result in costs associated with the added need for oversight including 3PL, facilities cost, mode, regulations, and security cost. Table 4.2 provides a list of these strategic drivers.
StrategicL
DivrChrceits
Capacity
The cost of ensuring enough supply to meet demand (this driver incorporates the following costs: facilities cost, labor cost, technology, and utilities)
The additional cost due to the difficult process of making a drug (this driver incorporates the following costs: labor cost, learning curve cost, Complexity quality, technology, and utilities)
The additional cost of managing supply chain functions in house for added oversight (this decision incorporates the following costs: 3PL, Control facilities cost, mode, regulations, and security cost)
The additional cost depending on proximity to market (this driver Distance incorporates the following costs: fuel surcharges and mode)
Capability Ability to adapt production for other products (this driver incorporates Flexibility the following costs: facilities cost, labor cost, and technology)
Capacity Ability to scale production (this driver incorporates the following costs: Flexibility 3PL facilities, labor, and mode)
The cost of meeting customer's needs (this driver incorporates the following costs: 3PL, inventory holding cost, labor cost, mode, quality Service Costs and stockout cost)
Table 4.2: List of Strategic Drivers
4.3 Categorization
Interviews were also helpful in identifying common characteristics among costs. For example, we discovered that in the pharmaceutical industry both freight insurance and currency exchange costs depend on the value of the product. Integrating details from our
interviews with our research, we arrived at a categorization method based on direct measurability (which we call "Hard" and "Soft" costs) and on their variability drivers.
4.3.1 Hard and Soft Costs
Companies often measure their total acquisition cost based on values that they can
directly attribute to the activities of a supply chain. Costs such as licensing fees and taxes often have strict accounting values and are useful for decision making. Due to the direct measurability and defined impact of these costs, we call them "Hard" costs for the purpose of our analysis.
In addition, we found other variables that can have an indirect impact on total costs such as delivery lead time. For example, a longer delivery time may cause the market managers to order additional inventory and add increased inventory cost to the channel. We label these costs as "Soft" due to their indirect influence on total channel costs. Meanwhile, some Soft costs, such as the cost of flexibility and risk are harder to quantify. Based on methods proposed by Thomas Cook, we present a process of quantifying these costs in section 5.3.2. A list of costs categorized by Hard and Soft is presented in Table 4.3.
Costs0Identif ied Type C t d ie T 3rd Party Logistics Hard Ease of Business Soft
Cost of Capital Hard Lead Time Soft
Currency Exchange Costs Hard Learning Curve Cost Soft
Environmental Fees Hard Quality Soft
Facilities Cost Hard Regulations Soft
Fuel Surcharges Hard Risk Soft
Import/Export Fees Hard Safety Costs Soft
Insurance Hard Utilization Soft
Inventory Holding Costs Soft
Labor Costs Hard
Licensing Fees Hard
Mode Hard
Other Overhead Hard
Port Charges/Taxes Hard Security Fees Hard Shipment Liability Costs Hard Shrinkage Cost Hard Special Handling Hard Stockout Cost Hard
Taxes Hard
Technology Hard
Utilities Hard
Table 4.3: Categorization of Costs Based on Measurability
4.3.2 Variability Drivers
Through our study, we discovered that variability can add tremendous cost into the channel. To measure the full impact of variability on our identified costs, we looked at factors that drove this variability and then modeled the forces that drove these changes. Interviews and research provided a basis for determining key variability drivers. We found that "Value" and "Volume" fluctuations accounted for a majority of variability in our system. For instance, taxes were value-based costs and could change when the value of the product changed. In the case of volume fluctuations, we saw that utilities costs