HAL Id: hal-02998294
https://hal.archives-ouvertes.fr/hal-02998294
Submitted on 10 Nov 2020
HAL is a multi-disciplinary open access
archive for the deposit and dissemination of
sci-entific research documents, whether they are
pub-lished or not. The documents may come from
teaching and research institutions in France or
abroad, or from public or private research centers.
L’archive ouverte pluridisciplinaire HAL, est
destinée au dépôt et à la diffusion de documents
scientifiques de niveau recherche, publiés ou non,
émanant des établissements d’enseignement et de
recherche français ou étrangers, des laboratoires
publics ou privés.
picosecond fluorescence at room temperature
Ahmad Farhan Bhatti, Reza Ranjbar Choubeh, Diana Kirilovsky, Emilie
Wientjes, Herbert van Amerongen
To cite this version:
Ahmad Farhan Bhatti, Reza Ranjbar Choubeh, Diana Kirilovsky, Emilie Wientjes, Herbert van
Amerongen. State transitions in cyanobacteria studied with picosecond fluorescence at room
tem-perature. Biochimica biophysica acta (BBA) - Bioenergetics, Elsevier, 2020, 1861 (10), pp.148255.
�10.1016/j.bbabio.2020.148255�. �hal-02998294�
Contents lists available atScienceDirect
BBA - Bioenergetics
journal homepage:www.elsevier.com/locate/bbabio
State transitions in cyanobacteria studied with picosecond
fluorescence at
room temperature
Ahmad Farhan Bhatti
a, Reza Ranjbar Choubeh
a, Diana Kirilovsky
b, Emilie Wientjes
a,
Herbert van Amerongen
a,c,⁎aLaboratory of Biophysics, Wageningen University, Wageningen, the Netherlands
bInstitute for Integrative Biology of the Cell (12BC), CEA, CNRS, Université Paris-Sud, Université Paris-Saclay, 91198 Gif-sur-Yvette, France cMicroSpectroscopy Research Facility, Wageningen University, Wageningen, the Netherlands
A R T I C L E I N F O Keywords: Time-resolved spectroscopy Excited-state quenching Cyanobacteria State transition A B S T R A C T
Cyanobacteria can rapidly regulate the relative activity of their photosynthetic complexes photosystem I and II (PSI and PSII) in response to changes in the illumination conditions. This process is known as state transitions. If PSI is preferentially excited, they go to state I whereas state II is induced either after preferential excitation of PSII or after dark adaptation. Different underlying mechanisms have been proposed in literature, in particular i) reversible shuttling of the external antenna complexes, the phycobilisomes, between PSI and PSII, ii) reversible spillover of excitation energy from PSII to PSI, iii) a combination of both and, iv) increased excited-state quenching of the PSII core in state II. Here we investigated wild-type and mutant strains of Synechococcus sp. PCC 7942 and Synechocystis sp. PCC 6803 using time-resolvedfluorescence spectroscopy at room temperature. Our observations support model iv, meaning that increased excited-state quenching of the PSII core occurs in state II thereby balancing the photochemistry of photosystems I and II.
1. Introduction
In photosynthetic organisms harvesting of sunlight is the initial step in the process of converting solar energy to chemical energy [1,2]. Photon absorption in cyanobacteria takes place in membrane-external pigment-protein antenna complexes (phycobilisomes) and membrane-embedded chlorophyll (Chl) a antenna complexes [3]. Harvested photon energy is transferred to the reaction centre complexes of pho-tosystems I and II (PSI and PSII) through a series of (down-hill) ex-citation-energy transfer (EET) steps [4]. The amount of excitation en-ergy arriving at the reaction centre of a photosystem is proportional to the absorption cross section of the associated antenna complexes and the efficiency of the EET process.
Cyanobacteria can rapidly regulate the relative activity of PSI and PSII in response to changes in the illumination conditions [5] including dark-light transitions [6,7]. This regulatory process for optimal photo-synthesis under low-light conditions is known as state transitions [2,8–10]. The trigger for state transitions is the redox state of the plastoquinone pool between PSI & PSII [6]. Oxidation of the plasto-quinone pool by light which preferentially excites PSI induces a tran-sition to state I whereas reduction of the plastoquinone pool by the preferential excitation of PSII induces a transition to state II. State II can
also be induced by respiratory electronflow into the plastoquinone pool in the dark [6]. State transitions are characterized by a relative decrease of PSIIfluorescence in state II as compared to state 1 [11].
In green plants, the redistribution of light-harvesting complex II (LHCII) between PSII and PSI is part of the physiological mechanism accompanying state transitions [12–14]. Despite the discovery of state transitions in cyanobacteria long ago [9], a comprehensive under-standing of the process is still evasive. The phycobilisome (PBS) an-tenna in cyanobacteria is the functional equivalent of the LHCII anan-tenna in plants. The (re)distribution of the excitation energy to the photo-systems through reversible migration of PBSs between PSI and PSII during state transitions, was proposed in some earlier studies [15–18]. Rapid diffusion of the PBSs along the surface of thylakoid membranes leading to transient interactions (association/disassociation) with the less mobile photosystems is at the basis of the mobile PBS model [19]. However, the PBS mobility model fails to explain the change in ratio of PSI/PSIIfluorescence upon Chl a excitation [20]. Another model for state transitions in cyanobacteria, the one of direct“spillover” of ex-citation energy from PSII to PSI was proposed earlier for Anacystis ni-dulans [21] and for Synechocystis PCC 6803 [22] to explain the fluor-escence changes during state transitions upon Chl a excitation. According to the spillover model, the excess excitation energy available
https://doi.org/10.1016/j.bbabio.2020.148255
Received 16 March 2020; Received in revised form 19 June 2020; Accepted 21 June 2020
⁎Corresponding author at: Laboratory of Biophysics, Wageningen University, Wageningen, the Netherlands.
E-mail address:Herbert.vanAmerongen@wur.nl(H. van Amerongen).
BBA - Bioenergetics 1861 (2020) 148255
Available online 30 June 2020
0005-2728/ © 2020 The Authors. Published by Elsevier B.V. This is an open access article under the CC BY license (http://creativecommons.org/licenses/BY/4.0/).
at PSII in state II (absorbed by the PBS antenna or Chl a inner antenna of PSII) spills over from PSII to PSI. The spillover model was supported by the observation that in state I the PSII complexes are arranged in a row while in state II the arrangement of PSII complexes becomes more random, which may result in a decreased distance between PSII and PSI, thereby facilitating direct excitation energy transfer (EET) from PSII to PSI [23]. A functional megacomplex consisting of PBS-PSII-PSI was isolated from Synechocystis PCC 6803 [24] and was considered to support this spillover model. Time-resolvedfluorescence characteriza-tion of the megacomplex revealed that one PBS could transfer the ex-citation energy to both photosystems and energy transfer to PSI was found to be less efficient than to PSII [24], although direct evidence for this spillover was not provided. In addition, the evidence for the pre-sence of megacomplexes in intact cells and their characterization in state transitions is to date not available [7]. Incompleteness of the spillover model became explicit in a number of studies in which fluorescence changes, characteristic for state transitions, were less pronounced upon Chl a excitation as compared to PBS excitation [20]. To account for these differences, a comprehensive model (mixed model), combining the features of PBS mobility and spillover was proposed for Synechococcus PCC 7942 [20,25].
In the cyanobacteria Synechocystis PCC 6803, Synechococcus PCC 7002, and Anabaena PCC 7120, mutants lacking the ApcD gene product were reported to be impaired in performing state transitions [26–29]. Emlyn-Jones et al. [30] observed that the Synechocystis sp. PCC 6803 rpaC−mutant did not show anyfluorescence changes related to state transitions upon PBS excitation although they were observed upon Chl a excitation. This observation clearly revealed that both a spillover as well as a combination model are insufficient to fully describe the pre-sence/absence of fluorescence changes during state transitions. McConnell et al. [20] put forward a modified version of the spillover model to account for this experimental observation. They suggested that excitations created in the PBSs are directly transferred to the PSII reaction centres and cannot be lost via spillover to PSI in state II. In the wild-type cyanobacteria, the rate of EET from PBS to PSI was proposed to increase in state II, whereas it did not increase in the Synechocystis rpaC−and Synechococcus 7002 ApcD mutants [20]. On the other hand, it was proposed that excitations in the core antenna complexes (CP43 and CP47) of PSII can spill over to PSI in state II, both in the wild-type and mutants. However, experimental evidence for changes in EET from PSII to PSI and from PBS to PSI in state II during state transitions is lacking so far [7,31]. McConnell et al. [20] concluded that their model, which suggests only slight changes in the association of the PBS-PSII supercomplex with PSI is not compatible with the FRAP data, which indicates a higher lateral mobility of the PBSs as compared to the PSII-associated Chl a molecules after photobleaching with a laserflash [19]. In a 77 K time-resolved fluorescence study of state transitions in the cyanobacterium Synechococcus elongatus no evidence was found neither for the migration of PBSs from PSII to PSI in state II nor for the spillover of energy from PSII to PSI [31] and both processes were ruled out [31]. Instead the observed decrease in PSIIfluorescence in state II was as-cribed to direct quenching of PSII complexes [31].
Which model or combination of models presented above, would best describe the state transitions in cyanobacteria at physiologically re-levant conditions? Is there some common explanation for all or most of the experimental observations reported in literature regarding state transitions in cyanobacteria? Do PBSs and PSII complexes have in-dependent roles during state transitions? Is the PBS core involved in the physical mechanism required for the state transitions in cyanobacteria? Tofind answers to these questions we investigated strains of the cyanobacteria Synechococcus sp. PCC 7942 (hereafter Synechococcus) and Synechocystis sp. PCC 6803 (hereafter Synechocystis) using time-resolvedfluorescence spectroscopy. Light harvesting in cyanobacteria is primarily accomplished by the PBS antenna [32–34]. Structurally, a PBS is composed of fan-like phycocyanin (PC) rods which radiate from a central core. The core attaches to the stromal side of the
photosynthetic membrane and is comprised of cylinders (number of cylinders is specific to the organism) which are composed of trimeric discs of allophycocyanin (APC) [34]. In Synechococcus and Synechocystis the PBS core is comprised of bi-and tri-cylindrical APC trimeric discs, respectively. In the case of Synechocystis only two basal cylinders of the core bind to the thylakoid membrane [29]. Three important compo-nents of this core are the phycobiliproteins ApcD, ApcE and ApcF. ApcD and ApcE are thefinal acceptors of PBS-absorbed excitation energy, meaning that their lowest excited states are lower in energy than those of the other pigments in the PBS. ApcF on the other hand influences the optical properties of ApcE and could modify the energy transfer to one or both photosystems depending on the strain [27,28,33]. These three components of the PBS core transfer the PBS-absorbed excitation en-ergy to the photosystems [28,29]. To characterize the role of the PBS core and its low-energy pigments during state transitions, the mutants lacking the ApcD and ApcF components in both strains were also stu-died. The lack of ApcD and ApcF was concluded to inhibit/decrease state transitions in Synechocystis [28,29] but not in S. elongatus. A mutant lacking ApcE component was not used in this work, because the PBSs are no longer stably attached; the ApcE subunit, also known as LCM, is essential for the PBS assembly and is also a structural component
of the PBS core and involved in thylakoid membrane interaction [29,35–37]. All of the experiments in the present study were performed at room temperature (RT) and states I and II were induced by keeping the cells in blue light and darkness, respectively.
2. Materials and methods 2.1. Strains and growth conditions
Synechocystis and Synechococcus, WT, ΔApcD and ΔApcF strains were grown in BG11 medium (20 ml/l) buffered with sodium bi-carbonate (0.85 g/l), and sodium nitrate (1.75 g/l) at pH ~8.0. Medium for mutants deficient in ΔApcF was complemented with spectinomycin (25 μg/ml) and streptomycin (10 μg/ml). Media for Synechocystis ΔApcD and Synechococcus ΔApcD were complemented with chlor-amphenicol (20μg/ml) and kanamycin (40 μg/ml), respectively. All strains were grown at 30 °C under white light illumination at 50μmol photons m−2s−1in 250 mlflasks shaken at 100 rpm, containing cul-ture volumes of 60 ml as described in [31]. The construction of Sy-nechocystisΔApcD and ΔApcF was described in [35] and that of Sy-nechococcusΔApcD and ΔApcF in [29].
2.2. Sample preparation
All the WT and mutant cells were harvested during their logarithmic growth phase at optical density ~0.6–0.7 at 800 nm (OD800) for a path
length of 1 cm. Cells were diluted with their respective fresh medium to OD630~0.35 as measured with a Cary 4000 UV–Vis spectrophotometer
with integrating sphere. To drive the cells to state I and II, they were kept in blue light (of 452 ± 40 nm at ~40μmol photons m−2s−1
intensity) and darkness, respectively, for about 15 min. Using a pulse-amplitude modulated fluorometer (PAM101; Walz, Effeltrich, Germany) state transitions were monitored. Measurements were per-formed in a 1 cm × 1 cm stirred quartz cuvette.
2.3. Replicates
All time-resolvedfluorescence experiments were performed at least twice on each individual sample on the same day (technical replicates) while biologically independent experiments (biological replicates) were performed on different samples on different days separated by a few weeks up to several months. Representative data from each strain is presented in this work and all changes/differences that are relevant for our conclusions are fully reproducible. Standard deviations are given for the decrease in PSIIfluorescence upon State I to State II transition.
2.4. Time-resolvedfluorescence spectroscopy
Time-resolvedfluorescence measurements were performed at room temperature with a synchro scan streak camera [38] as described in [7,31]. Sub-picosecond pulses of 577 nm and 430 nm wavelength with repetition rate of 3.8 MHz were used to preferentially excite the PBSs and photosystems, respectively. The laser power was ~20μW for PBS excitation and ~60μW for Chl a excitation. The laser spot size was ~0.1 mm in both cases. Time-resolved emission spectra were recorded with a time window of 800 ps for resolving the fast components and 2000 ps for estimation of the slowest component. Sixty streak images were recorded, where each image was an analogue integration of 20 exposures with exposure time of 1112 ms each. Streak images were corrected for background and for wavelength-dependent sensitivity of the detector. Processed streak images were then globally analysed using the Glotaran [39] and TIMP package for R [40] to determine the fluorescence lifetimes and decay-associated spectra (DAS) as described in [7,31]. For all of our measurements the time-resolvedfluorescence is described with five components after 577 nm excitation and four components after 430 nm excitation. For each measurement the ob-tained DAS were summed, which provided the estimatedfluorescence spectrum at t = 0, i.e. immediately upon excitation and this t = 0 spectrum was normalized to a value of 1 in the maximum. All the in-dividual DAS were corrected with the same scaling factor. Steady-state fluorescence spectra were subsequently calculated as a sum of the products of amplitudes (DAS) and their respective decay times and below they are referred to as reconstructed (steady-state) spectra. For all streak experiments cells adapted to state I were kept under the same light condition for the duration of the measurement. To verify the re-versibility of the state transitions in our samples, cells measured in state I were adaptedfirst to darkness for ~15 min and then again measured in state I. Time-resolved emission of both state I measurements were compared and were found to be virtually identical. Measurements were performed in a 1 cm × 1 cm stirred quartz cuvette.
3. Results
3.1. Pulse-amplitude modulatedfluorometry
In cyanobacteria, state transitions balance the relative amount of PSI and PSII excitations, which is reflected in the (relative) amount of PSI and PSII fluorescence. Therefore, state transitions can readily be monitored by measuring the level of PSI and PSIIfluorescence at 77 K [41–44]. At room temperature the fluorescence decay of PSI is ex-tremely fast (~20 ps) and therefore has a very small contribution to the steady-statefluorescence which is dominated by PSII emission [45].
To estimate the time it takes to induce state I and state II in cya-nobacteria, use was made of pulse-amplitude modulated (PAM) fluorometry. With this method, state transitions in photosynthetic or-ganisms can be followed at room temperature, since they are char-acterized by changes in the levels of PSIIfluorescence as a function of the intensity and spectrum of the actinic light, which is used to drive photosynthesis [46]. InFig. 1 afluorescence time trace is shown for Synechococcus WT cells in different illumination conditions as recorded with a PAMfluorometer.
The PAMfluorescence trace contains some contribution from free phycobilisomes (PBS) and PSI but the major contribution stems from PSII and PBS complexes connected to the photosystems [47]. F0and Fs´
represent the minimumfluorescence for cells kept in darkness and the steady-state fluorescence in the (blue) light, respectively. Minimum fluorescence was measured with non-actinic 1 μsec pulses of measuring light with 1.6 kHz frequency. The minimumfluorescence represents the fluorescence of cells with mainly open reaction centres. Periodic sa-turating pulses of white light closed the PSII RCs, causing the fluores-cence to reach the maximum level, i.e. Fmfor cells in darkness and Fm´
for cells in the light. The extent of state transitions is proportional to the
relative change in the maximumfluorescence.
A sharp rise influorescence for F0, Fs′ and Fmlevels was seen when
dark-adapted cells were exposed to blue light to bring them into state I. A decrease was observed when light-adapted cells were again put in darkness to drive the cells to state II. Periods of 20 min were found to be sufficient to bring the majority of the cells to state I/II from state II/I, respectively.
3.2. Time-resolvedfluorescence spectroscopy results
Use was made of the time-resolved fluorescence spectroscopy to study the state transitions in both wild-type species of Synechococcus, Synechocystis and theirΔApcD and ΔApcF mutants.
In time-resolvedfluorescence spectroscopy an accurate interpreta-tion of the fluorescence decay lifetimes and their associated wave-length-dependent amplitudes is crucial for the understanding of the phenomena under investigation. To be sure that the fluorescence changes observed in our measurements are represantative of state transitions only, all the measurements were done at the Fm(closed PSII
reaction centres) level of the cells.Fig. 2shows thefluorescence decay traces at ~680 nm (PSII and PBS emission wavelengths) for Synecho-coccus cells, both in state I and state II at various powers of the 577 nm excitation pulses. Thefluorescence decay traces measured with weak-intensity pulses (average laser output 0.1μW–0.15 μW (black curves)) correspond to the situation in which the PSII reaction centres were predominantly open.
Raising the power to 3μW led to fluorescence with closed PSII re-action centres. Increasing the power further (22μW–25 μW) did not cause an additional slowing down of the kinetics and the kinetics were similar/identical to those with the reaction centres closed by the use of DCMU. The similarity of thefluorescence decay kinetics in the range of 3–25 μW also demonstrates that the fluorescence kinetics were not af-fected by singlet-singlet or singlet-triplet annihilation which would have shortened the excited-state lifetime at higher excitation powers [46].
InFig. 3characteristicfluorescence decay traces at the maximum
Fig. 1. Time traces of variablefluorescence in wild-type Synechococcus 7942 measured with the pulse-amplitude modulatedfluorescence technique. The fluorescence detection window was > 700 nm. Black and blue thick solid lines along the time-axis represent the time periods of cells in darkness and blue light respectively. Blue light with central wavelength 452 nm and ~40μmol photons m−2s−1was used to bring the cells to state I. Blue-light-adapted cells were subsequently put in darkness to bring the cells to state II. F0, Fmrepresent
minimum and maximumfluorescence, respectively, for dark-adapted cells. Fs´
and Fm´are steady-state and maximumfluorescence, respectively, for cells in
blue light.
A.F. Bhatti, et al. BBA - Bioenergetics 1861 (2020) 148255
emission (~680 nm) of PBS terminal emitters and PSII, for Synecho-coccus and Synechocystis cells in state I and II are shown upon 577 nm excitation. Thefluorescence kinetics at 680 nm show a slower decay for the cells in state I as compared to the cells in state II for both strains, which is characteristic for state transitions in cyanocteria. The fluor-escence changes are much more pronounced for Synechococcus (Fig. 3A) than for Synechocystis (Fig. 3B).
3.3. State transitions in Synechococcus WT,ΔApcD and ΔApcF
Measurements were performed both with selective excitation of the PBSs (577 nm excitation pulses) and the photosystems (430 nm ex-citation pulses) to determine the individual roles of the phycobilisomes and photosystems during state transitions. The recorded time-resolved fluorescence spectra in each case were analysed with the global-analysis method to obtain the DAS.
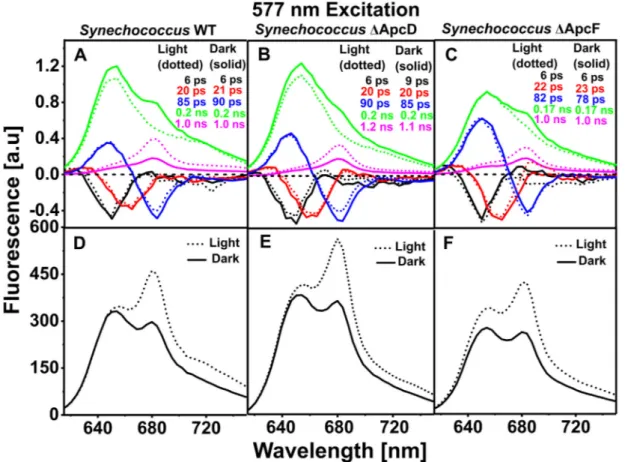
Five-components DAS for WT, ΔApcD, and ΔApcF Synechococcus cells are shown inFig. 4for cells in state I (dotted lines) and II (solid lines). The ≤10 ps DAS with negative peak at 650 nm reflect EET within phycocyanin (PC) discs [31,48,49]. EET occurs predominantly from higher-energy to lower-energy pigments. The ~20 ps DAS with positive peak at 630 nm and negative peak at 660 nm describe
down-hill EET from PC rods to the APC660core. The ~80–90 ps DAS describe
EET from higher-energy pigments in the PC rods (~655 nm peak) to the lower-energy pigments in APC680(~680 nm) and Chls. Thefirst three
DAS are very similar for each type of cells in state I and II and de-monstrate that EET within PBSs is not substantially affected during state transitions.
Transitioning of the WT and mutant cells from state I to state II (light to dark) was accompanied with: (i) a decrease in the amplitude of the (slowest)τ = ~1.0 ns component and (ii) a concomitant rise of the amplitude of theτ = ~0.17–0.2 ns component at 680 nm. In an earlier study of Synechococcus 6301 the ~0.15 ns component with the emission band around ~680 nm (corresponding to ~0.17–0.2 ns component in the present work) was assigned to the PBS terminal emitters [44].
However, in our present work we also observe this ~0.2 ns com-ponent with emission band around 680 nm upon selective excitation of Chl a (Figs. 5 and 7), strongly suggesting that it originates from PSII. Tian et al. in [45] probed the picosecondfluorescence kinetics of the PSII complexes (with closed reaction centres) using the PAL (PBS-less) mutant of Synechocystis 6803. Similar kinetic components (~0.2 ns and ~1.0 ns) were resolved in their work and show that the PSII fluores-cence decay in cyanobacteria is inherently heterogenous (biphasic/ multiphasic) and is not the result of a mixed status of the reaction
Fig. 2. Fluorescence decay traces of Synechococcus cells at 680 nm obtained with various laser powers after 577 nm excitation (left) light-adapted cells (state I) and (right) dark-adapted cells (state II). Black, green and red traces correspond to cells without DCMU and the blue trace to DCMU-treated cells. All traces were normalized to each other at their maximum emission. Measurements were performed at room temperature.
Fig. 3. Normalized decay traces at 680 nm (PBS terminal emitter (APC680) and PSII) for dark-adapted (black lines) and light-adapted cells (blue lines) of (A)
centres (partially closed). However, upon PBS excitation, the presence of this particular ~0.2 ns decay component with its maximum emission at 680 nm is not readily observable in thefive component global ana-lysis of the time-resolvedfluorescence of light-adapted (state I) cells (Fig. 4). It overlaps with the ~0.17–0.2 ns DAS in state I (Fig. 4A) with a broad positive peak at ~655 nm and a depression around ~680 nm which is due to EET from phycocyanins and allophycocyanins to the photosystems. This makes it difficult to reliably separate them in our global analysis. The ~1.0 ns DAS with the maximum emission around ~680 nm is assigned to the PSII complexes with closed reaction centres and PBS terminal emitters (free and partially connected PBSs). From now on we will mainly discuss the ~0.17–0.2 ns and ~ 1.0 ns com-ponents with their emission maxima at ~680 nm and refer to them as the slow (~0.17–0.2 ns) and the slowest (~1.0 ns) component. The value of the lifetime of the slowest component is not extremely accurate and was found to be in the range of ~0.8–1.0 ns. Cells in state II had consistently slightly higher values for the slowest component (Fig. S2) as observed in [44].
Reconstructed steady-state fluorescence spectra of Synechococcus WT, ΔApcD and, ΔApcF mutants in Fig. 4show a ~35.8 ± 2.5%, 35.0 ± 0.1% and, 39.4 ± 4.9% decrease of PSIIfluorescence in state II, respectively. The ApcD and ApcF components are therefore con-cluded not to be required for the state transitions in Synechococcus, in agreement with the conclusions in [29].
Fig. 5presents the four DAS components for Synechococcus WT and theΔApcD and, ΔApcF mutants, obtained upon selective Chl a excita-tion at 430 nm. Due to the higher Chl a content in PSI, thefluorescence kinetics are dominated by the ~20 ps component (λ = 690 nm), re-presenting the kinetics of PSI excitation trapping. The fast component (~6–8 ps) with a broad positive peak around 680–690 nm corresponds
to excitation-energy equilibration in the bulk chlorophylls of PSI and PSII. The negative peaks in the same DAS around ~645 nm and above 700 nm indicate EET from the bulk Chls to the PBSs and to the lower-energy Chls, respectively.
Excitation at 430 nm is at the absorption maximum of Chl a, where only negligible absorption is due to PBSs [31]. Therefore, the slow component (~0.2 ns) with a band around 680 nm is assigned to the PSII complexes. Similar to the 577 nm excitation case (Fig. 4), reciprocal differences in amplitudes of the slow and the slowest components are observed for cells in state I and state II, both for the WT and mutant cells (Fig. 5A–C). The value of the slowest component upon 430 nm excitation was typically found between ~0.7 ns–1.0 ns. Reconstructed steady-state emission spectra for Synechococcus WT,ΔApcD, and ΔApcF (Fig. 5D–F) show a pronounced decrease of the room-temperature PSII fluorescence in state II, as was observed before at 77 K [29,31]. From the reconstructed steady-state fluorescence spectra, the fluorescence decrease in state II was found to be 39.6 ± 1.1%, 42.7 ± 1.2% and 47.3 ± 1.1% for Synechococcus WT,ΔApcD, and ΔApcF, respectively.
3.4. State transitions in Synechocystis WT,ΔApcD and ΔApcF
In this section, state transitions in Synechocystis WT and itsΔApcD and ΔApcF mutants are compared to those of Synechococcus as de-scribed above, regarding theirfluorescence properties. It turns out that the overall kinetics are rather similar for Synechococcus and Synechocystis.
Upon 577 nm excitation, state II is again characterized by a decrease in amplitude of the slowest component and a concomitant rise of the amplitude of the slow component (Fig. 6A). However, these char-acteristic changes are completely absent in Synechocystis ΔApcD
Fig. 4. Decay-associated spectra obtained from global fitting of time-resolved fluorescence results after 577 nm excitation. (A, B, C) five-components DAS of Synechococcus WT, SynechococcusΔApcD and Synechococcus ΔApcF, in state I (dotted lines) and state II (solid lines). DAS-associated lifetimes are presented in the insets with corresponding colours. In A and C the slowest lifetime isfixed to 1.0 ns. (D, E, F) reconstructed steady-state spectra for Synechococcus WT, Synechococcus ΔApcD and Synechococcus ΔApcF, respectively, in state I (dotted line) and state II (solid line). All spectra are scaled as described in Materials and Methods.
A.F. Bhatti, et al. BBA - Bioenergetics 1861 (2020) 148255
(Fig. 6B) and are largely diminished in SynechocystisΔApcF (Fig. 6C). The slowest component in the case of Synechocystis ΔApcD and Sy-nechocystisΔApcF has considerable emission at 650–660 nm, indicating that EET from the corresponding pigments is rather inefficient, possibly due to disconnection of some PBSs as was concluded for Synechocystis ΔapcF in [29].
InFig. 6D–F reconstructed steady-state emission spectra of dark-and light-adapted Synechocystis WT,ΔApcD and ΔApcF cells are presented. From the reconstructed steady-statefluorescence spectra, the fluores-cence decrease in state II was found to be 19.2 ± 1.0%,−3.3 ± 1.0% and 10.9 ± 2.9% for Synechocystis WT, ΔApcD, and ΔApcF, respec-tively. From a comparison of the time-resolved and reconstructed steady-state emission spectra of the Synechocystis WT and its ΔApcD mutant, it seems that theΔApcD cells are fixed in state I as was ob-served before [28]. The fluorescence ratio F660/F680 in the ΔApcD
mutant is higher as compared to the one observed for state I in WT cells, indicating that energy transfer from the PBSs to one or both photo-systems is less efficient. In the absence of PSII some loss of energy transfer to PSI was found at room temperature in Synechocystis 6803 ΔApcD [28]. However, in [29] it was indicated that the absence of ΔApcD does not affect the energy transfer from PBSs to the photo-systems in Synechocystis 6803.
The higher F660/F680ratio in theΔApcF mutant signifies inefficient
EET from high-energy pigments in the PBSs to either low-energy pig-ments in the PBSs or the photosystems. ApcF has been found essential for energy transfer to both photosystems in Synechocystis [28,29]. Due to the inefficient EET to the photosystems in Synechocystis ΔApcF, the slowest component inFig. 6C might contain a considerable contribution from the PBS terminal emitters. The diminished characteristic
fluorescence changes in the dark-and light-adapted Synechocystis ΔApcF cells as compared to WT cells are concluded to be due to less efficient EET from the PBS core to either PSII or to both photosystems.
Upon 430 nm excitation, the resulting four DAS components for Synechocystis WT,ΔApcD and ΔApcF are shown inFig. 7A–C and the reconstructed steady-statefluorescence spectra inFig. 7D–F. From the reconstructed steady-state fluorescence spectra, the fluorescence de-crease in state II was found to be 20.9 ± 1.6%, 9.4 ± 1.1% and 12.7 ± 3.9% for Synechocystis WT,ΔApcD, and ΔApcF, respectively. Thefluorescence changes, characteristic for state transitions are ob-servable both for WT and mutant cells but they are far less outspoken than for Synechococcus. However, for mutant cells (especially for ΔApcD) the differences are smaller than for WT cells.
4. Discussion
In this work we applied time-resolvedfluorescence spectroscopy to study state transitions in the cyanobacteria Synechococcus sp. PCC 7942, Synechocystis sp. PCC 6803 and theirΔApcD and ΔApcF mutants at room temperature. The most important observation is the decrease in amplitude of the slowest decay component of ~1 ns with a peak around 680 nm in state II, and the concomitant increase of the amplitude of the ~0.2-ns component, upon Chl a excitation. This implies that there is a significant shortening of the average lifetime of the PSII fluorescence, which corresponds to a decrease of PSII fluorescence in the (re-constructed) steady-state spectra. Such an increase of the ~0.2 ns component was also observed in an earlier study performed at room temperature but in that case Chl a excitation was not selective and the increase was ascribed to PBSfluorescence [44]. However, when we
Fig. 5. Decay-associated spectra (DAS) obtained from globalfitting of time-resolved fluorescence results upon 430 nm excitation. (A, B, C) four-components DAS of Synechococcus WT, SynechococcusΔApcD and Synechococcus ΔApcF, respectively in state I (dotted lines) and state II (solid lines). The slowest lifetime in each case was fixed to 1.0 ns. The ~20 ps DAS in each case is multiplied with 0.5 to make the two slowest DAS better visible. DAS-associated lifetimes are shown in the legend with corresponding colours. (D, E, F) reconstructed steady-state spectra for Synechococcus WT, SynechococcusΔApcD and Synechococcus ΔApcF, respectively in state I (dotted line) and state II (solid line). All spectra are scaled as described in Materials and Methods.
selectively excite PBSs we observe a similar increase of the ~0.2 ns component as observed for selective Chl a excitation. Therefore, in agreement with the 77 K results reported in [31], we conclude that reversible quenching of PSII is the main mechanism to balance the photochemistry of the two photosystems during state transitions. This quenching mechanism is apparently not affected by a change from room temperature to 77 K.
In the case of PBS excitation, the decrease of PSIIfluorescence in state II (Figs. 4 and 6) can in principle be due to (i) a decrease of the absorption cross-section/functional antenna size of PSII and/or (ii) quenching of (a fraction of) of the PSII complexes. A decrease of the absorption cross-section/functional antenna size of PSII in state II was ascribed earlier to migration of PBSs from PSII to PSI in the mobile antenna model [15–18]. The spillover model [20,50–52] on the other hand, ascribed quenching of PSII in state II to EET to PSI, whereas also a combination of both models was proposed [20,25]. All these models predict an increase of EET to PSI in state II at the expense of excitations in PSII. In principle this should lead to an increase of PSIfluorescence in state II. At room temperature such an increase in PSIfluorescence might be difficult to observe due to the relatively slow EET from PBS to PSI (~0.15–0.17 ns) followed by fast excitation trapping in PSI (~20 ps). However, also at 77 K where the PSIfluorescence kinetics is far slower (~1.0 ns) no increase could be observed for state II, both for wild-type Synechococcus and Synechocystis [7,31]. Therefore, Ranjbar Choubeh et al. concluded that neither migration of PBSs from PSII to PSI, nor spillover of excitation energy from PSII to PSI is involved in the tran-sition from state I to state II andfluorescence changes were ascribed to reversible direct quenching of the PSII core [31]. In our room-tem-perature measurements on WT cells upon PBS excitation afluorescence decrease of 35.8 ± 2.5% and 19.2 ± 1.0% in state II was observed, for S. elongatus and Synechocystis, respectively. Upon Chl a excitation,
the decrease in PSIIfluorescence was 39.6 ± 1.1% for S. elongatus and 20.9 ± 1.6% for Synechocystis. The similar decrease in the amount of PSIIfluorescence in state II, both upon PBS and Chl a excitation, sup-ports the conclusion in [31] that the PSII core is partially quenched. Although such a difference is also observed for dark-and light-adapted SynechocystisΔApcD (Fig. 7(B, E)) upon Chl a excitation at 430 nm, albeit to a lesser extent, it is totally absent upon PBS excitation at 577 nm (Fig. 6(B, E)). This observation may cast some doubt on the implicit conclusion in [31] that PBSs play no role in state II. Instead PBSs might show reduced EET to PSII in state II in WT cells, either by disconnecting from PSII or by quenching excitations. This role appears to be disabled with the deletion of ApcD in Synechocystis. The disabled role of PBSs alone, however, does not explain why PBS-absorbed energy is not quenched at the PSII core after PBS excitation as is the case for Chl a absorbed excitations in this mutant. A solution to this problem was suggested by McConnell et al. [20]. They proposed that small scale membrane changes in state II bring PSII and PSI closer together, such that the rate of excitation transfer from PBSs (shared by both photo-systems) to PSI increases, whereas also spillover of excitation energy from PSII to PSI occurs. At the same time it was proposed that the PBS-absorbed excitations are transferred directly to the PSII reaction centres and cannot spill over to PSI via CP43 and CP47 antennas, whereas excitations created in CP43 or CP47 upon Chl a excitation can spill over to PSI.
However, the proposal of McConnell et al. cannot explain our data. The excited-state lifetime of the PSII core with closed RCs is of the order of 1 ns and there is plenty of time for excitations to equilibrate over the entire core, irrespective whether they originate from the PBSs or from the core itself. Therefore, if the core would be quenched due to spillover this should also be observed after PBS excitation, followed by transfer to the PSII core. We therefore believe that a more likely explanation is
Fig. 6. (A, B, C)five-components DAS of Synechocystis WT, Synechocystis ΔApcD and Synechocystis ΔApcF, respectively in state I (dotted lines) and state II (solid lines). DAS-associated lifetimes are presented at the top with corresponding colours. In A and B the slowest lifetime wasfixed to 1.0 ns. (D, E, F) reconstructed steady-state spectra for Synechococcus WT, SynechococcusΔApcD and Synechococcus ΔApcF, respectively in state I (dotted lines) and state II (solid lines). Excitation was at 577 nm.
A.F. Bhatti, et al. BBA - Bioenergetics 1861 (2020) 148255
that PSII is directly quenched in state II leading to less PSIIfluorescence while in the absence of ApcD EET from the PBS to PSII is less efficient and therefore leads to more PBSfluorescence, thereby compensating for the loss of PSIIfluorescence.
4.1. Possible mechanisms of PSII quenching in state II
Because the PSII core is a delicate piece of equipment that can easily be damaged in case of overexcitation, oxygenic photosynthetic organ-isms have developed photoprotective mechanorgan-isms that lead to excita-tion quenching such that excess excitaexcita-tions are safely dissipated as heat. A well-known example is the occurrence of non-photochemical quenching in e.g. plants, green algae, cyanobacteria and diatoms, where the organisms can rapidly switch on and off antenna quenching mechanisms that protect PSII from overexcitation [53]. In many cases this requires the involvement of carotenoids in the outer antenna system that function as excitation quenchers in NPQ conditions (see e.g. [54–56]). This heat dissipation occurs very rapidly (< 1 ns after ex-citation) and with the use of optoacoustic experiment extra heat dis-sipation was indeed observed for thylakoid membranes in NPQ condi-tions within 1.4μs after excitation with a laser flash [57].
On the other hand, quenching can also occur in the PSII RC. This has been suggested as an effective protective mechanism against photo-damage in several cyanobacteria [58,59] and other organisms [60,61]. Also in a number of studies on desiccated lichens it was concluded that (auxiliary) quenching occurs within the PSII reaction centre [62–66] and this mechanism was recently also proposed for the desert cyano-bacterium Leptolyngbya ohadii [67]. The underlying molecular me-chanism of RC quenching might be due to radiationless charge re-combination in the RC, a process that can occur on a time scale of hundreds of microseconds or longer [57]. Such a mechanism might also
be responsible for the PSII quenching in state II, rather than energy dissipation via one of the carotenoids in the PSII core. Such an ex-planation might be supported by the fact that independent optoacoustic studies of state transitions in the cyanobacteria Synechococcus 6301 [68,69] were not able to detect extra heat release in state II within 1.4–2.0 μs after excitation. However, we cannot rule out that other mechanisms might be responsible, for instance the formation of quenchers in CP43 or CP47.
5. Conclusions
In this work we show that at physiological relevant temperatures the average excited-state lifetime of PSII in state II becomes shorter as compared to state I due to partial quenching of the PSII excitations, balancing the photochemistry of the two photosystems. This was pro-posed before based onfluorescence measurements at 77 K but now we obtained for thefirst time room-temperature picosecond fluorescence data that are fully consistent with that proposal for Synechocystis and Synechococcus, WT,ΔApcD and ΔApcF strains. One possible explanation for this quenching might be radiationless charge recombination in the RC of PSII in state II but we can certainly not rule out other quenching mechanisms, for instance in CP43 or CP47. SynechocystisΔApcD spectra in state I and II differ upon Chl a excitation but show hardly any dif-ference upon PBS excitation. We demonstrate that an earlier model [20] is insufficient to explain the phenomenon and we provide an alternative explanation.
Declaration of competing interest
The authors declare that they have no known competingfinancial interests or personal relationships that could have appeared to
Fig. 7. (A, B, C) four-components DAS of Synechocystis WT, SynechocystisΔApcD and Synechocystis ΔApcF, respectively in state I (dotted lines) and state II (solid lines). The 20 ps DAS in each case is multiplied by 0.5 to make the two slowest DAS better visible. DAS-associated lifetimes are presented at the top with corre-sponding colours. In Figure C the lifetime of the slowest component was fixed to 1.0 ns. (D, E, F) reconstructed steady-state spectra for Synechococcus WT, SynechococcusΔApcD and Synechococcus ΔApcF, respectively in state I (dotted lines) and state II (solid lines).
influence the work reported in this paper. Acknowledgements
This work was supported by grants from the European Union's Horizon 2020 research and innovation program under grant agreement no. 675006 (SE2B) and the NWO Vidi grant (Vi.Vidi.192.042). We thank Dr. Arjen Bader for technical support.
Appendix A. Supplementary data
Supplementary data to this article can be found online athttps:// doi.org/10.1016/j.bbabio.2020.148255.
References
[1] R. Croce, et al., Light Harvesting in Photosynthesis, CRC Press, Boca Raton, FL, 2018.
[2] R. Croce, H. van Amerongen, Natural strategies for photosynthetic light harvesting, Nat. Chem. Biol. 10 (2014) 492.
[3] P. Horton, A.A.V. Ruban, R.G. Walters, Regulation of light harvesting in green plants, Annu. Rev. Plant Physiol. Plant Mol. Biol. 47 (1) (1996) 655–684. [4] R.K. Clayton, Biophysical problems of photosyntheis, Science (1965) 1346–1354. [5] K. Satoh, D.C. Fork, The relationship between state II to state I transitions and cyclic
electronflow around photosystem I, Photosynth. Res. 4 (1) (1983) 245–256. [6] C.W. Mullineaux, J.F. Allen, State 1-state 2 transitions in the cyanobacterium
Synechococcus 6301 are controlled by the redox state of electron carriers between photosystems I and II, Photosynth. Res. 23 (3) (1990) 297–311.
[7] V. Chukhutsina, et al., Cyanobacterial light-harvesting phycobilisomes uncouple from photosystem I during dark-to-light transitions, Sci. Rep. 5 (2015) 14193. [8] N. Murata, Control of excitation transfer in photosynthesis I. Light-induced change
of chlorophyll afluoresence in Porphyridium cruentum, Biochim. Biophys. Acta Bioenerg. 172 (2) (1969) 242–251.
[9] C. Bonaventura, J. Myers, Fluorescence and oxygen evolution from Chlorella pyr-enoidosa, Biochim. Biophys. Acta Bioenerg. 189 (3) (1969) 366–383.
[10] C.W. Mullineaux, D. Emlyn-Jones, State transitions: an example of acclimation to low-light stress, J. Exp. Bot. 56 (411) (2004) 389–393.
[11] C.W. Mullineaux, Excitation energy transfer from phycobilisomes to photosystem I in a cyanobacterium, Biochim. Biophys. Acta Bioenerg. 1100 (3) (1992) 285–292. [12] L.A. Staehelin, C.J. Arntzen, Regulation of chloroplast membrane function: protein phosphorylation changes the spatial organization of membrane components, J. Cell Biol. 97 (5 Pt 1) (1983) 1327–1337.
[13] J.F. Allen, et al., Chloroplast protein phosphorylation couples plastoquinone redox state to distribution of excitation energy between photosystems, Nature 291 (5810) (1981) 25–29.
[14] E. Wientjes, H. van Amerongen, R. Croce, LHCII is an antenna of both photosystems after long-term acclimation, Biochim. Biophys. Acta Bioenerg. 1827 (3) (2013) 420–426.
[15] J.F. Allen, C.E. Sanders, N.G. Holmes, Correlation of membrane protein phos-phorylation with excitation energy distribution in the cyanobacterium Synechococcus 6301, FEBS Lett. 193 (2) (1985) 271–275.
[16] C.W. Mullineaux, J.F. Allen, Fluorescence induction transients indicate dissociation of photosystem II from the phycobilisome during the State-2 transition in the cy-anobacterium Synechococcus 6301, Biochim. Biophys. Acta Bioenerg. 934 (1) (1988) 96–107.
[17] E. Sanders, C., J. Allen, The 18.5 kDa Phosphoprotein of the Cyanobacterium Synechococcus 6301: A Component of the Phycobilisome, (1987), pp. 761–764. [18] J.F. Allen, N.G. Holmes, A general model for regulation of photosynthetic unit
function by protein phosphorylation, FEBS Lett. 202 (2) (1986) 175–181. [19] C.W. Mullineaux, M.J. Tobin, G.R. Jones, Mobility of photosynthetic complexes in
thylakoid membranes, Nature 390 (6658) (1997) 421–424.
[20] M.D. McConnell, et al., Regulation of the distribution of chlorophyll and phycobilin-absorbed excitation energy in cyanobacteria. A structure-based model for the light state transition, Plant Physiol. 130 (3) (2002) 1201–1212.
[21] D. Bruce, et al., Mechanism of the light state transition in photosynthesis. IV. Picosecondfluorescence spectroscopy of Anacystis nidulans and Porphyridium cruentum in state 1 and state 2 at 77 K, Biochim. Biophys. Acta Bioenerg. 806 (2) (1985) 237–246.
[22] J. Olive, et al., Ultrastructure and light adaptation of phycobilisome mutants of Synechocystis PCC 6803, Biochim. Biophys. Acta Bioenerg. 1319 (2) (1997) 275–282.
[23] J. Olive, et al., Randomization of the EF particles in thylakoid membranes of sy-nechocystis 6714 upon transition from state I to state II, FEBS Lett. 208 (2) (1986) 308–312.
[24] H. Liu, et al., Phycobilisomes supply excitations to both photosystems in a mega-complex in cyanobacteria, Science 342 (6162) (2013) 1104–1107 (New York, N.Y.). [25] M. Koblizek, J. Komenda, J. Masojídek, State Transitions in the Cyanobacterium
Synechococcus PCC 7942. Mobile Antenna or Spillover? (1998), pp. 213–216. [26] C. Dong, J. Zhao, ApcD is Required for State Transition but not Involved in
Blue-light Induced Quenching in the Cyanobacterium Anabaena sp. PCC7120, vol. 53, (2008), pp. 3422–3424.
[27] C. Dong, et al., ApcD is necessary for efficient energy transfer from phycobilisomes to photosystem I and helps to prevent photoinhibition in the cyanobacterium Synechococcus sp. PCC 7002, Biochim. Biophys. Acta Bioenerg. 1787 (9) (2009) 1122–1128.
[28] M.K. Ashby, C.W. Mullineaux, The role of ApcD and ApcF in energy transfer from phycobilisomes to PS I and PS II in a cyanobacterium, Photosynth. Res. 61 (2) (1999) 169–179.
[29] P.I. Calzadilla, et al., Different roles for ApcD and ApcF in Synechococcus elongatus and Synechocystis sp. PCC 6803 phycobilisomes, Biochim. Biophys. Acta Bioenerg. 1860 (6) (2019) 488–498.
[30] D. Emlyn-Jones, M.K. Ashby, C.W. Mullineaux, A gene required for the regulation of photosynthetic light harvesting in the cyanobacterium Synechocystis 6803, Mol. Microbiol. 33 (5) (1999) 1050–1058.
[31] R. Ranjbar Choubeh, et al., State transitions in the cyanobacterium Synechococcus elongatus 7942 involve reversible quenching of the photosystem II core, Biochim. Biophys. Acta Bioenerg. 1859 (10) (2018) 1059–1066.
[32] N. Adir, Elucidation of the molecular structures of components of the phycobili-some: reconstructing a giant, Photosynth. Res. 85 (1) (2005) 15–32.
[33] A.N. Glazer, et al., The structure of a simple phycobilisome, Annales de l'Institut Pasteur/Microbiologie 134 (1, Supplement B) (1983) 159–180.
[34] A.A. Arteni, G. Ajlani, E.J. Boekema, Structural organisation of phycobilisomes from Synechocystis sp. strain PCC6803 and their interaction with the membrane, Biochim. Biophys. Acta Bioenerg. 1787 (4) (2009) 272–279.
[35] D. Jallet, M. Gwizdala, D. Kirilovsky, ApcD, ApcF and ApcE are not required for the Orange carotenoid protein related phycobilisomefluorescence quenching in the cyanobacterium Synechocystis PCC 6803, Biochim. Biophys. Acta Bioenerg. 1817 (8) (2012) 1418–1427.
[36] G. Ajlani, et al., Phycobilisome core mutants of Synechocystis PCC 6803, Biochim. Biophys. Acta Bioenerg. 1231 (2) (1995) 189–196.
[37] V. Capuano, et al., The“anchor polypeptide” of cyanobacterial phycobilisomes. Molecular characterization of the Synechococcus sp. PCC 6301 apce gene, J. Biol. Chem. 266 (11) (1991) 7239–7247.
[38] I.H.M. Van Stokkum, et al., (Sub)-picosecond spectral evolution offluorescence studied with a synchroscan streak-camera system and target analysis, in: T.J. Aartsma, J. Matysik (Eds.), Biophysical Techniques in Photosynthesis, Springer Netherlands, Dordrecht, 2008, pp. 223–240.
[39] J. Snellenburg .J.et al., Glotaran: A Java-based graphical user interface for the R package TIMP, J. Stat. Softw. 49 (3) (2012).
[40] I. Van Stokkum, K.M. Mullen, TIMP: An R Package for Modeling Multi-way Spectroscopic Measurements, (2007).
[41] D. Kirilovsky, Modulating energy arriving at photochemical reaction centers: Orange carotenoid protein-related photoprotection and state transitions, Photosynth. Res. 126 (2014).
[42] P.I. Calzadilla, D. Kirilovsky, Revisiting cyanobacterial state transitions, Photochem. Photobiol. Sci. 19 (5) (2020) 585–603.
[43] P.I. Calzadilla, et al., The cytochrome b (6) f complex is not involved in cyano-bacterial state transitions, Plant Cell 31 (4) (2019) 911–931.
[44] C.W. Mullineaux, et al., Picosecond time-resolvedfluorescence emission spectra indicate decreased energy transfer from the phycobilisome to photosystem II in light-state 2 in the cyanobacterium Synechococcus 6301, Biochim. Biophys. Acta Bioenerg. 1015 (2) (1990) 231–242.
[45] L. Tian, S. Farooq, H. Van Amerongen, Probing the picosecond kinetics of the photosystem II core complex in vivo, Phys. Chem. Chem. Phys. 15 (2013). [46] J.J. Van Thor, et al., Light Harvesting and State Transitions in Cyanobacteria,
Botanica Acta 111 (6) (1998) 430–443.
[47] A.M. Acuña, et al., Resolving the contribution of the uncoupled phycobilisomes to cyanobacterial pulse-amplitude modulated (PAM)fluorometry signals, Photosynth. Res. 127 (1) (2016) 91–102.
[48] L. Tian, et al., Picosecond kinetics of light harvesting and photoprotective quenching in wild-type and mutant phycobilisomes isolated from the cyano-bacterium Synechocystis PCC 6803, Biophys. J. 102 (7) (2012) 1692–1700. [49] L. Tian, et al., Site, rate, and mechanism of Photoprotective quenching in
cyano-bacteria, J. Am. Chem. Soc. 133 (45) (2011) 18304–18311.
[50] J. Biggins, D. Bruce, Regulation of excitation energy transfer in organisms con-taining phycobilins, Photosynth. Res. 20 (1) (1989) 1–34.
[51] D. Bruce, S. Brimble, D.A. Bryant, State transitions in a phycobilisome-less mutant of the cyanobacterium Synechococcus sp. PCC 7002, Biochim. Biophys. Acta Bioenerg. 974 (1) (1989) 66–73.
[52] O. Salehian, D. Bruce, Distribution of excitation energy in photosynthesis: quanti-fication of fluorescence yields from intact cyanobacteria, J. Lumin. 51 (1) (1992) 91–98.
[53] A.V. Ruban, Nonphotochemical chlorophyllfluorescence quenching: mechanism and effectiveness in protecting plants from Photodamage, Plant Physiol. 170 (4) (2016) 1903–1916.
[54] A.V. Ruban, et al., Identification of a mechanism of photoprotective energy dis-sipation in higher plants, Nature 450 (7169) (2007) 575–578.
[55] N.E. Holt, et al., Carotenoid Cation formation and the regulation of photosynthetic light harvesting, Science 307 (5708) (2005) 433.
[56] V. Mascoli, et al., Capturing the quenching mechanism of light-harvesting com-plexes of plants by zooming in on the ensemble, Chem 5 (11) (2019) 2900–2912. [57] C.W. Mullineaux, A.V. Ruban, P. Horton, Prompt heat release associated with ΔpH-dependent quenching in spinach thylakoid membranes, Biochim. Biophys. Acta Bioenerg. 1185 (1) (1994) 119–123.
[58] P. Sane, et al., A transient exchange of the photosystem II reaction center protein D1:1 with D1:2 during low temperature stress ofSynechococcus sp. PCC 7942 in the light lowers the redox potential of QB, J. Biol. Chem. 277 (2002) 32739–32745.
A.F. Bhatti, et al. BBA - Bioenergetics 1861 (2020) 148255
[59] K. Cser, I. Vass, Radiative and non-radiative charge recombination pathways in photosystem II studied by thermoluminescence and chlorophyllfluorescence in the cyanobacterium Synechocystis 6803, Biochim. Biophys. Acta Bioenerg. 1767 (3) (2007) 233–243.
[60] A.G. Ivanov, et al., Low-temperature modulation of the redox properties of the acceptor side of photosystem II: photoprotection through reaction Centre quenching of excess energy, Physiol. Plant. 119 (3) (2003) 376–383.
[61] A.G. Ivanov, et al., Photosystem II reaction Centre quenching: mechanisms and physiological role, Photosynth. Res. 98 (1) (2008) 565.
[62] U. Heber, Photoprotection of green plants: a mechanism of ultra-fast thermal energy dissipation in desiccated lichens, Planta 228 (4) (2008) 641–650.
[63] U. Heber, W. Bilger, V.A. Shuvalov, Thermal energy dissipation in reaction centres and in the antenna of photosystem II protects desiccated poikilohydric mosses against photo-oxidation, J. Exp. Bot. 57 (12) (2006) 2993–3006.
[64] U. Heber, O.L. Lange, V.A. Shuvalov, Conservation and dissipation of light energy as complementary processes: homoiohydric and poikilohydric autotrophs, J. Exp. Bot.
57 (6) (2006) 1211–1223.
[65] U. Heber, M. Azarkovich, V. Shuvalov, Activation of mechanisms of photoprotec-tion by desiccaphotoprotec-tion and by light: poikilohydric photoautotrophs*, J. Exp. Bot. 58 (11) (2007) 2745–2759.
[66] U. Heber, V. Soni, R.J. Strasser, Photoprotection of reaction centers: thermal dis-sipation of absorbed light energy vs charge separation in lichens‡, Physiol. Plant. 142 (1) (2011) 65–78.
[67] R. Ranjbar Choubeh, et al., Photosystem II core quenching in desiccated Leptolyngbya ohadii, Photosynth. Res. 143 (1) (2020) 13–18.
[68] C.W. Mullineaux, S. Griebenow, S.E. Braslavsky, Photosynthetic energy storage in cyanobacterial cells adapted to light-states 1 and 2. A laser-induced optoacoustic study, Biochim. Biophys. Acta Bioenerg. 1060 (3) (1991) 315–318.
[69] D. Bruce, O. Salehian, Laser-induced optoacoustic calorimetry of cyanobacteria. The efficiency of primary photosynthetic processes in state 1 and state 2, Biochim. Biophys. Acta Bioenerg. 1100 (3) (1992) 242–250.