HAL Id: hal-00295683
https://hal.archives-ouvertes.fr/hal-00295683
Submitted on 24 Jun 2005
HAL is a multi-disciplinary open access
archive for the deposit and dissemination of
sci-entific research documents, whether they are
pub-lished or not. The documents may come from
teaching and research institutions in France or
abroad, or from public or private research centers.
L’archive ouverte pluridisciplinaire HAL, est
destinée au dépôt et à la diffusion de documents
scientifiques de niveau recherche, publiés ou non,
émanant des établissements d’enseignement et de
recherche français ou étrangers, des laboratoires
publics ou privés.
chlorine burden: in situ balloon measurements and
model simulations
B. Vogel, R. Müller, A. Engel, J.-U. Grooß, D. Toohey, T. Woyke, F. Stroh
To cite this version:
B. Vogel, R. Müller, A. Engel, J.-U. Grooß, D. Toohey, et al.. Midlatitude ClO during the maximum
atmospheric chlorine burden: in situ balloon measurements and model simulations. Atmospheric
Chemistry and Physics, European Geosciences Union, 2005, 5 (6), pp.1623-1638. �hal-00295683�
www.atmos-chem-phys.org/acp/5/1623/ SRef-ID: 1680-7324/acp/2005-5-1623 European Geosciences Union
Chemistry
and Physics
Midlatitude ClO during the maximum atmospheric chlorine
burden: in situ balloon measurements and model simulations
B. Vogel1, R. M ¨uller1, A. Engel2, J.-U. Grooß1, D. Toohey3, T. Woyke4, and F. Stroh1
1Research Center J¨ulich, Institute for Stratospheric Research (ICG-I), J¨ulich, Germany 2University of Frankfurt, Institute for Meteorology, Frankfurt, Germany
3University of Colorado, Boulder, CO, USA 4Etas GmbH, Stuttgart, Germany
Received: 27 January 2005 – Published in Atmos. Chem. Phys. Discuss.: 17 February 2005 Revised: 1 June 2005 – Accepted: 1 June 2005 – Published: 24 June 2005
Abstract. Chlorine monoxide (ClO) plays a key role in
stratospheric ozone loss processes at midlatitudes. We present two balloon-borne in situ measurements of ClO con-ducted in northern hemisphere midlatitudes during the per-iod of the maximum of total inorganic chlorine loading in the atmosphere. Both ClO measurements were conducted on board the TRIPLE balloon payload, launched in November 1996 in Le´on, Spain, and in May 1999 in Aire sur l’Adour, France. For both flights a ClO daylight and night-time ver-tical profile was derived over an altitude range of approxi-mately 15–35 km. ClO mixing ratios are compared to model simulations performed with the photochemical box model version of the Chemical Lagrangian Model of the Strato-sphere (CLaMS). Simulations along 24-hour backward tra-jectories were performed to study the diurnal variation of ClO in the midlatitude lower stratosphere. Model simula-tions for the flight launched in Aire sur l’Adour 1999 show an excellent agreement with the ClO measurements. For the flight launched in Le´on 1996, an overall good agreement is found, whereas the flight is characterized by a more com-plex dynamical situation due to a possible mixture of vor-tex and non-vorvor-tex air. We note that for both flights at solar zenith angles greater than 86◦–87◦simulated ClO mixing ra-tios are higher than observed ClO mixing rara-tios. However, the present findings indicate that no substantial uncertainties exist in midlatitude chlorine chemistry of the stratosphere.
Correspondence to: B. Vogel
1 Introduction
Stratospheric ozone has globally decreased over the last ≈25 years. In midlatitudes, the vertical, latitudinal, and seasonal characteristics of changes in ozone are broadly consistent with the understanding that halogens are the primary cause of these changes (WMO, 2003). A downward ozone trend of −1 to −3% per decade is estimated for the lower strato-sphere in the northern and southern hemistrato-sphere midlatitudes for the time period between 1979 and 2000 (Wang et al., 2002; WMO, 2003). Furthermore, it was found that the large ozone depletions determined for the Arctic vortex in sev-eral previous winters will ultimately spread out and dilute ozone concentrations at midlatitudes thereby contributing to the observed ozone decrease at midlatitudes (e.g., Chipper-field, 1999; Knudsen and Grooß, 2000; Marchand et al., 2004). The catalytic loss of ozone in the lower stratosphere is controlled by a combination of cycles involving reactions with BrO, ClO, HO2, and NO2(e.g., Wennberg et al., 1994;
Stimpfle et al., 1994). Thus a prerequisite for a reliable cal-culation of halogen-induced ozone loss rates at midlatitudes is information about ClO concentrations at midlatitudes and an understanding of the dependence of ClO concentrations on altitude and time of day.
Nonetheless, measurements of ClO at midlatitudes in the lower stratosphere are rare. Early balloon-borne in situ (e.g., Anderson et al., 1977; Anderson, 1978; Anderson et al., 1980) and remote (Menzies, 1979) measurements of ClO were made in the late 1970s and 1980s all launched from Palestine (32◦N), Texas. In the 1990s, balloon-borne in situ measurements (e.g., Toohey et al., 1993a) and remote measurements (e.g., Osterman et al., 1997) of ClO were obtained at somewhat higher latitudes (launched from Fort Sumner (34.5◦N), New Mexico). In situ measurements of ClO conducted on board the ER-2 aircraft cover a greater
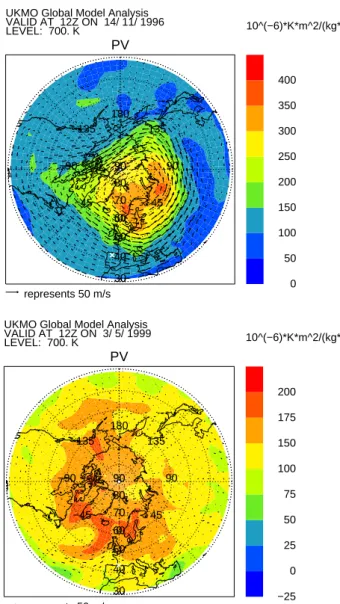
PV −135 −90 −45 0 45 90 135 180 30 40 50 60 70 80 90 UKMO Global Model Analysis VALID AT 12Z ON 14/ 11/ 1996 LEVEL: 700. K −135 −90 −45 0 45 90 135 180 30 40 50 60 70 80 90 0 50 100 150 200 250 300 350 400 10^(−6)*K*m^2/(kg*s) represents 50 m/s PV −135 −90 −45 0 45 90 135 180 30 40 50 60 70 80 90 UKMO Global Model Analysis VALID AT 12Z ON 3/ 5/ 1999 LEVEL: 700. K −135 −90 −45 0 45 90 135 180 30 40 50 60 70 80 90 −25 0 25 50 75 100 150 175 200 10^(−6)*K*m^2/(kg*s) represents 50 m/s
Fig. 1. Potential vorticity (1 PVU=10−6K m2kg−1s−1) on 14 November 1996 (top panel) and on 3 May 1999 (bottom panel), 12.00 UT on the 700 K isentropic level derived from data of the UK Met Office (UKMO) analyses. The wind direction is marked by ar-rows whose length is proportional to horizontal wind velocity. The location where the balloon was launched (Le´on, Spain (top panel), and Aire sur l’Adour, France (bottom panel)) is marked by a white cross.
range of the midlatitudes (e.g., Stimpfle et al., 1999; Toohey et al., 1991; King et al., 1991; Toohey et al., 1993b), but only a rather small altitude range of ≈16–20 km. Global or near global measurements of ClO are available from the Microwave Limb Sounder (MLS) aboard the Upper Atmo-sphere Research Satellite (UARS) (e.g., Ricaud et al., 2000) and the Millimeter-wave Atmospheric Sounder (MAS) from three space shuttle missions in 1992, 1993, and 1994 (e.g., Feist et al., 2000). The analysis of ClO measurements from the recently launched MIPAS-E and ODIN instruments has
focussed on the polar regions so far (e.g., Glatthor et al., 2004; Urban et al., 2004). In summary, at midlatitudes (≈35◦N–60◦N), in situ as well as remote measurements of ClO over the entire altitude range of the lower stratosphere (≈15–30 km) are very sparse.
As a result of the Montreal Protocol and its amendments and adjustments, in 1997–1998 the total inorganic chlorine stopped increasing in the troposphere and has remained fairly constant since that time. That is to say the loading of in-organic chlorine Clyin the unperturbed stratosphere has
re-cently stabilized (WMO, 2003). Here we present the only two balloon-borne in situ measurements of ClO performed in the lower stratosphere at midlatitudes during the period of the maximum of total inorganic chlorine loading in the atmo-sphere. Furthermore, after the eruption of Mount Pinatubo (June 1991) and the dissipation of the post-Pinatubo aerosol the aerosol levels were low from 1996 to 1999 (e.g., Bauman et al., 2003) with simultaneously the maximum atmospheric chlorine burden. The two ClO in situ measurements were conducted on board the TRIPLE balloon payload launched in November 1996 in Le´on (42.3◦N), Spain, and in May 1999 in Aire sur l’Adour (43.7◦N), France. Both flights were op-timized in such a way that both a vertical ClO daylight and night-time profile could be measured over an altitude range of approximately 15–35 km.
Further, photochemical model studies were performed us-ing the box model version of the Chemical Lagrangian Model of the Stratosphere (CLaMS) (McKenna et al., 2002a,b) to test whether model simulations can reproduce the diurnal behavior of ClO at midlatitudes over the entire range of the lower stratosphere. In previous photochemical model studies for midlatitude conditions based on ER-2 mea-surements, the ClO photochemistry was described correctly by the models (e.g., Brune et al., 1990; Salawitch et al., 1994; Stimpfle et al., 1994). However, discrepancies in the under-standing of the chlorine budget remained unresolved at that time (e.g., Stimpfle et al., 1994). In a more recent study, Sen et al. (1999) obtained a good understanding of the budget of stratospheric chlorine using ballon-borne measurements and found that the partitioning of inorganic chlorine is accurately described by photochemical models employing reaction rates recommended by DeMore et al. (1997). In a model study based on balloon-borne in situ measurements of ClO (Aval-lone et al., 1993), observed ClO was greater by as much as a factor of four below 20 km altitude. Studies on the broad-band photolysis of ClONO2led to the speculation that there
is a pressure dependence of the ClONO2quantum yield
be-yond 300 nm (Nickolaisen et al., 1996), but first in situ mea-surements of ClONO2on board the ER-2 aircraft during the
northern high-latitude summer found no evidence in support of a pressure-dependent quantum yield for photodissociation of ClONO2(Stimpfle et al., 1999). Further, no evidence was
found from these ER-2 measurements in support of missing inorganic chlorine species that would constitute a significant fraction of Cly(Bonne et al., 2000).
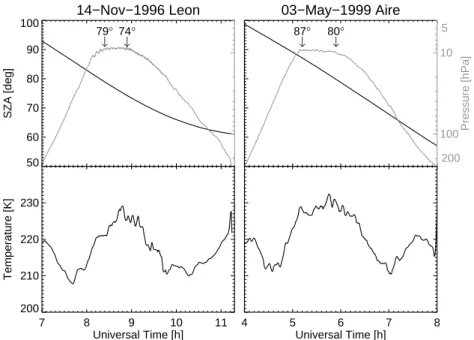
14−Nov−1996 Leon 50 60 70 80 90 100 SZA [deg] 79° ↓ 74↓° 7 8 9 10 11 Universal Time [h] 200 210 220 230 Temperature [K] 03−May−1999 Aire 87° ↓ 80↓° 100 10 Pressure [hPa] 200 5 4 5 6 7 8 Universal Time [h]
Fig. 2. Meteorological parameters for the flights of the TRIPLE payload on 14 November 1996 (left) and on 3 May 1999 (right) as a function of UT time. Top panel: pressure (gray line) and solar zenith angle (SZA) (black line). Beginning and end of the float is marked by arrows; the corresponding solar zenith angles are also noted. Bottom panel: temperature (black line).
2 Observations
The ClO measurements were conducted on board the balloon-borne multi-instrument payload TRIPLE launched on 14 November 1996 from Le´on (42.3◦N, 5.4◦W), Spain, and on 3 May 1999 from the French launching base in Aire sur l’Adour (43.7◦N, 0.3◦W), France (in the following re-ferred to as Le´on and Aire flights). TRIPLE consists of the J¨ulich ClO/BrO in situ instrument (Vogel et al., 2003), the cryogenic whole air sampler of the University of Frankfurt (Schmidt et al., 1987) for the observation of long-lived trac-ers and various CFCs, from which the amount of total in-organic chlorine, Cly, can be inferred (Schmidt et al., 1994;
Engel et al., 1997), and the J¨ulich Fast In Situ Stratospheric Hygrometer (FISH) (Schiller et al., 2002).
On 14 November 1996, a prototype of the J¨ulich ClO/BrO in situ instrument (Pierson et al., 1999; Woyke et al., 1999) was flown, whereas on 3 May 1999 the new J¨ulich ClO/BrO in situ instrument (Vogel et al., 2003) was part of the payload. Both instruments employ the well-established chemical-conversion resonance-fluorescence technique (Brune et al., 1989).
2.1 Meteorological Situation
The dynamical situation of the stratosphere was very differ-ent for the two balloon flights. The flight in November 1996 was conducted during the typical time period of the forma-tion of the Arctic polar vortex in the northern hemisphere,
whereas the flight in May 1999 took place after the dissipa-tion of the polar vortex in spring (see Fig. 1).
The meteorological analysis by FU Berlin for the flight in November 1996 shows that in October 1996 the Arctic polar vortex was more strongly developed than normal. In early November the vortex was split and the center of the vortex was displaced out of the pole towards Greenland. From 7 November, the center of the vortex moved eastward, which caused a temperature decrease and an increase in potential vorticity over Northern Spain until 11 November. After-wards, the wind speed decreased over Northern Spain, be-cause the center of the vortex moved further on eastwards. On 14 November 1996, Le´on was located outside the polar vortex. The air masses probed on this day had previously been led around the Atlantic anticyclone and had crossed the cold area over Iceland in the lower stratosphere.
The flight in May 1999 occurred after a Northern win-ter with a perturbed weak polar vortex. Through most of the Arctic winter 1998/1999, the polar vortex was unusually warm and weak due to an atypically early major stratospheric sudden warming occurring in mid-December. A second ma-jor warming followed in late February (Manney et al., 1999). As a consequence, the vortex was strongly eroded at the time of the flight as is obvious from Fig. 1.
2.2 Flight Profiles
For both balloon flights a flight profile was employed to study in detail the sunrise evolution of the ClO mixing ratios (see Fig. 2).
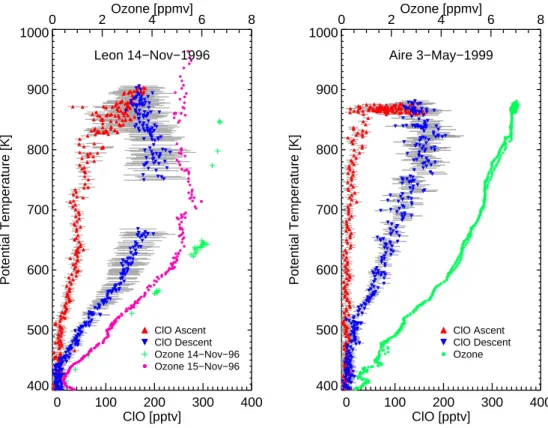
0 100 200 300 400 ClO [pptv] 400 500 600 700 800 900 1000 Potential Temperature [K] ClO Ascent ClO Descent Ozone 14−Nov−96 Ozone 15−Nov−96 0 2 Ozone [ppmv]4 6 8 Leon 14−Nov−1996 0 100 200 300 400 ClO [pptv] 400 500 600 700 800 900 1000 Potential Temperature [K] ClO Ascent ClO Descent Ozone 0 2Ozone [ppmv]4 6 8 Aire 3−May−1999
Fig. 3. Measured ClO mixing ratios as a function of the potential temperature of the balloon flights launched on 14 November 1996 in Le´on (left) and on 3 May 1999 in Aire sur l’Adour (right). The 1 σ accuracy for the ClO measurements is approximately 20–23% (gray bars). For the 1996 flight, no data could be obtained at around 720 K due to a temporary malfunction of the photomultiplier. In addition, for both flights O3mixing ratios are shown measured simultaneously by an ECC ozone sonde on board the TRIPLE payload. Because the signal of the
ozone sonde was jammed on 14 November 1996, additional ozone measurements are shown which were made by an ozone sonde launched in Le´on on 15 November 1996.
On 14 November 1996, the TRIPLE payload was launched at approximately 6.30 UT. After reaching a maximum alti-tude of approximately 35 km (≈9 hPa), a balloon float took place in the 79◦–74◦solar zenith angle (SZA) interval. Dur-ing descent SZAs between 74◦and 63◦were encountered.
On 3 May 1999, the TRIPLE payload was launched at approximately 3.30 UT. The entire balloon ascent was con-ducted at night (SZA >87◦). After reaching a maximum al-titude of approximately 31 km (≈9 hPa), the balloon floated at this altitude between 87◦ and 80◦ SZA into the sunrise, so that within this air mass the increase of the ClO mixing ratios could be measured. During descent a ClO daylight profile was measured between 80◦and 65◦SZA.
2.3 ClO and O3Measurements
The ClO vertical profiles measured by the TRIPLE balloon payload on 14 November 1996 and on 3 May 1999 are shown in Fig. 3.
On 14 November 1996, a ClO profile was measured dur-ing ascent with ClO mixdur-ing ratios of up to 150 pptv at float altitude. During descent a ClO daylight profile was mea-sured with ClO peak values of approximately 220 pptv
be-tween 750 and 800 K potential temperature. In Fig. 3 (left panel), ozone mixing ratios are shown which were measured simultaneously by an ECC (electrochemical concentration cell) ozone sonde on board TRIPLE. The signal of the ozone sonde was jammed, so ozone measurements could not be ob-tained for all altitudes. Therefore in Fig. 3 (left panel) in addition, an ozone profile is shown measured by an ozone sonde launched in Le´on one day after the balloon flight on 15 November 1996. Above 650 K potential temperature, the ozone measurements on 15 November are much lower than on 14 November 1996.
The balloon ascent on 3 May 1999, was during the night so that very low ClO mixing ratios, lower than 50 pptv, were measured (see Fig. 3, right panel). On the float level, ClO mixing ratios increase during sunrise up to approxi-mately 130 pptv. For the ClO daylight profile measured dur-ing descent, maximum ClO mixdur-ing ratios of approximately 200 pptv were obtained at around 840 K potential tempera-ture. Additionally in Fig. 3 (right panel), an ozone profile simultaneously measured by an ECC ozone sonde on board TRIPLE is shown.
For both flights, the overall accuracy of the ClO measure-ment is ≈20–23%. For measured ClO mixing ratios below 50 pptv we deduced an error of ±10 pptv.
We compared the measured ClO mixing ratios at around 22 hPa from both balloon flights with the seasonal varia-tion of lower stratospheric ClO mixing ratios in the northern hemisphere midlatitudes derived from MLS measurements for the time period between September 1991 and December 1993 (Fig. 4–7, WMO, 1995). While a direct comparison of absolute ClO values is difficult due to the slight increase in chlorine loading and differences in solar zenith angles, it seems that the differences in the ClO abundances measured by balloons at 22 hPa (≈650 K) in November and May cor-roborate the seasonal variation in MLS observations at sim-ilar altitudes. Further examination of this feature would be worthwhile.
3 Model Simulations
Model simulations were performed to investigate whether the measured diurnal variation of chlorine monoxide can be re-produced at midlatitudes over the altitude range between 20 and 35 km. ClO mixing ratios measured at one particular level of potential temperature during ascent and descent yield two points within the diurnal variation of ClO. Therefore dif-ferences in ClO mixing ratios between ascent and descent can be used to test our understanding of the photochemi-cal evolution of ClO during sunrise, similar to the model study by Pierson et al. (1999) performed for activated con-ditions. Here we use the Chemical Lagrangian Model of the Stratosphere (CLaMS) (McKenna et al., 2002a,b). This model simulates both the chemistry of multiple air parcels and their transport and is used here as a photochemical box model. The absorption cross sections and reaction rate con-stants are taken from standard recommendations (Sander et al., 2002). For simulations with the CLaMS model, the family concept (IMPACT) is usually employed as the inte-gration solver (McKenna et al., 2002b). In all model simula-tions presented in this work, the explicit stiff solver SVODE (McKenna et al., 2002b) is used which is more precise but numerically more expensive. As input data for the photol-ysis scheme an ozone profile is derived from model results of the Mainz 2-D model (Gidel et al., 1983; Grooß, 1996) below 15 km altitude and from observations of the Halogen Occultation Experiment (HALOE) on board the UARS satel-lite (Russell et al., 1993) above 15 km altitude. The surface area of the background aerosol (SSA=stratospheric sulfu-ric aerosol) per unit volume ASSA was adjusted by varying
the mixing ratio of H2SO4in ppbv in the gas-phase
equiv-alent employing a stratospheric aerosol climatology based on SAGE II and CLAES measurements by Bauman et al. (2003).
We performed simulations along 24-hour backward tra-jectories calculated from the locations of the measurements
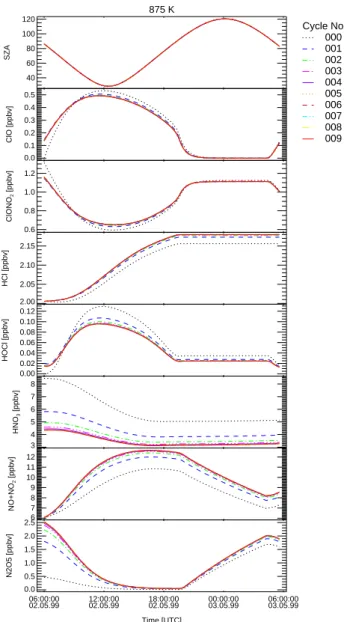
875 K 40 60 80 100 120 SZA Cycle No.: 000 001 002 003 004 005 006 007 008 009 0.0 0.1 0.2 0.3 0.4 0.5 ClO [ppbv] 0.6 0.8 1.0 1.2 ClONO 2 [ppbv] 2.00 2.05 2.10 2.15 HCl [ppbv] 0.00 0.02 0.04 0.06 0.08 0.10 0.12 HOCl [ppbv] 3 4 5 6 7 8 HNO 3 [ppbv] 6 7 8 9 10 11 12 NO+NO 2 [ppbv] 06:00:00 02.05.99 12:00:0002.05.99 18:00:0002.05.99 00:00:0003.05.99 06:00:0003.05.99 Time [UTC] 0.0 0.5 1.0 1.5 2.0 2.5 N2O5 [ppbv]
Fig. 4. The convergence of the simulated diurnal variation of vari-ous species for cycles 0 to 9 is shown at 875 K potential temperature for the flight launched on 3 May 1999 in Aire sur l’Adour.
starting at different levels of potential temperature between 500 K and the float altitude (≈865 K–900 K) and for differ-ent SZAs during float (see Figs. 6 and 8). We calculated these backward trajectories using wind data from the UK Met Office (UKMO) analyses. A chemical initialization had to be determined for the simulations at each level of poten-tial temperature. All available stratospheric measurements, together with tracer-tracer correlations, and model simula-tions, were used as sources for this initialization. Table 1 gives an overview over the measurements employed in order to derive the initialization of the most important species for the model simulations. We calculate the temporal develop-ment of the chemical trace species along each 24-hour back-ward trajectory continually using the results of the previous
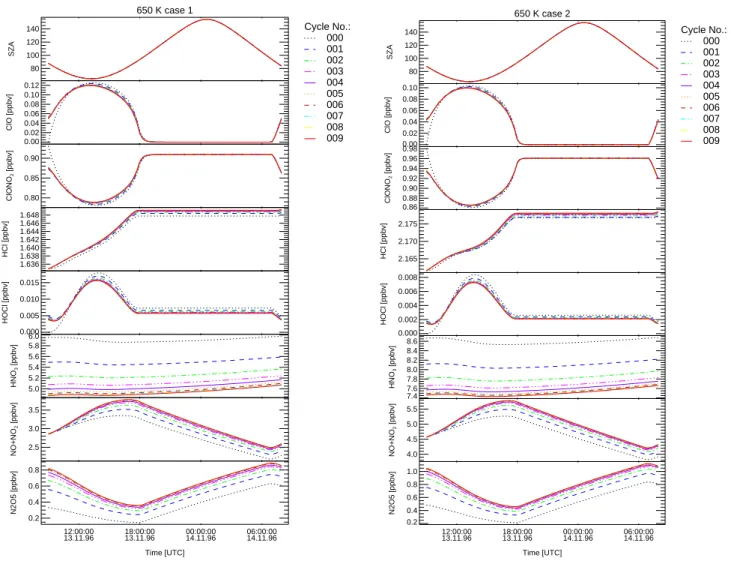
650 K case 1 80 100 120 140 SZA Cycle No.: 000 001 002 003 004 005 006 007 008 009 0.00 0.02 0.04 0.06 0.08 0.10 0.12 ClO [ppbv] 0.80 0.85 0.90 ClONO 2 [ppbv] 1.636 1.638 1.640 1.642 1.644 1.646 1.648 HCl [ppbv] 0.000 0.005 0.010 0.015 HOCl [ppbv] 5.0 5.2 5.4 5.6 5.8 6.0 HNO 3 [ppbv] 2.5 3.0 3.5 NO+NO 2 [ppbv] 12:00:00 13.11.96 18:00:0013.11.96 00:00:0014.11.96 06:00:0014.11.96 Time [UTC] 0.2 0.4 0.6 0.8 N2O5 [ppbv] 650 K case 2 80 100 120 140 SZA Cycle No.: 000 001 002 003 004 005 006 007 008 009 0.00 0.02 0.04 0.06 0.08 0.10 ClO [ppbv] 0.86 0.88 0.90 0.92 0.94 0.96 0.98 ClONO 2 [ppbv] 2.165 2.170 2.175 HCl [ppbv] 0.000 0.002 0.004 0.006 0.008 HOCl [ppbv] 7.4 7.6 7.8 8.0 8.2 8.4 8.6 HNO 3 [ppbv] 4.0 4.5 5.0 5.5 NO+NO 2 [ppbv] 12:00:00 13.11.96 18:00:0013.11.96 00:00:0014.11.96 06:00:0014.11.96 Time [UTC] 0.2 0.4 0.6 0.8 1.0 N2O5 [ppbv]
Fig. 5. The convergence of the simulated diurnal variation of various species for cycles 0 to 9 is shown at 650 K potential temperature for the flight launched on 14 November 1996 in Le´on.
model simulation to initialize the following 24-hour simula-tion, whereas the species CH4, HCl, H2O, NOx, and O3
de-rived from measurements are reinitialized to measured val-ues. The conservation of Bry, Cly, and NOyis guaranteed
between the different cycles.
After approximately 6–9 cycles, depending on altitude, most chemical species converge to a constant volume mix-ing ratio for a given time in the simulation (see Figs. 4 and 5). Additionally, model simulations using different initial-izations for the partitioning between HNO3 and N2O5 (cf.
Table 1) converge to the same ClO mixing ratios after ap-proximately 9 cycles. The volume mixing ratios of the im-portant species used to initialize the model simulations for the last cycle are shown in Tables 2, 3, and 4.
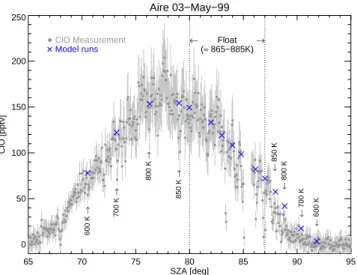
3.1 Results for the Flight on 3 May 1999
Figure 6 shows that the simulated ClO mixing ratios agree excellently with the ClO measurements. We note that for the night-time ClO profile (SZA>87◦) the model simulations are at the upper limit of the measurements. A possible de-viation of simulated ClO mixing ratios from measured ClO mixing ratios depending on solar zenith angle is discussed in Sect. 3.3. The simulated diurnal variation of ClO and various other species are shown for different levels of potential tem-perature in Fig. 7. The sensitivity of the model simulations toward the surface area of the background aerosol per unit volume ASSAwas examined. Simulations with ASSA values
significantly higher and lower than reported by Bauman et al. (2003) were performed (cf. Table 5). However, the sensitivity of ClO mixing ratios on the surface area of the background aerosol is not substantial (<3%).
Table 1. Sources of the major chemical species used to initialize the model simulations for the flight on 5 May 1999 launched in Aire sur l’Adour and for the flight on 14 November 1996 launched in Le´on.
Species Aire sur l’Adour 1999 Le´on 1996
CH4 cryogenic whole air samplera HALOE (1–5 Nov. and 15–22 Nov. 1996)f
N2O cryogenic whole air samplera CH4– N2O correlationg
Cly cryogenic whole air samplera N2O – Clycorrelationh
HCl HALOE (25–27 April 1999)b HALOEf ClONO2 Cly- HCl Cly- HCl
ClO as zeroc as zeroc
NOy N2O – NOycorrelationd N2O – NOycorrelationd
NOx= NO+ NO2 HALOEb HALOEf
HNO3+2×N2O5 = NOy- ClONO2- NOxe = NOy- ClONO2- NOxe
O3 ozone sondea HALOEf
H2O HALOEb HALOEf
all other Mainz 2-D model Mainz 2-D model (Gidel et al., 1983; Grooß, 1996)
a Conducted on board TRIPLE (cf. Sect. 2)
bObservations of the Halogen Occultation Experiment (HALOE) on board the UARS satellite (Russell
et al., 1993) in northern hemisphere midlatitudes (within 35◦N and 50◦N) are only available between 25 and 27 April 1999. A mean vertical profile is derived.
c ClO and all other chlorine species, except ClONO
2and HCl were initialized as zero.
dThis correlation (Sugita et al., 1998) was derived from measurements by the ATMOS (Atmospheric
Trace Molecule Spectroscopy) instrument on board the space shuttle during the ATLAS 3 mission within
a period of 10 days in early November 1994. The correlation is valid for high and midlatitudes.
e As upper and lower limits for the partitioning, we assume a ratio of HNO
3: 2×N2O5of 9:1 and of 1:9,
respectively. All other species of the nitrogen family were initialized as zero.
f A mean profile derived from HALOE measurements between 1–5 November and 15–22 November 1996
within 35◦N and 50◦N for midlatitude (case 1) and vortex (case 2) air masses (cf. Sect. 3.2)
gA CH
4– N2O correlation is used derived from measurements of the ATMOS instrument conducted
during different missions in March 1992, April 1993, and November 1994 (Michelsen et al., 1998) for midlatitudes (case 1). For vortex conditions (case 2), we employed the CH4– N2O correlation (Grooß
et al., 2002) to determine N2O derived from measurements conducted on board the ER-2 aircraft and on
board the TRIPLE payload during the Arctic winter 1999/2000 inside the vortex. Above 25 km altitude (the maximum altitude of the TRIPLE flights), a CH4– N2O correlation is used derived from ATMOS
measurements for polar latitudes (Michelsen et al., 1998)
hTo infer Cl
y, we used for midlatitude and vortex conditions the N2O – Cly correlation derived from
measurements of the cryogenic whole air sample on board the TRIPLE payload conducted in Kiruna and in Aire sur l’Adour 1999 (Engel et al., 1999).
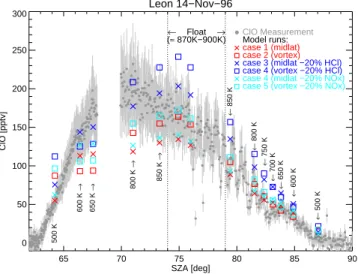
3.2 Results for the Flight on 14 November 1996
For the Le´on flight, no measurements of long-lived tracers from the cryogenic whole air sampler on board the TRIPLE payload are available because of problems with the sealing of the air samples. Thus no measurements of either CH4
or N2O and no information about the total amount of
inor-ganic chlorine Clyare available. Therefore to initialize the
model simulations we use measurements of the Halogen Oc-cultation Experiment (HALOE) on board the UARS satellite (Russell et al., 1993) and tracer-tracer correlations.
For November 1996, HALOE measurements are available in northern hemisphere midlatitudes within 35◦N–50◦N for the time period of 1–5 November and of 15–22 November. Thus for 14 November, the day of the TRIPLE flight, no
HALOE observations exist in the in northern hemisphere midlatitudes. Performing a potential vorticity (PV) analy-sis of the HALOE measurements shows that the HALOE measurements were conducted both within and outside of the polar vortex depending on longitude due to the distinct asymmetric form of the vortex that was shifted away from the North Pole. From meteorological analysis the air masses probed during the TRIPLE flight were led around the po-lar vortex before the measurement (cf. Sect. 2.1). Therefore we derived two data sets to initialize the model simulations; one for midlatitude air masses (case 1) and one for polar air masses (case 2). The following PV criterion was used to sep-arate midlatitude and polar air masses:
Table 2. Mixing ratios of the major chemical species used to initialize the model simulations for the flight on 5 May 1999 launched in Aire sur l’Adour for the 9th cycle.
THETA [K] 600 600 700 700 800 800 850 850 866 886 875 874 874 871 871 trajnoa 01 02 03 04 05 06 07 08 09 10 11 12 13 14 15 SZAb,◦ 91.8 70.5 90.4 73.2 88.8 76.3 88.0 79.0 80.0 82.0 83.0 84.0 84.8 86.1 87.0 CH4, ppmv 1.29 1.29 1.01 1.01 0.78 0.78 0.68 0.68 0.68 0.68 0.68 0.68 0.68 0.68 0.68 Cly, ppbv 2.11 2.11 2.88 2.88 3.20 3.20 3.32 3.32 3.32 3.32 3.32 3.32 3.32 3.32 3.32 HCl, ppbv 1.16 1.16 1.56 1.56 1.87 1.87 2.01 2.01 2.01 2.01 2.01 2.01 2.01 2.01 2.01 ClO, pptv 3.58 81.33 18.53 129.44 45.88 167.85 63.78 171.96 170.10 156.27 137.37 124.49 113.27 93.88 82.48 ClONO2, ppbv 0.94 0.86 1.29 1.18 1.28 1.16 1.23 1.13 1.13 1.14 1.16 1.17 1.18 1.20 1.21 NOy, ppbv 7.17 7.17 12.40 12.40 16.05 16.05 16.76 16.76 16.76 16.76 16.76 16.76 16.76 16.76 16.76 NO, ppbv 0.27 0.86 1.34 1.92 2.22 2.66 2.59 2.95 2.97 2.96 2.91 2.88 2.86 2.77 2.72 NO2, ppbv 1.64 1.05 2.82 2.23 3.30 2.86 3.46 3.11 3.09 3.09 3.14 3.17 3.19 3.28 3.34 HNO3, ppbv 3.12 3.37 4.41 4.82 5.04 5.56 4.46 4.85 4.61 4.25 4.34 4.31 4.28 4.26 4.21 N2O5, ppbv 0.48 0.39 1.15 1.00 2.00 1.80 2.41 2.27 2.39 2.57 2.51 2.52 2.53 2.54 2.55 O3c, ppmv 4.46 4.46 5.61 5.61 6.36 6.36 6.82 6.82 6.82 6.82 6.82 6.82 6.82 6.82 6.82 H2O, ppmv 4.75 4.75 5.36 5.36 5.63 5.63 5.70 5.70 5.70 5.70 5.70 5.70 5.70 5.70 5.70 CO, ppbv 16.91 16.92 18.90 18.88 20.68 20.59 21.42 21.40 21.86 22.49 22.15 22.12 22.12 22.04 22.06 ASSAd, µm2cm−3 0.61 0.61 0.42 0.42 0.31 0.31 0.27 0.27 0.26 0.25 0.25 0.25 0.25 0.26 0.26 temperatureb, K 215.53 215.53 220.78 220.81 226.97 226.91 230.09 230.16 231.22 232.50 231.79 231.70 231.69 231.50 231.55 pressureb, hPa 28.15 28.21 17.89 17.92 12.26 12.32 10.43 10.39 9.94 9.40 9.70 9.73 9.74 9.82 9.80 altitudeb, km 24.99 24.98 28.17 28.15 30.81 30.78 31.94 31.97 32.27 32.67 32.45 32.42 32.42 32.36 32.38 aTrajectory number
bValues at the end of the trajectory cInitial mixing ratios for all cycles
dSurface area of the background aerosol per unit volume
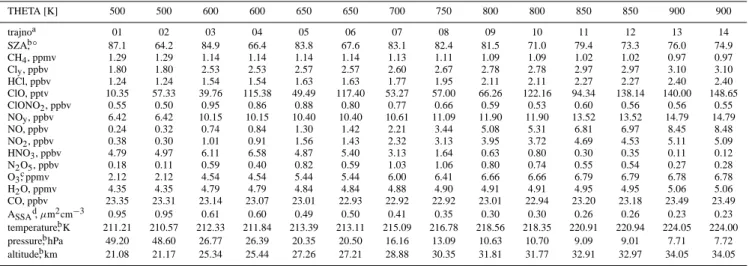
Table 3. Mixing ratios of the major chemical species used to initialize the model simulations for the flight on 14 November 1996 launched in Le´on for midlatitude air masses (case 1) and for the 9th cycle.
THETA [K] 500 500 600 600 650 650 700 750 800 800 850 850 900 900 trajnoa 01 02 03 04 05 06 07 08 09 10 11 12 13 14 SZAb,◦ 87.1 64.2 84.9 66.4 83.8 67.6 83.1 82.4 81.5 71.0 79.4 73.3 76.0 74.9 CH4, ppmv 1.29 1.29 1.14 1.14 1.14 1.14 1.13 1.11 1.09 1.09 1.02 1.02 0.97 0.97 Cly, ppbv 1.80 1.80 2.53 2.53 2.57 2.57 2.60 2.67 2.78 2.78 2.97 2.97 3.10 3.10 HCl, ppbv 1.24 1.24 1.54 1.54 1.63 1.63 1.77 1.95 2.11 2.11 2.27 2.27 2.40 2.40 ClO, pptv 10.35 57.33 39.76 115.38 49.49 117.40 53.27 57.00 66.26 122.16 94.34 138.14 140.00 148.65 ClONO2, ppbv 0.55 0.50 0.95 0.86 0.88 0.80 0.77 0.66 0.59 0.53 0.60 0.56 0.56 0.55 NOy, ppbv 6.42 6.42 10.15 10.15 10.40 10.40 10.61 11.09 11.90 11.90 13.52 13.52 14.79 14.79 NO, ppbv 0.24 0.32 0.74 0.84 1.30 1.42 2.21 3.44 5.08 5.31 6.81 6.97 8.45 8.48 NO2, ppbv 0.38 0.30 1.01 0.91 1.56 1.43 2.32 3.13 3.95 3.72 4.69 4.53 5.11 5.09 HNO3, ppbv 4.79 4.97 6.11 6.58 4.87 5.40 3.13 1.64 0.63 0.80 0.30 0.35 0.11 0.12 N2O5, ppbv 0.18 0.11 0.59 0.40 0.82 0.59 1.03 1.06 0.80 0.74 0.55 0.54 0.27 0.28 O3c, ppmv 2.12 2.12 4.54 4.54 5.44 5.44 6.00 6.41 6.66 6.66 6.79 6.79 6.78 6.78 H2O, ppmv 4.35 4.35 4.79 4.79 4.84 4.84 4.88 4.90 4.91 4.91 4.95 4.95 5.06 5.06 CO, ppbv 23.35 23.31 23.14 23.07 23.01 22.93 22.92 22.92 23.01 22.94 23.20 23.18 23.49 23.49 ASSAd, µm2cm−3 0.95 0.95 0.61 0.60 0.49 0.50 0.41 0.35 0.30 0.30 0.26 0.26 0.23 0.23 temperatureb, K 211.21 210.57 212.33 211.84 213.39 213.11 215.09 216.78 218.56 218.35 220.91 220.94 224.05 224.00 pressureb, hPa 49.20 48.60 26.77 26.39 20.35 20.50 16.16 13.09 10.63 10.70 9.09 9.01 7.71 7.72 altitudeb, km 21.08 21.17 25.34 25.44 27.26 27.21 28.88 30.35 31.81 31.77 32.91 32.97 34.05 34.05 aTrajectory number
bValues at the end of the trajectory cInitial mixing ratios for all cycles
dSurface area of the background aerosol per unit volume
Midlatitude
2 600 K 700 K 900 K
PV <70 PVU <120 PVU <400 PVU Vortex
2 600 K 700 K 800 K
PV >80 PVU >150 PVU >300 PVU
The PV criterion was determined by analyzing the PV – CH4and the O3– CH4correlations observed by HALOE.
For both midlatitude and vortex conditions, simulations and measured ClO mixing ratio show a good agreement dur-ing float and night-time. Durdur-ing daylight, simulations are at the lower limit of the uncertainties of the ClO measurements and significantly underestimate the measurements at around
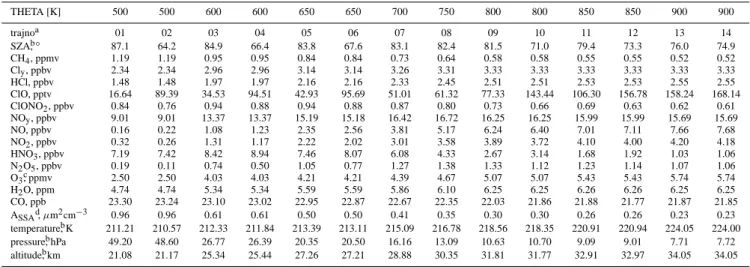
Table 4. Mixing ratios of the major chemical species used to initialize the model simulations for the flight on 14 November 1996 launched in Le´on for vortex air masses (case 2) and for the 9th cycle.
THETA [K] 500 500 600 600 650 650 700 750 800 800 850 850 900 900 trajnoa 01 02 03 04 05 06 07 08 09 10 11 12 13 14 SZAb,◦ 87.1 64.2 84.9 66.4 83.8 67.6 83.1 82.4 81.5 71.0 79.4 73.3 76.0 74.9 CH4, ppmv 1.19 1.19 0.95 0.95 0.84 0.84 0.73 0.64 0.58 0.58 0.55 0.55 0.52 0.52 Cly, ppbv 2.34 2.34 2.96 2.96 3.14 3.14 3.26 3.31 3.33 3.33 3.33 3.33 3.33 3.33 HCl, ppbv 1.48 1.48 1.97 1.97 2.16 2.16 2.33 2.45 2.51 2.51 2.53 2.53 2.55 2.55 ClO, pptv 16.64 89.39 34.53 94.51 42.93 95.69 51.01 61.32 77.33 143.44 106.30 156.78 158.24 168.14 ClONO2, ppbv 0.84 0.76 0.94 0.88 0.94 0.88 0.87 0.80 0.73 0.66 0.69 0.63 0.62 0.61 NOy, ppbv 9.01 9.01 13.37 13.37 15.19 15.18 16.42 16.72 16.25 16.25 15.99 15.99 15.69 15.69 NO, ppbv 0.16 0.22 1.08 1.23 2.35 2.56 3.81 5.17 6.24 6.40 7.01 7.11 7.66 7.68 NO2, ppbv 0.32 0.26 1.31 1.17 2.22 2.02 3.01 3.58 3.89 3.72 4.10 4.00 4.20 4.18 HNO3, ppbv 7.19 7.42 8.42 8.94 7.46 8.07 6.08 4.33 2.67 3.14 1.68 1.92 1.03 1.06 N2O5, ppbv 0.19 0.11 0.74 0.50 1.05 0.77 1.27 1.38 1.33 1.12 1.23 1.14 1.07 1.06 O3c, ppmv 2.50 2.50 4.03 4.03 4.21 4.21 4.39 4.67 5.07 5.07 5.43 5.43 5.74 5.74 H2O, ppm 4.74 4.74 5.34 5.34 5.59 5.59 5.86 6.10 6.25 6.25 6.26 6.26 6.25 6.25 CO, ppb 23.30 23.24 23.10 23.02 22.95 22.87 22.67 22.35 22.03 21.86 21.88 21.77 21.87 21.85 ASSAd, µm2cm−3 0.96 0.96 0.61 0.61 0.50 0.50 0.41 0.35 0.30 0.30 0.26 0.26 0.23 0.23 temperatureb, K 211.21 210.57 212.33 211.84 213.39 213.11 215.09 216.78 218.56 218.35 220.91 220.94 224.05 224.00 pressureb, hPa 49.20 48.60 26.77 26.39 20.35 20.50 16.16 13.09 10.63 10.70 9.09 9.01 7.71 7.72 altitudeb, km 21.08 21.17 25.34 25.44 27.26 27.21 28.88 30.35 31.81 31.77 32.91 32.97 34.05 34.05 aTrajectory number
bValues at the end of the trajectory cInitial mixing ratios for all cycles
dSurface area of the background aerosol per unit volume
Table 5. Simulated ClO mixing ratios (end of trajectory) for the 9th cycle for different model input of surface areas of the background aerosol per unit volume ASSA.
Aire sur l’Adour 1999
THETA [K] 600 600 700 700 800 800 850 850 866 886 875 874 874 871 871 ASSAa, µm2cm−3 0.61 0.61 0.42 0.42 0.31 0.31 0.27 0.27 0.26 0.25 0.25 0.25 0.25 0.26 0.26 ClOa, pptv 3.45 78.00 17.57 122.32 41.99 153.44 57.43 154.32 149.38 133.22 119.15 108.21 98.51 82.02 72.01 ASSAb, µm2cm−3 1.13 1.13 0.78 0.78 0.57 0.57 0.50 0.50 0.48 0.46 0.47 0.47 0.47 0.47 0.47 ClOb, pptv 3.50 79.96 17.73 124.16 42.30 154.79 57.82 155.41 150.39 134.07 119.93 108.92 99.16 82.57 72.48 ASSAc, µm2cm−3 0.24 0.24 0.17 0.17 0.12 0.12 0.11 0.11 0.10 0.10 0.10 0.10 0.10 0.10 0.10 ClOc, pptv 3.40 76.19 17.44 120.74 41.74 152.33 57.12 153.45 148.58 132.54 118.52 107.65 97.99 81.59 71.63
Le´on 1996 case 1 (midlat)
THETA [K] 500 500 600 600 650 650 700 750 800 800 850 850 900 900 ASSAa, µm2cm−3 0.95 0.95 0.61 0.60 0.49 0.50 0.41 0.35 0.30 0.30 0.26 0.26 0.23 0.23 ClOa, pptv 10.04 55.11 39.13 113.17 48.70 115.32 52.35 55.93 64.25 118.54 89.01 130.02 126.86 134.71 ASSAb, µm2cm−3 1.76 1.76 1.12 1.11 0.91 0.92 0.76 0.64 0.55 0.55 0.48 0.48 0.42 0.42 ClOb, pptv 10.35 57.56 40.12 117.13 49.70 118.42 53.17 56.50 64.54 119.23 89.19 130.35 126.97 134.84 ASSAc, µm2cm−3 0.38 0.38 0.24 0.24 0.20 0.20 0.16 0.14 0.12 0.12 0.10 0.10 0.09 0.09 ClOc, pptv 9.65 52.26 37.99 108.96 47.62 112.13 51.52 55.39 64.00 117.94 88.86 129.76 126.77 134.61 Le´on 1996 case 2 (vortex)
THETA [K] 500 500 600 600 650 650 700 750 800 800 850 850 900 900 ASSAa, µm2cm−3 0.96 0.96 0.61 0.61 0.50 0.50 0.41 0.35 0.30 0.30 0.26 0.26 0.23 0.23 ClOa, pptv 16.35 87.42 34.11 93.13 42.18 93.80 50.10 60.58 76.69 142.78 104.95 154.99 153.87 163.61 ASSAb, µm2cm−3 1.77 1.77 1.13 1.12 0.92 0.92 0.76 0.65 0.55 0.55 0.49 0.48 0.42 0.42 ClOb, pptv 16.84 91.35 35.06 96.44 43.07 96.21 50.88 61.28 77.30 144.02 105.57 155.91 154.47 164.25 ASSAc, µm2cm−3 0.38 0.38 0.24 0.24 0.20 0.20 0.16 0.14 0.12 0.12 0.10 0.10 0.09 0.09 ClOc, pptv 15.70 82.74 33.03 89.64 41.24 91.37 49.33 59.91 76.12 141.65 104.41 154.18 153.36 163.07 aStandard simulation bSimulation with higher A
SSAvalues cSimulation with lower A
Aire 03−May−99 65 70 75 80 85 90 95 SZA [deg] 0 50 100 150 200 250 ClO [pptv] Float (≈ 865−885K) ← → ClO Measurement Model runs 600 K → 700 K → 800 K → 850 K → ← 850 K ← 800 K ← 700 K ← 600 K
Fig. 6. Simulated ClO mixing ratios as a function of SZA compared to measured ClO mixing ratios of the TRIPLE flight launched on 3 May 1999 in Aire sur l’Adour. The uncertainties of the ClO mea-surements are shown as gray bars (1 σ accuracy, see Fig. 3). The chemistry along each 24-hour backward trajectory is calculated a few times using the results of the previous model simulation to ini-tialize the following simulation. Here model simulations are shown after 9 such cycles. For details concerning the model scenario see text. The corresponding levels of potential temperature are labeled by arrows.
650 K potential temperature during the most sunlit portion of the flight (SZA about 67◦). Only at 500 K does case 1 reproduce the ClO daylight measurements. In general, the simulations for midlatitude conditions are somewhat lower than for vortex conditions above 700 K and somewhat higher below, except at 500 K (see Fig. 8). We note that although the Clyvalues are for vortex conditions higher than for
mid-latitude conditions, simulated ClO mixing ratios for case 2 are less than for case 1 between 600 and 700 K. Presumably, this difference is driven by higher NOxmixing ratios for
vor-tex conditions. For both cases, the maximum of the distri-bution is shifted to larger SZAs compared to the measure-ments. The simulated diurnal variation of ClO and various other species for different levels of potential temperature are shown in Fig. 9. The sensitivity of the model simulations toward ASSAwas also examined in the same way as for the
flight launched in Aire sur l’Adour (cf. Table 5). For both cases, the sensitivity of ClO mixing ratios on ASSAvalues is <6% below 700 K and <2% above.
3.2.1 Discrepancy for daylight ClO at around 650 K Here we discuss possible reasons for the discrepancy be-tween simulations and measurements for the ClO daylight profile at around 650 K. At midlatitudes, chlorine nitrate is formed by the reaction of ClO with NO2and is dissociated
by photolysis in the ultraviolet (e.g., Brasseur and Solomon, 1984): 9th cycle 0 100 200 300 400 500 ClO [pptv] Trajectory: 600K 700K 800K 850K 875K 0.70 0.80 0.90 1.00 1.10 1.20 ClONO 2 [ppbv] 2 4 6 8 10 12 NO2 [ppbv] 0 10 20 30 40 50 HO2 [pptv] 0 2 4 6 8 10 12 BrO [pptv] 4.5 5.0 5.5 6.0 6.5 7.0 O3 [ppmv] 12:00:00 02.05.99 18:00:0002.05.99 00:00:0003.05.99 06:00:0003.05.99 Time [UTC] −20 0 20 40 60 O3 change (ppbv/h)
Fig. 7. For the flight launched on 3 May 1999 in Aire sur l’Adour, the simulated diurnal variation of ClO, ClONO2, NO2, HO2, BrO, O3mixing ratios, and the rate of ozone change in ppbv per hour are
shown between 600 K and 875 K potential temperature for the 9th cycle.
ClO + NO2+M → ClONO2+M (1)
ClONO2+hν →Cl + NO3 (2)
Thus the concentration of daylight ClO depends on the concentration of night-time ClONO2. Therefore
underesti-mated ClO mixing ratios would imply that ClONO2is
un-derestimated and thus HCl is overestimated by the model. Simulations initialized with HCl mixing ratios reduced by about 20% (equivalent to approximately the minimum HCl mixing ratios measured by HALOE) and using the same Cly
Leon 14−Nov−96 65 70 75 80 85 90 SZA [deg] 0 50 100 150 200 250 300 ClO [pptv] Float
(←≈ 870K−900K)→ ClO MeasurementModel runs: case 1 (midlat) case 2 (vortex) case 3 (midlat −20% HCl) case 4 (vortex −20% HCl)
case 4 (midlat −20% NOx) case 5 (vortex −20% NOx)
500 K 600 K → 650 K → 800 K → 850 K → ← 850 K ← 800 K ← 750 K ← 700 K ← 650 K ← 600 K ← 500 K
Fig. 8. Simulated ClO mixing ratios as a function of SZA compared to measured ClO mixing ratios of the TRIPLE flight launched on 14 November 1996 in Le´on. The uncertainties of the ClO measure-ments are shown as gray bars (1 σ accuracy, see Fig. 3). The chem-istry along each 24-hour backward trajectory is calculated a few times using the results of the previous model simulation to initialize the following simulation. Here model simulations are shown after 9 such cycles. For case 1 and 2 the model is initialized using a data set representing midlatitude air masses and vortex air masses, re-spectively (cf. Sect. 3.2). For details concerning the different model scenarios see text. The corresponding levels of potential tempera-ture are labeled by arrows.
as in case 1 or case 2 reproduce the ClO daylight measure-ments after 9 cycles, but significantly overestimate the ClO night-time measurements after 9 cycles for both midlatitude and vortex conditions (see case 3 and 4, Fig. 8).
Further in the lower stratosphere, ClO is inversely corre-lated with NO2(Stimpfle et al., 1994). In a sensitivity study,
the initial NOx mixing ratios were reduced by about 20%
(equivalent to approximately the minimum NOxmixing
ra-tios measured by HALOE), where the same NOy was used
as in case 1 and 2 (see case 5 and 6, Fig. 8). Nonetheless, the measured ClO daylight values are still underestimated or are at the lower limit of the uncertainty of the ClO measure-ments by the simulations after 9 cycles and simultaneously the measured ClO night-time values are at the upper limit of the measurements.
In summary, uncertainties in the initialization of HCl and NOxmight cause the discrepancies in the ClO daylight
pro-file at around 650 K. However, no initialization could be de-rived so that model simulations simultaneously reproduced the entire measured ClO daylight and night-time profile. Nevertheless, the comparison between ClO measurements and simulations (see Fig. 8) is consistent with the view that vortex air masses are probed above 650 K and air masses originating from midlatitudes are probed below 650 K, be-cause for these cases simulated ClO mixing ratios
simul-taneously agree with the measurements for night-time and daylight conditions. These findings are confirmed by calcu-lations of 10-day backward trajectories using ERA-40 Re-Analyses wind data produced by ECMWF (European Centre for Medium-Range Weather Forecasts) (see Fig. 10). The comparison between simulations and measurements indi-cates that at 650 K potential temperature, vortex air masses are probed during ascent and midlatitude air masses are de-tected during descent. In calculations of 10-day backward trajectories using wind data from both the UK Met Office (UKMO) analyses and ERA-40 Re-Analyses the origin of the air masses sampled during the balloon ascent and de-scent are located relatively close together (see Fig. 10). But it also may be expected that 10-day backward trajectories using wind data with a time resolution of 24 h and 6 h, respectively, cannot precisely resolve the origin of air masses probed be-tween ascent and descent which differ within a time interval of approximately 2–3 h.
Nevertheless, we analyzed further reasons independent of the initialization of the model simulations and the dy-namic conditions of the flight that could explain the un-certainties for the Le´on flight, although the simulations of the Aire sur l’Adour flight show an excellent agreement with the measurements and thus indicate that no substantial uncertainties exist in midlatitude chlorine chemistry. The quantum yields of the two ClONO2 photolysis channels
(ClONO2+hν→ClO+NO2 and ClONO2+hν→Cl+NO3)
are taken from standard recommendations (Sander et al., 2002). Nickolaisen et al. (1996) observed Cl pressure depen-dence of the quantum yield for the ClONO2 photolysis
be-yond 300 nm. If model simulations do not consider the effect of pressure on the ClONO2photolysis, models would tend
to over-predict HCl and under-predict ClONO2and thus ClO
mixing ratios in the lower stratosphere. In our study, in order to reproduce ClO mixing ratios measured during daylight by model simulations, JClONO2 would have to be increased by
a factor of two or more (for case 1 and 2). In this case, the measured ClO night-time and float profiles would be sub-stantially overestimated by model simulations. Thus it is un-likely that uncertainties in JClONO2are the major source of the
discrepancies between measurements and simulations in the ClO daylight profile. Furthermore, the quantum yield for the ClONO2 photolysis channels beyond 300 nm was modified
in the model simulations. Even by neglecting the Cl+NO3
channel in favor of the ClO+NO2 channel beyond 300 nm,
no evidence is found here that a significant change in the quantum yield has any influence on ClO mixing ratios.
Avallone et al. (1993) found in a comparison of ClO in situ balloon measurements and model simulations a good agree-ment, except below 20 km altitude, where observed ClO is higher than simulated ClO by as much as a factor of four. A mechanism responsible for maintaining these high ClO mix-ing ratios was at that time unclear, whereas reaction rates and absorption cross-sections were taken from DeMore et al. (1992). In our study, we found no discrepancies below
9th cycle 0 50 100 150 200 250 ClO [pptv] Trajectory: 500K case 1 600K 700K 800K 900K 0.4 0.5 0.6 0.7 0.8 0.9 ClONO 2 [ppbv] 0 2 4 6 8 10 12 NO2 [ppbv] 0 5 10 15 20 HO2 [pptv] 0 5 10 15 BrO [pptv] 2 3 4 5 6 O3 [ppmv] 12:00:00 13.11.96 18:00:0013.11.96 00:00:0014.11.96 06:00:0014.11.96 Time [UTC] −20 0 20 O3 change (ppbv/h) 9th cycle 0 50 100 150 200 250 300 ClO [pptv] Trajectory: 500K case 2 600K 700K 800K 900K 0.5 0.6 0.7 0.8 0.9 ClONO 2 [ppbv] 0 2 4 6 8 10 12 NO2 [ppbv] 0 5 10 15 20 25 HO2 [pptv] 0 2 4 6 8 10 12 14 BrO [pptv] 3 4 5 O3 [ppmv] 12:00:00 13.11.96 18:00:0013.11.96 00:00:0014.11.96 06:00:0014.11.96 Time [UTC] −20 0 20 40 O3 change (ppbv/h)
Fig. 9. For the flight launched on 14 November 1996 in Le´on, the simulated diurnal variation for case 1 (left panel) and case 2 (right panel) of ClO, ClONO2, NO2, HO2, BrO, O3mixing ratios, and the rate of ozone change in ppbv per hour are shown between 500 K and 900 K
potential temperature for the 9th cycle.
20 km altitude between measured and simulated ClO mix-ing ratios usmix-ing reaction rate constants and absorption cross-sections from current standard recommendations (Sander et al., 2002).
3.3 SZA Dependence of Simulated ClO to Measured ClO The deviation of simulated ClO (ClOModel) from measured ClO (ClOMeas) is analyzed as a function of the SZA. For this purpose, the measured ClO mixing ratios were averaged in SZA intervals of 0.5◦. The average properties of these SZA intervals are shown in Table 6. To take into account the un-certainties of the model simulations we calculate the ratio ClOModel/ClOMeas(RClO) for each model trajectory and for
all sensitivity simulations shown in Figs. 6 and 8. A
ten-dency of RClOto increase for SZAs larger than 87◦ is found
for the Aire flight (see Fig. 11). For the Le´on flight, we have no RClOvalues for SZAs larger than 87◦. However, for
mea-surements at 87◦, RClOis also increased, in contrast to RClO
at 87◦for the Aire flight. All other RClO values are in the
interval 1.0+0.32/−0.03 for the Aire sur l’Adour flight and in the interval 1.0+1.10/−0.45 for the Le´on flight including the discrepancy found in the ClO daylight profile at around 650 K.
Clearly for SZA larger than 86◦–87◦ the model substan-tially overestimates the observed ClO mixing ratios. The reason for this discrepancy is not known at present. Further evidence exists indicating that for high solar zenith angles the stratospheric chlorine chemistry is not completely under-stand. Rivi`ere et al. (2003) reported that the comparison of
Table 6. Average properties of the SZA intervals for the ClO measurements as shown in Fig. 11.
trajno SZAa Nh ClO [pptv]c S(ClO) [pptv]d rel. S(ClO) [%] press [hPa] alt [km] Aire sur l’Adour 1999
1.0 91.8 18.0 0.3 0.9 313.3 27.5 24.2 2.0 70.5 17.0 68.7 2.1 3.1 27.5 24.3 3.0 90.4 18.0 6.6 1.4 20.9 17.6 27.1 4.0 73.2 16.0 113.8 4.0 3.5 17.7 27.0 5.0 88.8 18.0 16.5 2.3 13.7 11.8 29.5 6.0 76.3 16.0 157.7 3.8 2.4 12.5 29.3 7.0 88.0 18.0 34.0 3.3 9.8 10.0 30.5 8.0 79.0 17.0 147.9 4.5 3.1 10.5 30.4 9.0 80.0 17.0 140.9 3.5 2.5 9.9 30.5 10.0 82.0 17.0 126.1 3.8 3.0 9.7 30.7 11.0 83.0 17.0 113.4 9.1 8.1 9.5 31.1 12.0 84.0 17.0 96.7 5.1 5.3 9.4 31.1 13.0 84.8 14.0 74.8 7.3 9.7 9.3 31.0 14.0 86.1 16.0 72.4 4.4 6.1 9.3 31.1 15.0 87.0 18.0 58.1 5.2 8.9 9.3 31.1 Le´on 1996 1.0 87.1 18.0 4.3 1.1 24.2 50.0 20.9 2.0 64.2 36.0 53.4 2.0 3.7 47.9 20.8 3.0 84.9 18.0 33.5 1.8 5.3 27.5 24.4 4.0 66.4 30.0 140.3 1.2 0.9 26.7 24.0 5.0 83.8 18.0 42.3 1.1 2.7 20.4 26.4 6.0 67.6 26.0 170.7 2.2 1.3 19.6 26.2 7.0 83.1 18.0 39.7 1.4 3.6 16.4 27.8 8.0 82.4 18.0 47.9 2.7 5.6 13.5 28.8 9.0 81.5 18.0 65.7 3.9 5.9 11.2 30.2 10.0 71.0 23.0 201.1 2.8 1.4 11.4 29.5 11.0 79.4 19.0 107.4 4.5 4.2 9.2 31.2 12.0 73.3 21.0 172.9 2.4 1.4 9.3 30.7 13.0 76.0 19.0 141.7 8.1 5.7 8.8 33.5 14.0 74.9 19.0 166.2 3.1 1.8 8.9 35.0
a Center of the SZA bins of ± 0.25◦
bNumber of elements within bin c Average ClO mixing ratio within bin dStandard deviation of the mean:
S(ClO)=
q
1 N(N−1)
PN
i=1(ClO−ClOi)2. The absolute error of ClO is (20–23%), even if S(ClO)
is lower due to statistics.
night-time balloon-borne measurements of OClO and NO2
in the Arctic polar vortex with model simulations shows that some uncertainties still exist in the interaction between nitro-gen and halonitro-gen species.
4 Summary and Conclusions
We have presented two balloon-borne in situ measurements of ClO conducted in late fall and late spring in the north-ern hemisphere midlatitudes stratosphere during the period of maximum total inorganic chlorine in the atmosphere. Both ClO measurements were conducted on board the TRIPLE balloon payload launched in November 1996 in Le´on, Spain,
and in May 1999 in Aire sur l’Adour, France. For both flights a vertical ClO daylight and night profile were obtained over an altitude range of approximately 15–35 km.
Using the photochemical box model version of the CLaMS model (McKenna et al., 2002a,b) simulations along 24-hour backward trajectories were presented to study the diurnal variation of ClO in the lower midlatitude stratosphere. The simulations were initialized with all available stratospheric measurements, together with tracer-tracer correlations, and information deduced from a 2-D model. The flight launched in Le´on is characterized by a more complex dynamical sit-uation (possible contribution of a mix of vortex and non-vortex air) and fewer constraints for the model calculations
Fig. 10. Calculations of 10-day backward trajectories using ERA-40 Re-Analyses wind data produced by ECMWF (European Centre for Medium-Range Weather Forecasts) for the flight launched on 14 November 1996 in Le´on.
60 65 70 75 80 85 90 95 SZA [deg] 0 1 2 3 4 5 ClO Model /ClO Meas 03−May−1999 Aire 14−Nov−1996 Leon
Fig. 11. The ratio of simulated to measured ClO mixing ratios as a function of SZA. The measured ClO mixing ratios are averaged in SZA intervals of 0.5◦centered at the SZA endpoint of each tra-jectory (cf. Table 6). The ratio ClOModel/ClOMeasis calculated for each model trajectory and for all sensitivity simulations shown in Figs. 6 and 8. The relative measurement error of ClOMeas(=ClO) for 92◦SZA for the flight launched in Le´on is very large (cf. Ta-ble 6) and is not shown here. All the ratios ClOModel/ClOMeasare in the interval 1.0+0.32/−0.03 for the Aire sur l’Adour flight (red dotted line) and in the interval 1.0+1.10/−0.45 for the Le´on flight (blue dotted line), except for SZAs larger than 86◦–87◦.
available from tracer measurements in contrast to the flight launched in Aire sur l’Adour. For the flight launched in Aire sur l’Adour 1999, the model simulations show a very good
agreement with the ClO measurements over the entire alti-tude range of 20–35 km and for both the daylight and night-time profile. The present results show that simulated ClO mixing ratios likewise reproduce the measured ClO mixing ratios for the flight launched in Le´on. A tendency that simu-lated ClO mixing ratios overestimate measured ClO mixing ratios for SZAs larger than 86◦–87◦is consistently found for both flights. In summary, we conclude that for SZAs lower than 86◦no indication can be deduced from the present ClO measurements that substantial uncertainties exist in midlati-tude chlorine chemistry of the stratosphere. For SZAs larger than 86◦–87◦further studies are required.
Acknowledgements. The authors gratefully acknowledge the
work performed by the CNES team in carrying out the balloon flights. Thanks to J. M. Russell III (Hampton University) and the HALOE team at NASA Langley Research Center for providing the HALOE V19 data, to the UK Met Office (UKMO), and to the European Centre for Medium-Range Weather Forecasts (ECMWF) for the meteorological analysis data. We thank B. Naujokat and co-workers at FU Berlin for performing the meteorological analysis for 14 November 1996 (OFP project NOVA/DATKAM, FK 01 LO9511/8). We thank I. Levin for the gas-chromatography measurements of CH4 from the air samples collected by the
cryogenic whole air sampler. A. Afchine, H. Franken, E. Klein, and V. Tan are acknowledged for technical support. The experimental activities were partly funded in the frame work of the HALOMAX project by the European Commission and in the framework of the CHORUS project by the German Ministry of Education and Research (BMBF).
References
Anderson, J. G.: The Measurement of Atomic and Diatomic Rad-icals in the Earth’s Stratosphere, Atmos. Technol., 9, 55–68, 1978.
Anderson, J. G., Margitan, J. J., and Stedman, D. H.: Atomic Chlo-rine and the ChloChlo-rine Monoxide Radical in the Stratosphere: Three in situ Observations, Science, 198, 501–503, 1977. Anderson, J. G., Grassl, H. J., Shetter, R. E., and Margitan,
J. J.: Stratospheric Free Chlorine Measured by Ballon-Borne in Situ Resonance Fluorescence, J. Geophys. Res., 85, 2869–2887, 1980.
Avallone, L. M., Toohey, D. W., Brune, W. H., Salawitch, R. J., Dessler, A. E., and Anderson, J. G.: Balloon-borne in situ mea-surements of ClO and ozone: Implications for heterogeneous chemistry and mid-latitude ozone loss, Geophys. Res. Lett., 20, 1795–1798, 1993.
Bauman, J. J., Russel, P. B., Geller, M. A., and Hamill, P.: A strato-spheric aerosol climatology from SAGE II and CLAES mea-surements: 2. Results and comparisons, 1884–1999, J. Geophys. Res., 108, 4383, doi:10.1029/2002JD00 2993, 2003.
Bonne, G. P., Stimpfle, R. M., Cohen, R. C., Voss, P. B., Perkins, K. K., Anderson, J. G., Salawitch, R. J., Elkins, J. W., S.Dutton, G., Jucks, K. W., and Toon, G. C.: An examination of the inor-ganic chlorine budget in the lower stratosphere, J. Geophys. Res., 105, 1957–1971, 2000.
Brasseur, G. and Solomon, S.: Aeronomy of the Middle Atmo-sphere, Reidel Publishing Company, Dordrecht, NL, 1984. Brune, W. H., Anderson, J. G., and Chan, K. R.: In-situ observations
of ClO in the Antarctic: ER-2 aircraft results from 54◦S to 72◦S latitude, J. Geophys. Res., 94, 16 649–16 663, 1989.
Brune, W. H., Toohey, D. W., Lloyd, S. A., and Anderson, J. G.: The sunrise and sunset variation of ClO in the lower stratosphere, Geophys. Res. Lett., 17, 509–512, 1990.
Chipperfield, M.: Multiannual simulations with a three-dimensional chemical transport model, J. Geophys. Res., 104, 1781–1805, 1999.
DeMore, W. B., Sander, S. P., Golden, D. M., Hampson, R. F., Kurylo, M. J., Howard, C. J., Ravishankara, A. R., Kolb, C. E., and Molina, M. J.: Chemical kinetics and photochemical data for use in stratospheric modeling, JPL Publication 92-20, 1992. DeMore, W. B., Sander, S. P., Golden, D. M., Hampson, R. F.,
Kurylo, M. J., Howard, C. J., Ravishankara, A. R., Kolb, C. E., and Molina, M. J.: Chemical kinetics and photochemical data for use in stratospheric modeling, JPL Publication 97-4, 1997. Engel, A., Schmidt, U., and Stachnik, R. A.: Partitioning between
chlorine reservoir species deduced from observations in the Arc-tic winter stratosphere, J. Atmos. Chem., 27, 107–126, 1997. Engel, A., Schmidt, U., Sturges, W. B., Penkett, S., Pfeilsticker, K.,
Platt, U., Stroh, F., Schiller, C., M¨uller, R., McKenna, D., Ovar-lez, J., Camy-Peyret, C., Pirre, M., and Renard, J. B.: HALO-MAX, Mid and high latitude stratospheric distribution of long and short lived halogen species during the maximum of the chlo-rine loading, Final Report, CEC Contract, ENV4 - CT97 - 0524, 1999.
Feist, D. G., Aellig, C. P., K¨ampfer, N., Solomon, P. M., Barrett, J. W., Zoonematkermani, S., Hartogh, P., Jarchow, C., and Wa-ters, J. W.: Validation of stratospheric ClO measurements from the Millimeter-wave Atmospheric Sounder (MAS), J. Geophys. Res., 105, 9053–9062, 2000.
Gidel, L. T., Crutzen, P. J., and Fishman, J.: A two-dimensional photochemical model of the atmosphere; 1: Chlorocarbon emis-sions and their effect on stratospheric ozone, J. Geophys. Res., 88, 6622–6640, 1983.
Glatthor, N., von Clarmann, T., Fischer, H., Grabowski, U., Hopfner, M., Kellermann, S., Kiefer, M., Linden, A., Milz, M., Steck, T., Stiller, G. P., Tsidu, G. M., Wang, D. Y., and Funke, B.: Spaceborne ClO observations by the Michelson Interferome-ter for Passive Atmospheric Sounding (MIPAS) before and dur-ing the Antarctic major warmdur-ing in September/October 2002, J. Geophys. Res., 109, D11 307, 2004.
Grooß, J.-U.: Modelling of Stratospheric Chemistry based on HALOE/UARS Satellite Data, PhD thesis, University of Mainz, 1996.
Grooß, J.-U., G¨unther, G., Konopka, P., M¨uller, R., McKenna, D. S., Stroh, F., Vogel, B., Engel, A., M¨uller, M., Hoppel, K., Bevilacqua, R., Richard, E., Webster, C. R., Elkins, J. W., Hurst, D., Romashkin, P. A., and Baumgardner, D. G.: Simulation of ozone depletion in spring 2000 with the Chemical Lagrangian Model of the Stratosphere (CLaMS), J. Geophys. Res., 107, 8295, doi:10.1029/2001JD000 456, 2002.
King, J. C., Brune, W. H., Toohey, D. W., Rodriguez, J. M., Starr, W. L., and Vedder, J. F.: Measurements of ClO and O3from
21◦to 61◦N in the lower stratosphere during February 1988: Im-plications for heterogeneous chemistry, Geophys. Res. Lett., 18, 2273–2276, 1991.
Knudsen, B. M. and Grooß, J. U.: Northern midlatitude strato-spheric ozone dilution in spring modeled with simulated mixing, J. Geophys. Res., 105, 6885–6890, 2000.
Manney, G. L., Lahoz, W. A., Swinbank, R., O’Neill, A., Con-new, P. M., and Zurek, R. W.: Simulation of the December 1998 stratospheric major warming, Geophys. Res. Lett., 26, 2733– 2736, 1999.
Marchand, M., Bekki, S., Lef`evre, F., Hauchecorne, A., Godin-Beckmann, S., and Chipperfield, M. P.: Model simulations of the northern extravortex ozone column: Influence of past changes in chemical composition, J. Geophys. Res., 109, D02310, doi:10.1029/2003JD00 3634, 2004.
McKenna, D. S., Grooß, J.-U., G¨unther, G., Konopka, P., M¨uller, R., Carver, G., and Sasano, Y.: A new Chemical Lagrangian Model of the Stratosphere (CLaMS): Part II Formulation of Chemistry-Scheme and Initialisation, J. Geophys. Res., 107, 4256, doi:10.1029/2000JD000 113, 2002a.
McKenna, D. S., Konopka, P., Grooß, J.-U., G¨unther, G., M¨uller, R., Spang, R., Offermann, D., and Orsolini, Y.: A new Chemical Lagrangian Model of the Stratosphere (CLaMS): Part I Formu-lation of Advection and Mixing, J. Geophys. Res., 107, 4309, doi:10.1029/2000JD000 114, 2002b.
Menzies, R. T.: Remote Measurement of ClO in the Stratosphere, Geophys. Res. Lett., 6, 151–154, 1979.
Michelsen, H. A., Manney, G. L., Gunson, M. R., and Zander, R.: Correlations of stratospheric abundances of NOy, O3, N2O,
and CH4derived from ATMOS measurements, J. Geophys. Res., 103, 28 347–28 359, 1998.
Nickolaisen, S. L., Sander, S. P., and Friedl, R. R.: Pressure-dependent yields and product branching ratios in the broadband photolysis of chlorine nitrate, J. Phys. Chem., 100, 10 165– 10 178, 1996.
Osterman, G. B., Salawitch, R. J., Sen, B., Toon, G. C., Stachnik, R. A., Pickett, H. M., Margitan, J. J., Blavier, J.-F., and Peter-son, D. B.: Balloon-borne measurements of stratospheric rad-icals and their precursors: Implications for the production and loss of ozone, Geophys. Res. Lett., 24, 1107–1110, 1997. Pierson, J. M., McKinney, K. A., Toohey, D. W., Margitan, J.,
Schmidt, U., Engel, A., and Newman, P. A.: An investigation of ClO photochemistry in the chemically perturbed Arctic vortex, J. Atmos. Chem., 32, 61–81, 1999.
Ricaud, P., Chipperfield, M. P., Waters, J. W., Russel III, J. M., and Roche, A. E.: Temporal evolution of chlorine monoxide in the middle stratosphere, J. Geophys. Res., 105, 9053–9062, 2000. Rivi`ere, E. D., Pirre, M., Berthet, G., Renard, J.-B., Taupin, F. G.,
Huret, N., Chartier, M., Knudsen, B., and Lef`evre, F.: On the in-teraction between nitrogen and halogen species in the Artic polar vortex during THESEO and THESEO 2000, J. Geophys. Res., 108, 8311, doi:10.1029/2002JD00 2087, 2003.
Russell, J. M., Gordley, L. L., Park, J. H., Drayson, S. R., Tuck, A. F., Harries, J. E., Cicerone, R. J., Crutzen, P. J., and Frederick, J. E.: The Halogen Occultation Experiment, J. Geophys. Res., 98, 10 777–10 797, 1993.
Salawitch, R. J., Wofsy, S., Wennberg, P. O., Cohen, R. C., An-derson, J. G., Fahey, D. W., Gao, R. S., Keim, E. R., Wood-bridge, E. L., Stimpfle, R. M., Koplow, P., Kohn, D. W., Webster, C. R., May, R. D., Pfister, L., Gottlieb, E. W., Michelsen, H. A., Yue, G. K., Prather, M. J., Wilson, J. C., Brock, C. A., Jonsson, H. H., Dye, J. E., Baumgardner, D., Proffitt, M. H., Loewenstein, M., Podolske, J. R., Elkins, J. W., Dutton, G. S., Hintsa, E. J., Dessler, A. E., Weinstock, E. M., Kelly, K. K., Boering, K. A., Daube, B. C., Chan, K. R., and Bowen, S. W.: The diurnal vari-ation of hydrogen, nitrogen, and chlorine radicals: implicvari-ations for the heterogeneous production of HNO2, Geophys. Res. Lett.,
21, 2551–2554, 1994.
Sander, S. P., Friedl, R. R., Golden, D. M., Kurylo, M. J., Huie, R. E., Orkin, V. L., Moortgat, G. K., Ravishankara, A. R., Kolb, C. E., Molina, M. J., and Finlayson-Pitts, B. J.: Chemical kinet-ics and photochemical data for use in stratospheric studies, JPL Publication 02-25, 2002.
Schiller, C., Bauer, R., Cairo, F., Deshler, T., D¨ornbrack, A., Elkins, J., Engel, A., Flentje, H., Larsen, N., Levin, I., M¨uller, M., Olt-mans, S., Ovarlez, H., Ovarlez, J., Schreiner, J., Stroh, F., Voigt, C., and V¨omel, H.: Dehydration in the Arctic stratosphere during the THESEO2000/SOLVE campaigns, J. Geophys. Res., 107, 8293, doi:10.1029/2001JD000 463, 2002.
Schmidt, U., Kulessa, G., Klein, E., R¨oth, E.-P., Fabian, P., and Borchers, R.: Intercomparison of balloon-borne cryogenic whole air samplers during the MAP/GLOBUS 1983 campaign, Planet Space Sci., 35, 647–656, 1987.
Schmidt, U., Bauer, R., Engel, A., Borchers, R., and Lee, J.: The variation of available chlorine Cly in the Arctic polar vortex dur-ing EASOE, Geophys. Res. Lett., 21, 1215–1218, 1994. Sen, B., Osterman, G., Salawitch, R., Toon, G., Margitan, J.,
Blavier, J., Chang, A., May, R., Webster, C., Stimpfle, R., Bonne, G., Voss, P., Perkins, K., Anderson, G., Cohen, R., Elkins, J., Dutton, G., Hurst, D., Romashkin, P., Atlas, E., Schauffler, S., and Loewenstein, M.: The budget and partitioning of strato-spheric chlorine during the 1997 Arctic summer, J. Geophys. Res., 104, 26 653–26 665, 1999.
Stimpfle, R. M., Koplow, J. P., Cohen, R. C., Kohn, D. W.,
Wennberg, P. O., Judah, D. M., Toohey, D. W., Avallone, L. M., Anderson, J. G., J.Salawitch, R., Woodbridge, E. L., Webster, C. R., May, R. D., Proffitt, M. H., Aiken, K., Margitan, J., Loewenstein, M., Podolske, J. R., Pfister, L., and Chan, K. R.: The response of ClO radical concentrations to variations in NO2
radical concentrations in the lower stratosphere, Geophys. Res. Lett., 21, 2543–2546, 1994.
Stimpfle, R. M., Cohen, R. C., Bonne, G. P., Voss, P. B., Perkins, K. K., Koch, L. C., Anderson, J. G., Salawitch, R. J., Lloyd, S. A., Gao, R. S., DelNegro, L. A., Keim, E. R., , and Bui, T. P.: The coupling of ClONO2, ClO and NO2in the lower stratosphere
from in situ observations using the NASA ER-2 aircraft, J. Geo-phys. Res., 104, 26 705–26 714, 1999.
Sugita, T., Kondo, Y., Nakajima, H., Schmidt, U., Engel, A., Oelhaf, H., Wetzel, G., Koike, M., and Newman, P. A.: Denitrification observed inside the Arctic vortex in February 1995, J. Geophys. Res., 103, 16 221–16 233, 1998.
Toohey, D. W., Brune, W. H., Chan, K. R., and Anderson, J. G.: In situ measurements of midlatitude ClO in winter, J. Geophys. Res., 18, 21–24, 1991.
Toohey, D. W., Avallone, L. M., Allen, N. T., Demusz, J. N., Hazen, J. N., Hazen, N. L., and Anderson, J. G.: The performance of a new instrument for in situ measurements of ClO in the lower stratosphere, Geophys. Res. Lett., 20, 1791–1794, 1993a. Toohey, D. W., Avallone, L. M., Lait, L. R., Newman, P. A.,
Schoe-berl, M. R., Fahey, D. W., Woodbrige, E. L., and Anderson, J. G.: The seasonal evolution of reactive chlorine in the northern hemi-sphere stratohemi-sphere, Science, 261, 1134–1136, 1993b.
Urban, J., Lautie, N., Flochmoen, N. L., Murtagh, D., Ricaud, P., Noe, J. D. L., Dupuy, E., Drouin, A., Amraoui, L. E., Eriks-son, P., Frisk, U., Jimenez, C., Kyrola, E., Llewellyn, E. J., and Megie, G.: The northern hemisphere stratospheric vortex during the 2002/03 winter: Subsidence, chlorine activation and ozone loss observed by the Odin Sub-Millimetre Radiometer, Geophys. Res. Lett., 31, 2004.
Vogel, B., M¨uller, R., Deshler, T., Grooß, J.-U., Karhu, J., McKenna, D. S., M¨uller, M., Toohey, D., Toon, G. C., and Stroh, F.: Vertical profiles of activated ClO and ozone loss in the Arctic vortex in January and March 2000: In situ obser-vations and model simulations, J. Geophys. Res., 108, 8334, doi:10.1029/2002JD00 256, 2003.
Wang, H. J., Cunnold, D. M., Thomason, L. W., Zawodny, J. M., and Bodeker, G. E.: Assessment of SAGE ver-sion 6.1 ozone data quality, J. Geophys. Res., 107, 4691, doi:10.1029/2002JD00 2418, 2002.
Wennberg, P. O., Cohen, R. C., Stimpfle, R. M., Fahey, D. W., Web-ster, C. R., Salawitch, R. J., Proffitt, M. H., Chan, K. R., Ander-son, J. G., and Wofsy, S. C.: The removal of lower stratospheric ozone by free radical catalysis: In situ measurements of OH, HO2, NO, NO2, ClO, and BrO, Science, 266, 398–404, 1994.
WMO: Scientific assessment of ozone depletion: 1994, Report No. 37, Geneva, Switzerland, 1995.
WMO: Scientific assessment of Ozone Depletion: 2002, Report No. 47, Geneva, Switzerland, 2003.
Woyke, T., M¨uller, R., Stroh, F., McKenna, D. S., Engel, A., Mar-gitan, J. J., Rex, M., and Carslaw, K. S.: A test of our under-standing of the ozone chemistry in the Arctic polar vortex based on in-situ measurements of ClO, BrO, and O3 in the 1994/95 winter, J. Geophys. Res., 104, 18 755–18 768, 1999.