HAL Id: hal-02277978
https://hal.univ-lille.fr/hal-02277978
Submitted on 27 Sep 2019
HAL is a multi-disciplinary open access
archive for the deposit and dissemination of sci-entific research documents, whether they are pub-lished or not. The documents may come from teaching and research institutions in France or abroad, or from public or private research centers.
L’archive ouverte pluridisciplinaire HAL, est destinée au dépôt et à la diffusion de documents scientifiques de niveau recherche, publiés ou non, émanant des établissements d’enseignement et de recherche français ou étrangers, des laboratoires publics ou privés.
Sathya Narayanasamy, Patrick Jollivet, Nicole Godon, Frédéric Angeli, S. Gin,
Martiane Cabié, Julien Cambedouzou, Corentin Le Guillou, Abdesselam
Abdelouas
To cite this version:
Sathya Narayanasamy, Patrick Jollivet, Nicole Godon, Frédéric Angeli, S. Gin, et al.. Influence of composition of nuclear waste glasses on vapor phase hydration. Journal of Nuclear Materials, Elsevier, 2019, Journal of Nuclear Materials, pp.53-71. �10.1016/j.jnucmat.2019.07.015�. �hal-02277978�
Influence of composition of nuclear waste glasses on vapor phase hydration
Sathya Narayanasamy, Patrick Jollivet, Nicole Godon, Frédéric Angeli, Stéphane Gin, Martiane Cabié, Julien Cambedouzou, Corentin Le Guillou, Abdesselam Abdelouas PII: S0022-3115(19)30397-6
DOI: https://doi.org/10.1016/j.jnucmat.2019.07.015
Reference: NUMA 51715
To appear in: Journal of Nuclear Materials
Received Date: 1 April 2019 Revised Date: 12 July 2019 Accepted Date: 14 July 2019
Please cite this article as: S. Narayanasamy, P. Jollivet, N. Godon, Fréé. Angeli, Sté. Gin, M. Cabié, J. Cambedouzou, C. Le Guillou, A. Abdelouas, Influence of composition of nuclear waste glasses on vapor phase hydration, Journal of Nuclear Materials (2019), doi: https://doi.org/10.1016/j.jnucmat.2019.07.015. This is a PDF file of an unedited manuscript that has been accepted for publication. As a service to our customers we are providing this early version of the manuscript. The manuscript will undergo copyediting, typesetting, and review of the resulting proof before it is published in its final form. Please note that during the production process errors may be discovered which could affect the content, and all legal disclaimers that apply to the journal pertain.
M
AN
US
CR
IP
T
AC
CE
PT
ED
1 Influence of composition of nuclear waste glasses on vapor phase hydration1
Sathya Narayanasamya, Patrick Jolliveta, Nicole Godona, Frédéric Angelia, Stéphane Gina, Martiane Cabiéb,
2
Julien Cambedouzouc,d, Corentin Le Guilloue, Abdesselam Abdelouasf
3
a CEA Marcoule, DEN, MAR, DE2D, SEVT/LCLT, bât 208, BP17171, 30207 Bagnols sur Cèze cedex, France
4
b Aix Marseille Univ, CNRS, Centrale Marseille, FSCM, CP2M, Marseille France
5
c ICSM, CEA, CNRS, ENSCM, Univ. Montpellier, Marcoule, France
6
d
IEM, CNRS, ENSCM, Univ. Montpellier, Montpellier, France 7
e
UMET-Unité Matériaux et Transformations, CNRS UMR 8207, Université de Lille, 59655 Villeneuve 8
d’Ascq, France 9
f SUBATECH, CNRS-IN2P3, IMT Atlantique-Université de Nantes, 4 rue Alfred Kastler, BP 20722, 44307
10
Nantes cedex 03, France 11
Abstract 12
For the first time, the influence of glass composition on the vapor hydration kinetics of the French AVM 13
nuclear waste glass simulants was investigated. Three complex borosilicate glasses (> 20 oxides) along 14
with three simplified Na/(Ca, Na)/(Mg, Na)-alumino-borosilicate glasses with four or five oxides were 15
altered at 50°C in water vapor (95% RH) for up to 557 days. The solid characterization of the altered 16
samples (by SEM, TEM, XRD, ToF-SIMS, SAXS) revealed that the rate-controlling vapor hydration 17
mechanism is composition dependent. The vapor hydration rate of the more durable glasses, whose 18
molar ratio of Al2O3/(CaO or MgO) is ≥1, seems to be limited by network-hydrolysis, whereas the overall
19
glass alteration rate of the less durable glasses, whose Al2O3/MgO ratio is <1, seems to be driven by the
20
precipitation of Mg-rich secondary phases. All the vapor hydrated glasses show the presence of a 21
homogeneous gel layer of a few tens of nm thickness. The more durable glasses have a smaller quantity 22
of secondary phases precipitated on their surface. The less durable glasses have a relatively significant 23
quantity of secondary phases precipitated above the gel layer and irregularly shaped, scattered and 24
highly porous altered zones formed beneath the gel layer. The overall alteration rate of the less durable 25
glasses was 10-20 times faster than the more durable glasses. For all glasses, FTIR spectroscopy indicated 26
an inflexion in the vapor hydration rate after 120-200 days of alteration, likely due to a passivating effect 27
of the altered layer formed under unsaturated conditions. The average pore size of the altered layer in 28
M
AN
US
CR
IP
T
AC
CE
PT
ED
2 certain vapor hydrated glasses measured by SAXS is similar to the pore sizes of the gel layer formed in 29aqueous medium and varies very slightly with glass composition. 30
1. Introduction 31
The high-level activity radioactive waste (HLW), issued from the nuclear power industry, is immobilized 32
in a vitreous matrix, since glass has been proven to be a stable solid form for thousands of years based 33
on archeological or geological evidence [1, 2]. According to the permanent nuclear waste disposal 34
solution envisaged by ANDRA (the French national radioactive waste management agency), the waste 35
glass packages (glass in a stainless steel canister encased in a low-alloy steel overpack) will be stored in 36
an underground repository constructed with steel and concrete reinforcements in clay layer 500 m 37
beneath the earth’s surface. The steel corrosion in the closed underground repository would result in 38
hydrogen gas liberation. As a result, the re-saturation of the site with ground water from the surrounding 39
clay medium will be slowed down. Consequently, it is expected that nuclear waste glasses maybe 40
exposed to an unsaturated medium for up to tens of thousands of years before being completely 41
immersed in aqueous ground water [3]. Therefore it is mandatory to investigate the consequences of 42
glass alteration in vapor phase, the mechanisms involved and the influence of intrinsic and extrinsic 43
parameters [4]. Glass alteration in vapor phase has been relatively less studied in comparison to 44
alteration in aqueous medium [5-15]. 45
Vapor hydration experiments on a variety of nuclear waste glasses and their non-radioactive surrogates 46
have been conducted by different laboratories in USA [16-26], UK [27] and France [28-33]. From the 47
experimental results so far, it can be understood that the reactions occurring between glass and water 48
are the same for alteration in aqueous medium and unsaturated water vapor. However, the rate 49
controlling reaction mechanism and the driving force for alteration are different in both cases. The 50
difference arises largely due to the very small volume of water in vapor phase and almost no leaching by 51
solution, unless water condenses and flows away from the altered surface. The precipitation of 52
secondary phases seems to be the strongest driving force for alteration in vapor phase at high 53
temperature. A majority of the vapor hydration studies conducted so far have been done in extreme 54
conditions (150-200°C & 100% relative humidity (RH)) favorable for secondary phases precipitation. This 55
temperature range is not representative of the expected scenario in the French geological disposal 56
facility. It is expected that the temperature of the waste glass packages will be lower than or equal to 57
50°C [34]. The vapor hydration of SON68 (French inactive reference nuclear waste glass) at high 58
temperatures (90-200°C, activation energy (Ea)=43-47 KJ/mol) [28] and lower temperatures (35-90°C,
M
AN
US
CR
IP
T
AC
CE
PT
ED
3 Ea=34±0.4 KJ/mol) [31] suggests that the rate-controlling mechanisms may depend on temperature. The60
limited data of the studies have also confirmed the influence of relative humidity [16], glass composition 61
[22, 27, 35-37], composition of the vapor phase [30] and radioactivity [38] on vapor hydration kinetics. 62
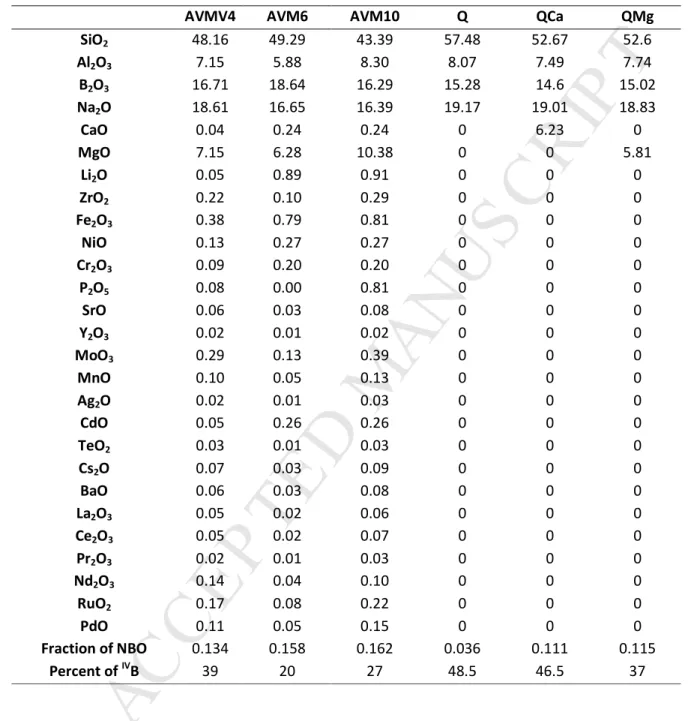
Insights on glass alteration in vapor phase can also be obtained from studies on atmospheric alteration 63
of window glasses, art crafts, stained-glass windows of historic sites etc. [39-41]. Almost all these studies 64
have shown similar altered layer morphology on the glass surface in contact with an unsaturated 65
medium. An altered layer, commonly referred to as ‘gel layer’, is formed adjacent to pristine glass. This 66
gel layer has been suggested to be formed by mechanisms of hydration (penetration of water molecules) 67
[37] / inter-diffusion ((≡ − ) + → (≡ − ) + ) [40, 42] / network
68
hydrolysis ((≡ − − ≡) + → 2 (≡ − ) ) [31, 43, 44] or a combination of
69
these mechanisms [39, 41]. Localized dissolution-precipitation or condensation mechanisms and re-70
organization of the gel layer have also been discussed in literature [31, 39]. On the surface of this gel 71
layer, amorphous / crystalline secondary precipitates maybe present [23, 31, 36]. In certain cases, the 72
secondary phases may also accelerate the vapor hydration kinetics [22]. 73
In this article, the focus is on the influence of glass composition on vapor hydration. Through literature 74
survey, it can be understood that glass composition can affect glass durability in three ways. (i) The 75
presence of alkaline elements in the glass can promote the quantity of water adsorbed on surface, 76
facilitate inter-diffusion mechanism and may result in increased hydration rate [22, 37, 45]. (ii) Glass 77
composition plays an important role in the precipitation of secondary phases under given conditions and 78
thus may accelerate glass alteration [22, 35]. (iii) Presence of elements such as Zn, which increases the 79
resistance to network hydrolysis, may increase glass durability in vapor phase [27]. The literature study 80
led us to understand that certain elements such as Al may have a dual role depending on whether the 81
conditions are favorable for secondary phase precipitation (negative effect) or if they participate in 82
increasing the resistance of glass network to hydrolysis (positive effect). Therefore, the temperature of 83
the experiments needs to be carefully chosen, as the influence of the glass composition on its alteration 84
could vary with temperature. 85
In this study, the influence of nuclear waste glass composition on vapor hydration has been investigated 86
by studying the behavior of three AVM (Atelier de Vitrification de Marcoule) glasses in contact with water 87
vapor. The AVM glasses are complex borosilicate glasses containing more than 20 oxides including fission 88
products issued from the UNGG (Uranium Naturel Graphite-Gaz) reactor at Marcoule. The range in the 89
AVM glasses composition is extensive due to the variation in the composition of fission products 90
M
AN
US
CR
IP
T
AC
CE
PT
ED
4 solution. The long-term behavior of these HLW radioactive glasses in aqueous media was studied using 91many inactive surrogates [46, 47]. Based on this study, the glasses AVM6, AVM10 and AVMV4 are the 92
three inactive surrogates selected for the current study. AVM6 is known to alter at the highest residual 93
rate (rr) in deionized water at 50°C and AVM10 alters at the lowest rr. AVMV4 is a simulant of the actual
94
composition of the HLW glass produced at Marcoule facility. 95
The specific influence of alkaline-earth elements such as Mg and Ca was investigated, since AVM glasses 96
contain a significant amount of Mg and very little Ca and the effects of these elements on glass alteration 97
rate in aqueous medium are relatively well-known [48-52]. Based on literature review, it is expected that 98
these elements would be detrimental to glass durability in unsaturated medium due to their tendency to 99
form secondary precipitates. The study of their specific influence cannot be carried out using a complex 100
glass with several oxides due to possible interference and synergies between other elements. Therefore, 101
three simplified glasses (Q, QCa and QMg) were prepared based on the Si/Al stoichiometry of AVMV4. 102
The use of simplified glass compositions helps to understand the role of specific element on glass 103
durability [53-56]. 104
The fission products loading of AVM glasses suggests that the temperature of the glass packages during 105
the expected time of exposure to water vapor will be around 50°C. Therefore, it was decided to conduct 106
our experiments at 50°C. It is suspected that the rate-controlling vapor hydration mechanisms may vary 107
with conditions favorable for precipitations of certain silica-rich secondary phases at higher 108
temperatures (>90°C). The relative humidity (RH) was chosen to be 95% since the conditions expected in 109
the repository are close to saturation [34]. 110
2. Materials and methods 111
2.1 Sample preparation
112
The synthesis of the AVM glasses has already been described by Thien [46]. The glass samples for this 113
study were retrieved from the same batch. Q, QCa and QMg were prepared using the oxide precursors 114
(SiO2, H3BO3, Na2CO3, Al2O3, CaO (for QCa) and MgO (for QMg)). The mixtures were put in a Pt-Rh
115
crucible and heated during 3 h at 1450°C. They were then annealed at 620°C during 1 h in a graphite 116
crucible. Afterwards, the temperature of the furnace was decreased at a rate of 0.5°C/min until 300°C 117
and then it was turned off. The compositions of the glasses after dissolution in acid solution were 118
determined by Inductively Coupled Plasma-Optical Emission Spectroscopy (ICP-OES). The data in mol% 119
oxides are provided in table 1. The error percentage associated with the measured values is 3%. The 120
M
AN
US
CR
IP
T
AC
CE
PT
ED
5 fraction of Non-Bridging Oxygen (NBO) atoms in the glass network was theoretically calculated based on 121equation 2.1.1 and equation 2.1.2. 11B NMR spectra (not presented here) were collected on a Bruker
122
Avance II 500WB spectrometer. The calculated NBO values and the fraction of B(IV) for each glass are
123
provided in table 1. The error associated varies between 3 to 8%. 124 = ∗( . !"# #" $ " % . !"# % & '(" "% $) $ * % " %) +(,) Equation 2.1.1 125 ( ) = ∑(./. /0 /1234. 56/78 . 1 7/:4;<:4 /0 /1 =4 ∗ 7/: 0>. /0 /1 =4) Equation 2.1.2 126
For all glasses, the NBO values are similar despite their differences in compositions (except Q). The 127
percentage of B(IV) in each glass shows that Mg is less efficient to compensate [BO
4]- entities than Ca.
128 129
For each glass, two monoliths of dimensions (2.5x2.5x0.1 cm3) were prepared for vapor hydration during
130
180 days and 557 days, respectively. These monoliths were cut from the glass bars and polished to 131
optical finish (surface roughness <<1 µm) on both faces. Similarly, one polished monolith for each glass 132
was also prepared with dimensions (2.5x2.5x0.08 cm3) for the purpose of studying hydration kinetics
133
using Fourier Transform Infrared (FTIR) spectroscopy. All the glass monoliths were washed in ultra-pure 134
acetone and absolute ethanol under ultrasonic agitation and dried for a few hours in an oven at 50°C 135
before starting the experiment. Powder samples of each glass were prepared by crushing glass pieces 136
using Retsch MM400 ball-mill apparatus equipped with tungsten carbide balls. The size fraction of 2 – 5 137
µm were separated using pure acetone solvent and the application of Stokes law, for Small Angle X-ray 138
Scattering (SAXS) measurement. 139
2.2 Alteration Protocol
140
A WEISS WKL64 climatic chamber was used to hydrate the samples at 50°C and 95% RH. The apparatus 141
continuously monitors and displays the temperature and RH in the test zone. De-mineralized water is 142
used to produce steam and then de-humidified to have the programmed RH in the test zone. The 143
monolithic glass samples are placed horizontally in a curved grid Teflon basket that allows the sample to 144
be exposed to vapor on both faces. The glass powders were dispersed in plastic petri dishes. Similar 145
protocol for vapor hydration of glasses has been used before in literature [39]. 146
M
AN
US
CR
IP
T
AC
CE
PT
ED
6 2.3 Experiments 147 2.3.1 Hydration kinetics 148A glass monolith of dimensions (2.5 x 2.5 x 0.08 cm3) was placed in the climatic chamber at 50°C and 95%
149
RH. The sample was removed periodically (approximately once a month) for a short duration (~10 150
minutes) and analyzed in transmission mode using a Vertex 70 FTIR spectrometer. It was then replaced 151
in the chamber to continue hydration. Five spectra at different regions of the monolith were recorded 152
and averaged. The diameter of the diaphragm was set to 6 mm. The spectra were recorded from 4000 to 153
400 cm-1. The deconvolution of the spectra from 4000 to 2600 cm-1 into five Gaussian bands was
154
attributed to the vibration of the OH stretching mode in SiOH molecules (~3595-3605 cm-1), bound
155
water-silanol groups (~3515-3518 cm-1 & ~3170-3185 cm-1), symmetrical OH stretching mode in the free 156
water molecule (~3400-3415 cm-1) and the glass matrix (~2700 cm-1). This type of deconvolution is based
157
on the protocol used to follow vapor hydration kinetics using infrared spectroscopy in recent literature 158
[29, 32, 57, 58]. The hydration kinetics was followed by studying the evolution of the increase in 159
absorbance of the band attributed to the OH stretching mode in SiOH molecules over time. 160
Calculation of error in the increase in absorbance values: With every deconvolution, the standard error 161
associated with the increase in the area of the Gaussian is calculated by Origin software. The error values 162
for the Gaussian fit are less than 2%. However, while measuring the FTIR spectrum at 5 different places 163
for the same sample, the sample compartment is opened and closed. Due to this the background that 164
was earlier measured is disturbed. Therefore, several backgrounds were measured throughout the day 165
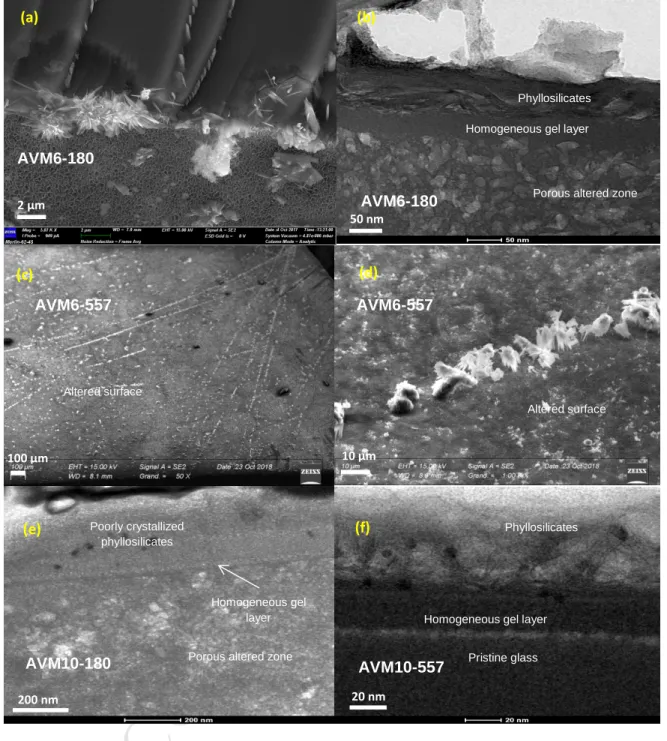
of the FTIR analysis, and the standard deviation among the absorbance values in the range of 166
wavenumbers 3595-3605 cm-1 was used to calculate the error value. After error propagation calculation,
167
0.02 (a.u.) was calculated as the error value. 168
2.3.2 Characterization of altered glasses
169
For each composition, two glass monoliths of dimensions (2.5 x 2.5 x 0.1 cm3) and the glass powders 170
were placed in the climatic chamber at 50°C and 95% RH for a period of 180 days and 557 days 171
respectively. Afterwards, the monoliths were removed from the chamber and cut into dimensions of 172
(1x1x0.1 cm3) approximately for characterization by Scanning Electron Microscope (SEM), Transmission 173
Electron Microscope (TEM), X-Ray Diffraction (XRD) and Time-of-Flight Secondary Ion Mass Spectrometry 174
(ToF-SIMS). The glass powders were characterized by Small Angle X-ray Scattering (SAXS) to probe the 175
porosity and the pore-size of the gel layer. 176
M
AN
US
CR
IP
T
AC
CE
PT
ED
7 For the purpose of studying the evolution of pore characteristics of the gel layer with time, the 177powdered samples of AVM6 were altered for 11 days, 31 days and 90 days at 50°C and 95% RH, in 178
addition to the standard alteration time of 180 days and 557 days. These samples were characterized by 179 SAXS. 180 2.4 Characterization techniques 181 2.4.1 SEM 182
Morphological analysis of the altered samples were carried out using a field emission Scanning Electron 183
Microscope (SEM) Zeiss Gemini Supra 55, JEOL JSM 6330F with an Energy Dispersive Spectroscopy (EDS) 184
system. 185
2.4.2 TEM
186
FEI TECNAÏ G2 Transmission Electron Microscope (TEM) was used for morphological and chemical 187
analysis. The 80 kV to 200 kV TEM permits to do conventional imaging and analytics, disposes of bright-188
field and dark-field imaging, EDS and Scanning TEM (STEM) to probe chemical composition of materials. 189
The spatial resolution is 0.27 nm. Ultra-thin samples for observation by TEM (the length of the sample is 190
approx. 5 µm and it is about one hundred nm thick) were prepared using Dual Beam FIB (FEI Helios 600 191
NanoLab). The uncertainty associated with the quantitative STEM-EDX analyses was estimated to be 192
around 12% relative error. Scanning transmission electron microscopy (STEM) and EDS mapping were 193
performed on QMg sample altered for 180 days using a Thermofisher Titan Themis 300 microscope 194
operated at 300 keV, located at the “Centre Commun de Microscopie – CCM” at the university of Lille. 195
Hyperspectral EDS data were obtained using the super-X detector system equipped with four 196
windowless silicon drift detectors. The probe current was set at 50 pA. The analysis of the hyperspectral 197
data was performed using the Hyperspy python-based package [59]. The signal was first denoised using 198
Principal Component Analysis (PCA). Then, the EDS spectra at each pixel were fitted by a series of 199
Gaussian functions and a physical model for background/bremsstrahlung. Quantification was performed 200
thanks to the Cliff-Lorimer method, using experimentally determined k-factors and absorption correction 201
routines. 202
2.4.3 XRD
203
Crystalline secondary phases were identified using a Philips X’Pert diffractometer X-Ray Diffraction (XRD) 204
apparatus equipped with a copper tube and a goniometer (4-80° 2θ, step size 0.01744°). Each glass 205
monolith was analyzed for 12 h on a multiple purpose sample stage (MPSS). 206
M
AN
US
CR
IP
T
AC
CE
PT
ED
8 2.4.4 ToF-SIMS 207The behavior of elements in the altered layer was characterized using ToF-SIMS (SSIMS on TOF 5 208
(IONTOF)). Depth profiles of secondary positive ions were obtained by alternating analysis and abrasion 209
cycles. 25 keV Bi1+ primary ions at 2 pA current were used for analysis cycles. 1 keV primary O2+ ions at
210
250 nA current were used for the abrasion cycles. The eroded area was 200x200 μm2. The analyzed area
211
was 60x60 μm2 for the samples altered for 180 days and 50x50 μm2 for the samples altered for 557 days. 212
The surface charge was neutralized on the monoliths by a pulsed low-energy (<20 keV) electron flux. The 213
depth calibration was carried out using the abrasion rate and a mechanical profilometer to measure the 214
crater depth at the end of the analysis. It is to be noted that the same abrasion rate was used for 215
analyzing the gel layer and the pristine glass. This choice was justified by the good correspondence 216
between thickness of altered layer measured by SEM and ToF-SIMS in other works [31]. 217
The profiles were normalized with respect to the intensity of each element (?) in the pristine glass 218
(denoted as PG) and with respect to the intensity of Si (?@") at given depth as shown in the equation 219 2.4.4.1 below. 220 />75: A4= .64.8 62 = B BCD (BCDB)EF Equation 2.4.4.1 221 G:64>4= :524> =4H6ℎ = 1J 56 Kℎ ;ℎ L0.5 − BO BCD PBOBCDQ EF = 0R Equation 2.4.4.2 222
In literature, the most immobile element in the glass network is used for normalization of ToF-SIMS 223
profiles to avoid matrix effects, which could be either Si or Zr [60, 61]. In our experiments, Si can be 224
considered immobile. This is valid after verification that Si bearing phases are in relatively small quantity. 225
It was chosen as the element for normalization since it is present in a sufficiently large quantity in the 226
glass, such that the precipitation of secondary phases on the glass surface will not result in depletion of a 227
large fraction of this element. 228
Boron is a good tracer for glass alteration in aqueous medium since it is neither retained in the gel layer 229
nor forms secondary phases. In vapor phase it would be logical to expect that the retention of boron in 230
the gel layer is much higher since the quantity of water available to leach boron is highly limited. 231
However, the ToF-SIMS profiles indicate that the retention of boron in the gel layers is very limited (< 232
20%). Therefore, boron is used as a tracer to measure altered layer thickness in the vapor hydration 233
M
AN
US
CR
IP
T
AC
CE
PT
ED
9 phenomenon as well. The thickness of the altered layer was determined based on the profile of boron as 234shown in equation 2.4.4.2. The thickness of the zone of interface between gel layer and pristine glass 235
measured by ToF-SIMS could be influenced by sample artefacts such as surface roughness of the sample 236
due to precipitates or due to the heterogeneity of the altered layer. 237
2.4.5 SAXS
238
The apparatus used is a SAXS-Mo apparatus emitting monochromatic X-ray beam at λ 0.709 Å and the 239
photon flux is 3x10⁶ photons.s-1 approximately. The q-range covered is 0.2 to 30 nm-1. The distance scale 240
D is related to the scattering vector q by the formula D = 2π/q. The sample was filled in a glass capillary 241
tube of 2 mm (4 ) diameter and approximately 10 µm wall thickness. In the section of the sample 242
analyzed, the inter-grain porosity is filled with air. The inner porosity of each grain could be filled with air 243
or water. The data treatment for a porous or granular medium with special attention to the case of glass 244
leaching by water was handled by Spalla et al. 2003 [62]. The data treatment was based on previous 245
works [62-64] and is explained in detail in the supplementary data (section1). 246
247
3. Results 248
The solid characterization of the altered glass has given insights into the morphology of the altered layer, 249
behavior of elements in the altered layer, porosity of the altered layer and the vapor hydration kinetics. 250
In each subsection, the results of all six glasses have been presented. An overall analysis of the results 251
showed that the behavior of the altered glasses AVM6 and AVM10 is similar and that of AVMV4 and 252
QMg is similar. For this reason, the results of these two couples of glasses have been presented together 253
in section 3.1 and section 3.3. The Q and QCa glasses, which do not contain Mg, are also presented 254
following the four above mentioned Mg-containing glasses. 255
3.1 Morphology of the altered layer (SEM/TEM images)
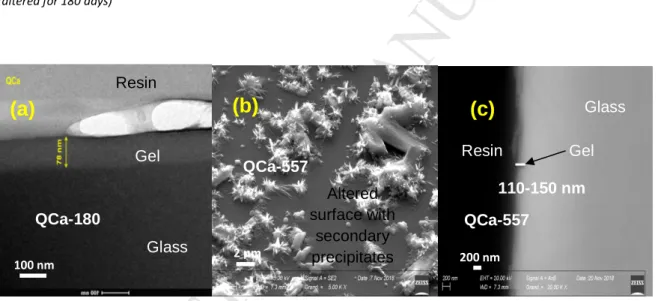
256
3.1.1 AVM6 and AVM10
257
The SEM images showed that the alteration of these two glasses is similar in the following 258
accounts: 259
(i) Irregular alteration: SEM images of cross-sections showed that both glasses had altered in a 260
heterogeneous manner. Figure 1 shows the SEM and TEM cross-sections of AVM6 and AVM10 altered 261
for 180 days and 557 days (denoted hereafter as AVM6-180, AVM6-557, AVM10-180 and AVM10-557). 262
M
AN
US
CR
IP
T
AC
CE
PT
ED
10 The altered surface was punctuated with low density altered zones in the shape of irregular cups whose 263widths and depths varied from a few hundred nm to a few μm (figure 1 (a) and (c) and supplementary 264
data-figure S 1). They were formed on both faces. TEM images of micro-sections showed that in both 265
glasses, these irregular zones were highly porous. This was the case for all four samples. According to 266
STEM-EDX analysis (supplementary data-Section 3, figures S 6, S 7 and S 8), the porous zone is depleted 267
in Mg, Fe and enriched in Ca. 268
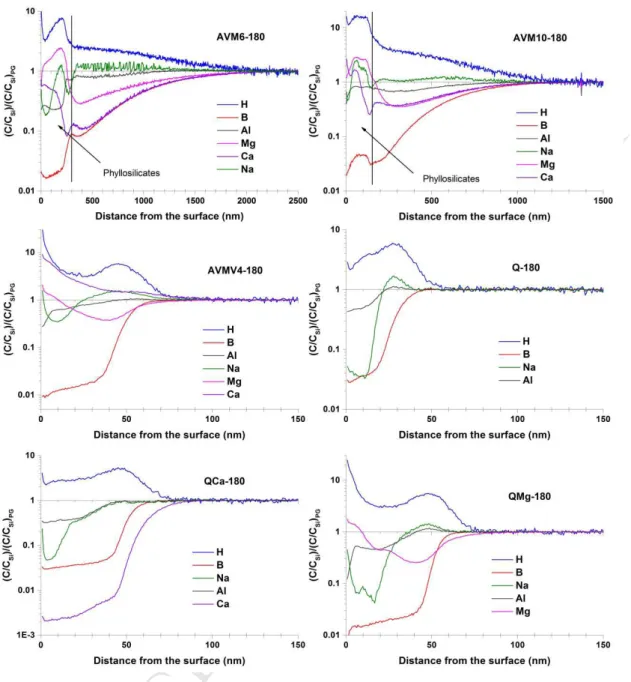
An attempt to calculate a statistical average thickness of the altered layer of the AVM10-180 269
sample was made. Ten cross-section SEM images on both faces of AVM10-180 were taken. These images 270
spanned a width of approx. 10 µm each and were taken at a distance of approx. 500 µm apart from one 271
another. From these images, 334 measurements of the irregular altered zone thicknesses were 272
calculated using GIMP image processing software. The average of these measurements for the AVM10 273
glass is around 659 nm. The minimum thickness measured is 78 nm and the maximum thickness 274
measured is 1.9 µm. The same process could not be repeated for other samples due to technical 275
difficulties. 276
(ii) Precipitation of Mg-rich phyllosilicates and other secondary precipitates: Both glass surfaces 277
were covered by secondary precipitates. SEM images showed well-developed leafy precipitates on both 278
AVM6-180 and AVM6-557 (figure 2(a) and figure 1(b)). Needle shaped precipitates were present 279
sporadically on the altered surface (figure 2(a)). In AVM6-557, these needle-shaped phases were much 280
more developed and formed clusters. As shown in figure 2(c) and 2(d), curiously, these clusters formed 281
in straight lines. It seems as though these phases preferentially formed along surface defects created 282
during sample preparation (polishing). TEM images also showed the presence of a layer of phyllosilicates 283
on the surface of the micro-sections that measured approx. 70 nm in AVM6-180 (Figure 2(b)) and 284
approx. 200-250 nm in AVM6-557 (figure 1 (b)). TEM-EDX analysis and EDS mapping of an altered zone 285
also indicated that the phyllosilicates were enriched in Mg, Fe and Na in addition to Si and they were 286
depleted in Al with respect to the pristine glass composition (supplementary data –section 3, figure S 6 287
and S 7). Figure S4 in supplementary data shows the enrichment of Mg in the phyllosilicate layer. 288
The leafy precipitates in AVM10-180 seemed to be under-developed and visually different in 289
comparison to AVM6. In AVM10-557, they were better developed than AVM10-180, as can be seen in 290
figure 2(f) in comparison to 2(e). This can also be affirmed by the SEM & TEM images provided in the 291
supplementary data-section 2, figure S 3. The quantity of the needle shaped crystalline phases also seem 292
lower than that on the AVM6 samples and the AVM10-557 samples seem to contain more of them than 293
M
AN
US
CR
IP
T
AC
CE
PT
ED
11 AVM10-180 samples (supplementary data- figure S 2). The TEM images show a phyllosilicate layer of 294approx. 300 nm thickness for 180 and approximately 70 nm thick phyllosilicate layer for AVM10-295
557 (figures 2(e) and 2(f)). It is to be noted here that it is not the overall layer thickness, but just the 296
thickness of the phyllosilicate section. 297
(iii) The third similarity between AVM6 and AVM10 samples is the presence of a dense 298
homogeneous gel layer beneath the phyllosilicate layer but above the porous irregularly altered zones. 299
This gel layer is approximately 50 nm thick in AVM6-180 (figure 2(b)) and 70 nm thick in AVM6-557 300
(figure 1(b)). It is approx. 30 nm thick in AVM10-180 and AVM10-557 (figures 2(e) and 2(f) respectively). 301
This layer is enriched in Mg, Si and Ca, and sometimes slightly depleted in Al (supplementary data- 302
figures S 5, S 6, S 7 and S 9). 303
To summarize, under the tested conditions, AVM6 and AVM10 glasses alter similarly, which is 304
not the case for aqueous alteration of these glasses at the same temperature. The altered surface is 305
composed of a phyllosilicate layer at the top (few tens to a few hundreds of nm thick) that is composed 306
of Si, Al, Mg, Fe, Ca and Na. Underneath the phyllosilicates, TEM images have revealed a uniform gel 307
layer of a few tens of nm thickness that seems enriched in Mg and Si and depleted in Al, with respect to 308
the pristine glass. Porous irregularly altered zones are present in a heterogeneous/discontinuous manner 309
beneath the gel layer. 310
311
Identification of secondary precipitates 312
The compositions of the phyllosilicates were analyzed using STEM-EDX. It is to be noted that the 313
Na concentration was not constant throughout the analysis. The Na atoms migrated under the beam 314
towards the resin. It was verified that the concentration of other major elements were not affected due 315
to long exposure to electron beam. The stoichiometry of elements (excluding Na) in the phyllosilicate 316
layer, calculated from the STEM-EDX analysis, for the four samples described in section 3.1.1 are 317
provided in table 2 (the estimated uncertainty is around 12% relative error). It can be noted that the 318
composition of phyllosilicates is variable during the alteration of different glasses. No correlation could 319
be identified with pristine glass compositions (Si/Al ratio for example) as was previously suggested [65]. 320
The phyllosilicates formed on AVM6-180 and AVM6-557 have a very similar composition. The 321
stoichiometric ratio of Si/Mg suggests that the composition of the phyllosilicates formed on AVM6 glass 322
is similar to that of a di-octahedral smectite such as montmorillonite-((Na,Ca)0.33(Al,Fe,Mg)2(Si4O10)(OH)2 ·
M
AN
US
CR
IP
T
AC
CE
PT
ED
12 nH2O), with slight variations in the composition based on the different transition metal substitutes324
available. The quantity of Al and other elements capable of occupying octahedral sites in the smectite 325
(Mg, Fe) is not sufficient to envisage a tri-octahedral smectite. 326
The XRD patterns of the AVM6 samples showed an intense peak corresponding to (001) 327
reflection at 15 Å (supplementary data figure S 10), which can be associated with montmorillonites [66]. 328
Other peaks, if present, were not clearly distinguishable from the background noise. Apart from the 329
composition given by EDX analyses, the other method to distinguish di-octahedral smectites from tri-330
octahedral smectites is the appearance of the (060) reflection between 1.49 and 1.51 Å [67, 68]. It is 331
difficult to distinguish the peaks around 1.51Å in the XRD patterns from the background noise. The 332
physical magnitude represented by the (001) and (060) lines have different orientations. Therefore, it is 333
possible that the intensity of one of the two peaks increases preferentially than the other. Nevertheless, 334
these results confirm the formation of a di-octahedral smectite (montmorillonite) on the glass surface 335
during vapor phase hydration in this study. 336
The composition of the phyllosilicates formed on AVM10-180 and AVM10-557 seem to differ, notably in 337
Mg and O content. AVM10-180 sample has higher Mg and O contents. It is reasonable to suggest that 338
the excess Mg and O in the AVM10-180 sample may be due to the presence of brucite (Mg(OH)2), which
339
is a well-known precursor of Mg-rich smectites [69-71]. No peaks were distinguishable in the XRD 340
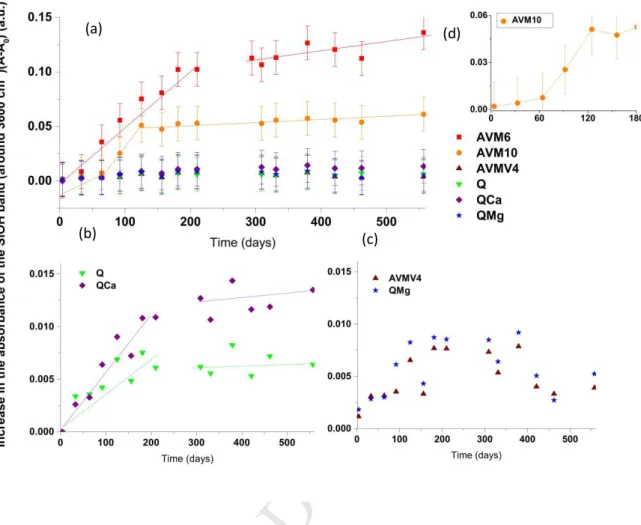
pattern, although the TEM images (figure 2(f) and supplementary data-figure S 3) clearly show the 341
presence of a sheet-type mineral. The stoichiometric ratios suggest the possibility of either a di-342
octahedral smectite or a tri-octahedral smectite, depending on the incorporation of Al in tetrahedral 343
sites or octahedral sites, respectively. 344
At this stage the exact composition of the smectite formed on AVM10 samples in this study cannot be 345
affirmed with the available information. However, a possible smectite composition is proposed based on 346
the EDX analyses of AVM10-557 (table 2) and the generic formula for tri-octahedral smectites proposed 347
by Joly et al. [72]. This generic formula shown in equation 3.1.1.1 was earlier used by Arena et al. for 348
identification of a phyllosilicate formed on nuclear waste glass simulant ISG in the presence of Fe and Mg 349
(aqueous alteration, SA/V 20000 m-1, 50°C, 511 days) [49]. “X” in equation 3.1.1.1 corresponds to cations 350
other than Al that may occupy octahedral sites, such as Mg or Fe. The proposed composition is 351
[(Si3.85Al0.15)((Mg, Fe)2.13Al0.87)O10(OH)2]0.72+[Na0.1Ca0.1]0.3+.
352
[Si(4-a)Ala)(X(3-b)Alb)O10(OH)2](a+b)-[XcNadCae](2c+d+2e)+ (Equation 3.1.1.1)
M
AN
US
CR
IP
T
AC
CE
PT
ED
13 3.1.2 AVMV4 and QMg 354The Si/Al ratio of the glass QMg is the same as the glass AVMV4. The SEM images of both the Mg-355
containing glasses showed some similarities (i) The altered surface showed the presence of thread-like 356
carpet of precipitates along with µm sized cluster of fibrous precipitates in the SEM images of samples 357
altered for 180 days (AVMV4-180 and QMg-180) (figure 3(c) and 3(a) respectively). The altered surface of 358
the samples altered for 557 days (AVMV4-557 and QMg-557) showed the presence of holes of 400-500 359
nm in diameter and a gnawed appearance, with pit size of a few hundred nm, respectively (figure 3(d) 360
and 3(b) respectively) (ii) The altered layers of all four samples were not visible in SEM, indicating that 361
their thickness must be less than 100 nm. Irregularly altered zones were also not observed in the SEM 362
images. 363
TEM images of cross-section of AVMV4-557 show the presence of a gel layer of approximately 80 nm 364
thickness (figure 3(e) & (f) and Supplementary data, figure S11). Above this apparently homogeneous gel 365
layer, a mixture of amorphous and crystalline phases is distributed across the 5 µm cross-section in 366
varying thicknesses (200 nm to 20 nm). STEM image of QMg-180 showed an altered layer next to the 367
pristine glass that appears homogeneous and is between 40-60 nm in thickness (figure 4(a)). On the 368
surface of the altered layer, a layer of fibrous precipitates of 30-40 nm in thickness is present. The 369
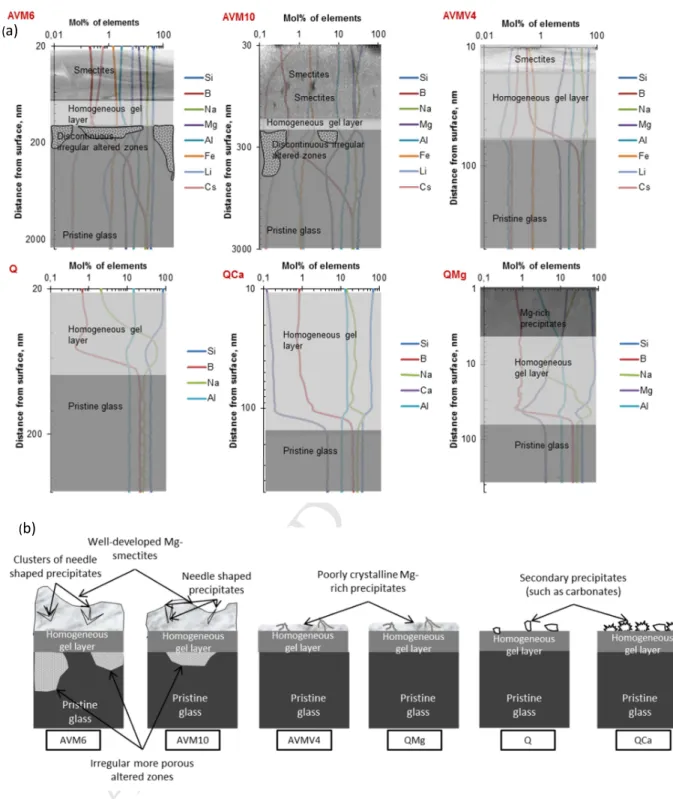
electron diffraction patterns obtained from TEM imaging did not show any fringes in the zone of 370
precipitates, indicating that the precipitates are probably amorphous. The STEM-EDX analysis indicated 371
that the amorphous precipitates and the gel layer in the surface are enriched in Mg and Na and depleted 372
in Al, with respect to pristine glass (supplementary data-figure S 12). 373
3.1.3 Q
374
SEM images of Q altered for 180 days and 557 days (Q-180 & Q-557) do not show any recognizable 375
secondary precipitates. TEM image of a micro-section of Q-180 shows the presence of a seemingly 376
homogeneous altered layer of approx. 40 nm thickness (figure 4(b)). The pores that are visible on the 377
altered layer-pristine glass interface were formed / enlarged during exposure of the sample to the 378
electron beam. 379
3.1.4 QCa
380
SEM images of QCa altered for 180 days (QCa-180) show a few unidentified scattered precipitates on 381
the surface. TEM image of QCa-180 shows the presence of an apparently homogeneous altered layer of 382
approximately 80 nm (figure 5(a)). The difference in density between the pristine glass and gel layer 383
seems to be higher than other glasses observed. 384
M
AN
US
CR
IP
T
AC
CE
PT
ED
14 Figure 5(b) shows the SEM image of QCa altered for 557 days (QCa-557). The sample surface contained 385significantly more surface precipitates than QCa-180. There seems to be two types of secondary phases; 386
clusters of pointed needle-like secondary phases and cuboid precipitates. Figure 5(c) shows the SEM 387
image of sample cross-section. An altered layer of approx. 110-150 nm thickness is distinguishable due to 388
the contrast difference between the layer and the pristine glass. Calcite was identified by XRD patterns 389
on QCa-180 and QCa-557. 390
3.2 Behavior of elements in the altered layers (ToF-SIMS profiles)
391
Among all the characterization techniques presented in this study, ToF-SIMS and FTIR analyze the largest 392
surface area of the sample in a uniform manner for all six samples. Therefore, it is considered to be the 393
most suitable method for inter-comparison and the most representative in terms of element behavior in 394
the altered layer and the average depth of altered zone. Table 3 summarizes and compares the 395
thicknesses of the altered layers measured using ToF-SIMS and TEM images. The uncertainties of the 396
given values could not be calculated. The percent error associated with ToF-SIMS measures is generally 397
considered to be less than 3% [73]. Other factors contributing to the uncertainty are surface irregularity 398
due to precipitates, constant speed of abrasion used for the entire zone of analysis and 399
irregular/discontinuous altered zones. However, based on the coherence between the results of ToF-400
SIMS and other characterization techniques, it can be presumed that the uncertainty associated with the 401
altered layer thicknesses can be overlooked. 402
Figure 6 presents the normalized ToF-SIMS profiles of the major elements present in the six glasses 403
altered for 180 days. The normalized ToF-SIMS profiles of all the elements present in all six samples 404
altered for 180 days and 557 days are presented in supplementary data (figures S 13 to S 19). 405
As observed in section 3.1, a similarity in the behavior of elements of the glasses AVM6 / AVM10 and 406
AVMV4 / QMg is noticeable. The striking similarity in the behavior of H, B, Al, Na and Mg in the glasses 407
AVMV4 and QMg are presented in supplementary data (figure S 20). Globally, for each glass, the 408
behavior of elements in the altered layer is remarkably similar among the two different samples altered 409
for two different durations. The four Mg-containing glasses show the presence of a layer of precipitates 410
towards the surface of the altered layer. As in SEM images, the thickness of this precipitate layer is much 411
higher in AVM6 (250-300 nm) and AVM10 (150-250 nm) than the AVMV4 and QMg glasses (<10 nm). 412
This precipitate layer mainly contains Mg, Na, Li, Cs and Fe (in addition to Si). 413
M
AN
US
CR
IP
T
AC
CE
PT
ED
15 The altered layer-pristine glass interface is rather sharp for the samples AVMV4, Q, QCa and QMg, unlike 414for the AVM6 and AVM10 samples. This apparently broad interface is due to the irregular and 415
discontinuous altered zones observed in SEM images. Therefore the thickness estimated for these two 416
glasses is considered as an average thickness of the analyzed zone. Based on the ToF-SIMS thickness 417
(boron) from table 3, the glasses AVM6 and AVM10 alter 10-30 times faster than the other four glasses. 418
Among the samples altered for 180 days, AVMV4, QCa and QMg alter 1.7 times faster than the glass Q. 419
Among the samples altered for 557 days, QCa alters almost twice that of AVMV4, QMg and Q. In testing 420
two samples of each glass for durations of 180 and 557 days, we considered that the rate of alteration 421
would be similar. However, the increase in the thickness of altered layer from 180 days to 557 days 422
suggests that the vapor hydration rate has decreased by a factor of 9.1 for AVMV4, 8.5 for QMg, 1.9 for 423
Q and 1.6 for QCa after 180 days of alteration (considering that the vapor hydration rate is constant 424
between 0-180 days and between 180-557 days). 425
In coherence with the STEM-EDX results, Al is depleted in the zone of surface precipitates of the Mg-426
containing glasses, indicating that the Si/Al ratio is higher in the phyllosilicate layer than the glass. 427
The ToF-SIMS profiles, which have been normalized to Si and to PG, might give an impression 428
that many elements are depleted from the gel layer, even though not as extensively as boron. It seems 429
likely that this depletion is due to a migration of the element towards the surface to form precipitates. In 430
the zone of precipitates, the normalization with respect to Si creates an artificial depletion of elements 431
such as Zr, rare-earths and Al, because they are almost absent in the precipitate layer, towards the 432
surface. The elements which are really depleted (absent in gel layer and precipitate layer) are boron, Ca 433
in QCa and Na from the surface of Q. The retention of Ca is < 3% in the gel layer of QCa (in both QCa-180 434
and QCa-557). 435
3.3 Porosity of the altered layer (SAXS)
436
The porosity, pore-size and specific surface area values reported in this paper were calculated by 437
considering that the pores of the gel layer are filled with water. This assumption will be discussed later in 438
section 4. The data treatment was based on previous works [62-64] and is explained in detail in the 439
supplementary data (section1). S is the scattering vector in nm-1 and T$ (cm-1), calculated from 440
equation S9 in supplementary data, separates the scattering intensity in the high q domain by the pores 441
in the gel layer from the scattering in the low q domain by the grain envelopes. 442
M
AN
US
CR
IP
T
AC
CE
PT
ED
16 AVM6 and AVM10: The plots of T$ U8. S of these two glasses show a porod regime 443(T$ V S W). The SAXS spectra of these glasses are provided in figure S 21 (supplementary data). In both 444
glasses, the high q porod regime shifts to higher q values with time. However, porod’s law cannot be 445
used to calculate the porosity and specific surface area of pores for these two glasses, since the SEM 446
images of the monolith samples indicate that these glass surfaces are covered with phyllosilicates. 447
Therefore, the SAXS diagram contains information regarding both the porosity of the gel layer and the 448
inter-layer spacing of the phyllosilicates and they cannot be deconvoluted. 449
AVM6 glass powders of particle size 2-5 µm that were prepared as described in section 2.1 were altered 450
at 50°C and 95% RH for 11 days, 31 days and 90 days, for the purpose of characterization by SAXS and 451
identification of possible trends in the evolution of the gel layer. These samples are referred to as AVM6-452
11, AVM6-31 and AVM6-90. The T$ U8. S plots of these glasses are shown in figure S 22 453
(supplementary data). Porod’s law is respected at higher q values for all three samples including the 454
sample altered for only 11 days. The quantity of secondary phases on these samples altered for a short 455
duration is negligible (TEM images (not shown here) of AVM6 samples altered for 90 days at 50°C and 456
95% RH show that the surface precipitates are visually much less denser than the AVM6-180 samples). 457
Therefore, the porosity, pore-size and specific surface area of the gel layer can be calculated. The 458
porosity, pore diameter and specific surface area of AVM6-11 are 66%, 4.4 nm and 328 m2/g
459
respectively; that of AVM6-31 are 47%, 4.5 nm and 235 m2/g respectively; and that of AVM6-90 are 11%,
460
4.8 nm and 58.2 m2/g. These values are recapitulated in table 4. It can be noticed that porosity decreases 461
with time, while pore size increases. The T$ U8. S plot of AVM6-11 is distinctly different than that of 462
the other AVM6 samples. The shoulder corresponding to the highest intensity is at a higher q for the 463
AVM6-11 sample. This translates to a smaller average pore size than the other glasses [74]. However, the 464
porod regimes of the AVM6 samples altered for larger duration is shifted towards much higher q. This 465
suggests the presence of smaller pores in the samples that were altered for a duration longer than 11 466
days, even though the average pore-size increases with increase in duration of alteration. 467
AVMV4 and QMg: T$ U8. S plot of these two glasses are similar in the sense that, neither of them 468
displays a porod’s regime. The plots are shown in figure S 22 (supplementary data). The exponent D 469
(T(?/>>) ∝ S Y) decreases with increase in duration of alteration, suggesting an increase in the 470
roughness of the pore-interface. It can be considered that the reason for the absence of a porod’s 471
regime in the SAXS diagram is the interference of poorly crystallized precipitates. This means that the D 472
value, which varies between 3.4 to 2.6, is not representative of a rough pore-interface in the gel layer, 473
M
AN
US
CR
IP
T
AC
CE
PT
ED
17 but rather a distortion of signal due to the presence of almost equal proportions of gel layer and poorly 474crystalline precipitates. 475
Q and QCa: The T$ U8. S plot of these two glasses exhibit a porod’s regime (figure 7). The absence of a 476
substantial amount of secondary precipitates on the SEM and TEM images of the monolith samples 477
validate the use of these measurements to calculate the porosity, pore size and specific surface area of 478
pores. The porosity of Q-180 is 65% and decreases to 44% in the Q-557 sample. The pore diameter 479
increases from 4.3 nm in the Q-180 sample to 5 nm in the Q-557 nm. The surface area of pores also 480
decrease from 451 m2/g in the Q-180 sample to 264 m2/g in the Q-557 sample. The porosity of QCa-180
481
is 27%, which decreases to 9% in the 557 sample. The pore diameter increases from 5.1 nm in QCa-482
180 to 7.5 nm in QCa-557. The surface area of pores decrease from 158 m2/g in QCa-180 to 37.6 m2/g in 483
QCa-557. These calculated values are presented in table 4. Contrary to AVM6 and AVM10 samples 484
altered for 180 days and 557 days each, the high q porod’s regime shift towards lower q at longer 485
duration of alteration. This indicates an increase in the average pore size with time. The higher pore sizes 486
of the QCa sample than the Q sample and the factor of increase in pore-size with time correspond well 487
with the magnitude of the shift in high-q porod’s regime to lower q values for these samples as shown in 488 figure 7. 489 3.4 Hydration kinetics 490 3.4.1 FTIR spectroscopy 491
The hydration kinetics is followed by studying the evolution of the increase in the absorbance of the 492
band attributed to the OH stretching mode in SiOH molecules. For this, the absorbance around 3600 cm-1 493
(OH stretching) measured at a given time of alteration (A) is reduced by the absorbance for the pristine 494
glass (A0). Figure 8 shows the increase of (A-A0) over time for all the six glasses until 557 days of
495
alteration. Figure 8(a) shows the difference in the increase of (A-A0) versus time according to the glass
496
stoichiometry. The increase in absorbance of AVM6 glass is approximately twice that of AVM10, 10 times 497
that of QCa and 15 times that of AVMV4, Q and QMg. By correlating the increase in the absorbance of 498
the SiOH band to the thickness of altered layer formed and the vapor hydration rate, it seems that there 499
is an inflexion in the vapor hydration rate of all six glasses around approximately 6 months in the given 500
conditions. For the AVM10 glass, it seems that this inflexion occurs at 4 months. In figure 8(d), it seems 501
that there is acceleration in the vapor hydration rate between 60 and 120 days of alteration, followed by 502
a strong slowdown of the vapor hydration rate. Figures 8(c) shows the strikingly similar behavior of the 503
AVMV4 and QMg glasses. The inflexion seems to occur around 120 days of alteration. There also seems 504
M
AN
US
CR
IP
T
AC
CE
PT
ED
18 to be a decrease in the absorbance after approximately 380 days of alteration. Figure 8(b) shows the 505evolution of (A-A0) vs. time of the glasses Q and QCa. The inflexion seems to occur approximately around
506
180 days for the samples Q, QCa and AVM6. The factor by which the rate of increase of (A-A0) drops after
507
six months vary from 7.5 (AVM6) to 15 (AVM10). 508
3.4.2 Alteration kinetics based on the different measurements of thickness
509
The measurements of the thickness of the altered layers formed by ToF-SIMS and SEM/TEM images after 510
180 days and 557 days of vapor hydration of the six glasses are presented in table 3. It can be noticed 511
that the thickness measured by ToF-SIMS is lower than the thickness measured by SEM/TEM images for 512
four of the six glasses (AVMV4, Q, QCa and QMg). This is likely due to the fact that in ToF-SIMS, the layer 513
of precipitates and the gel layer might get abraded faster than the pristine sample due to the difference 514
in composition and their lower density. But the same speed of abrasion was used whatever the layer 515
considered. As a result, the thicknesses of the altered layers, which are a combination of the gel layers 516
and precipitate layers, are underestimated. Nevertheless, the thicknesses measured by ToF-SIMS and 517
TEM images are in the same order of magnitude. A second similarity between the thicknesses measured 518
by both techniques is that the sample Q has the smallest thickness among the four samples altered for 519
180 days and the thickness of the samples Q, QMg and AVMV4 are similar among the samples altered for 520
557 days. Therefore, it can be stated that the two techniques corroborate each other. In the case of the 521
glasses AVM6 and AVM10, which have an irregular alteration, ToF-SIMS provides an average altered 522
layer thickness in a relatively larger zone (50x50 µm2) and the SEM/TEM images have shown that the
523
thickness could vary from a few tens of nm to a few µm. The average thickness provided by ToF-SIMS is 524
useful to identify the relative durability of glasses. In addition, according to the FTIR results, the glasses 525
AVM6 and AVM10 alter 10-20 times faster than the other four glasses. This result is very well 526
corroborated by the ToF-SIMS results. While studying the alteration kinetics based on ToF-SIMS and 527
SEM/TEM images, the rate of formation of altered layer (in nm/day) after 180 days and 557 days 528
calculated by assuming linear alteration kinetics shows that the rate has decreased between 180 days 529
and 557 days of vapor hydration. This result is also explained very well by the FTIR spectroscopy, which 530
shows an inflexion in the rate of increase in (A-A0) with time after about 120-200 days of alteration. Thus
531
the alteration kinetics measured by three different techniques are coherent. 532
M
AN
US
CR
IP
T
AC
CE
PT
ED
19 4. Discussion 5334.1 Morphology of the altered layer
534
Figure 9 shows a schematic description of the different morphologies of the altered layer for all 535
six glasses altered under the same conditions. All six glasses present a homogeneous gel layer of tens of 536
nm thickness adjacent to the pristine glass. AVM6 and AVM10 present irregularly shaped, discontinuous 537
and more porous altered zones beneath the continuous gel layer. These two glasses contain significant 538
amount of well-developed Mg-rich smectites and needle-shaped precipitates (AVM6 has more of it than 539
AVM10). AVMV4 and QMg also present a layer of poorly-crystalline Mg-rich layer of precipitates on the 540
surface above the gel layer. However, the SEM images have shown that they are present in a much lesser 541
quantity than in AVM6 and AVM10. SEM images have not revealed any irregularly altered zones in these 542
glasses. Q and QCa glasses also contain precipitates on the surface of the gel layer, but unlike in the Mg-543
containing glasses, they do not cover the glass surface. They are rather present in the form of crystals, 544
which are either isolated or in clusters. 545
The morphology of AVM6 and AVM10 altered samples is rather surprising, particularly because 546
of the presence of porous irregular altered zones beneath the homogeneous gel layer. Irregular 547
alteration has been noticed in literature [75-78], especially in atmospheric alteration studies. The 548
formation of a heterogeneous altered layer and craters are often attributed to a localized chemical 549
attack due to surface defaults such as cracks/scratches/fissures or deposit of dust particles/matter from 550
exposure to atmosphere or formation of hygroscopic salts locally on the surface or preferential/irregular 551
water condensation [22, 79, 80]. The unexpected part was the presence of the uniform and continuous 552
gel layer in-between phyllosilicates and irregular more porous discontinuous altered zones. A similar 553
dense gel layer formed in-between phyllosilicates and irregular porous zones could not be found in 554
literature. The closest analogy found was the gel layer formed during the aqueous alteration of a Si-B-Na-555
Ca-Zr glass. In the cited studies, a dense gel layer was present on the altered surface and above a porous 556
gel layer. This denser gel layer was associated with pore-closure with time and passivating effect of the 557
gel layer [81-83]. However, in literature, a denser gel layer close to the unaltered glass and a porous gel 558
layer towards the glass surface and beneath secondary phases have been noticed [84]. Two possibilities 559
can be imagined in our study: (i) The hydration front is irregular; the pore closure due to reorganization 560
of the gel occurs at the surface in the region of the “oldest” gel, as suggested in the above mentioned 561
example [83]. (ii) The denser gel layer and the irregular, more porous, discontinuous altered zones were 562
M
AN
US
CR
IP
T
AC
CE
PT
ED
20 formed or driven by two different mechanisms. The second assumption seems more likely and is 563discussed further in section 4.5. 564
4.2 Behaviour of elements (alkalis, Ca and B) in the altered zone
565 566
Boron is depleted in the gel layer of all six glasses (less than 20% retention). Although it is useful 567
to estimate the altered layer thicknesses from ToF-SIMS profiles, its depletion is puzzling. It would be 568
logical to expect that elements are not lost from the altered layer during vapor phase hydration. The 569
depletion could mean that there is water condensation on glass surface followed by run-off. If this is the 570
case, the loss of other soluble elements such as Na and Li can be expected as well. However, Na is 571
retained to a higher extent than boron as can be seen in figure 6. The profiles of B, Na and Li do not 572
resemble each other. Therefore, the possibility of evaporation of boric acid species at 50°C and 95% RH 573
should also be investigated [85, 86]. 574
Hence, a vapor hydration experiment was conducted with 0.6 g of borosilicate glass (QMg) 575
powder of particle size 20-40 µm (90°C, 98% RH, 153 days) using the protocol previously used on glass 576
monoliths by Neeway et al. [28]. The glass powder was placed in a cup inside the reactor above NaCl 577
solution that was used to impose relative humidity. The set-up was arranged in such a way that the 578
water that condenses on glass powders in the cup cannot run-off. Despite the set-up, 0.7±0.1 mg of 579
boron was present in the NaCl solution at the end of the experiment. The vapor hydration rate of QMg at 580
90°C was estimated based on unpublished results and using this value, it was estimated that 27±6% of 581
boron from the altered layer was lost by evaporation. This experiment shows the possibility of 582
evaporation of boron/boric acid species and indicates that at 50°C, probably only a small fraction of 583
boron escapes due to volatility and a large fraction must be lost due to condensation and run-off. 584
Ca is depleted to a higher extent than boron in the QCa glass (<2% retention). It can be justified 585
by the formation of calcite crystals on the surface of the glass, which may adhere poorly. For a glass that 586
has only 52 nm thick altered layer, sufficient quantity of calcite had precipitated to be identified in XRD 587
pattern. The depletion of Na towards the surface of the Q glass could probably be due to formation of 588
carbonates (although undetected). In the other glasses, Na is well retained in the gel layer. In figure 6, a 589
certain similarity can be observed in the profile of Na and H for all glasses. This suggests that Na is 590
reactive and might be linked to inter-diffusion reaction. Despite being probably released from the glass 591
network, Na is still well retained in the gel layer (except in Q). It may be present in porewater, form 592
M
AN
US
CR
IP
T
AC
CE
PT
ED
21 precipitates or may participate in the hydrolysis of ≡Si-O-Si≡ bonds to form ≡Si-O-…Na+ bonds, as593
suggested in literature [39]. 594
4.3 Porosity of the altered layer
595 596
During the SAXS data treatment, it was assumed that the pores in the gel layer are filled with water. This 597
assumption is supported by the calculation of the threshold pore-size by Kelvin’s equation (equation 598
4.3.1) [87], below which, water is expected to condense in pores due to capillary effect. This threshold 599
pore-radius was calculated to be 9.2 nm at 50°C and 95% RH from equation 4.3.1. The maximum value of 600
the pore-radius measured through SAXS is <4 nm. Therefore, it seems highly probable that the pores are 601
filled with water. The porosity of the gels was also calculated by considering that the pores are filled with 602
air, but in this case, the calculated porosity values were unrealistic. This further reinforces our 603
assumption that the pores are filled with water. However, a certain uncertainty is associated with this 604
assumption. Even if it is considered that the pores are indeed filled with water during the experiment, it 605
is unclear if the water stays in the pores during characterization or it evaporates/escapes into the 606
atmosphere once the sample is removed from the humid and hot atmosphere (95% RH & 50°C). Data 607
analysis has been carried out despite this uncertainty by considering that water remains inside the pores, 608
since the samples were not exposed to high temperatures or desiccators during storage until 609
characterization. Specific studies to carefully assess the impact of this uncertainty on data treatment are 610 a necessary perspective. 611 ln\\ ]= − ^_`a bc (Equation 4.3.1) 612
The values of the porosity, specific surface area of the pores and the pore-radiuses are in the same order 613
of magnitude as those observed in published aqueous alteration experiments of borosilicate glasses [63, 614
88, 89]. 66% porosity of the gel layer of Q-180 and AVM6-11 (table 4) seem relatively high, especially 615
while comparing with TEM images of Q-180, which do not show a very porous altered layer. This means 616
that either the porosity measured by SAXS is overestimated or there is some other unknown mechanism 617
that could explain such high porosity values, which needs further investigation of the gel layer formed on 618
these glasses. This porosity value may be overestimated due to the volume fraction of gel used in data 619
treatment, which is reasonably assumed based on altered layer thicknesses of the gel layer formed on 620
monoliths. This being said, such high porosity values have also been reported during aqueous alteration 621
of glasses [63, 89]. 622