HAL Id: tel-01891916
https://tel.archives-ouvertes.fr/tel-01891916
Submitted on 10 Oct 2018
HAL is a multi-disciplinary open access archive for the deposit and dissemination of sci-entific research documents, whether they are pub-lished or not. The documents may come from teaching and research institutions in France or abroad, or from public or private research centers.
L’archive ouverte pluridisciplinaire HAL, est destinée au dépôt et à la diffusion de documents scientifiques de niveau recherche, publiés ou non, émanant des établissements d’enseignement et de recherche français ou étrangers, des laboratoires publics ou privés.
different climates
Fatima Harkouss
To cite this version:
Fatima Harkouss. Optimal design of net zero energy buildings under different climates. Mechanical engineering [physics.class-ph]. Université Côte d’Azur; Université libanaise, 2018. English. �NNT : 2018AZUR4044�. �tel-01891916�
Conception optimale de bâtiments à énergie
nette nulle sous différents climats
Fatima Harkouss
Laboratoire Jean-Alexandre Dieudonné
Présentée en vue de l’obtention
du grade de docteur en génie mécanique d’Université Côte d’Azur
et de l’université Libanaise
Dirigée par : Pascal Henry Biwole / Farouk Fardoun
Soutenue le : 28-Juin-2018
Devant le jury, composé de :
Christian INARD, Professeur, Université de La Rochelle Enrico FABRIZIO, Doctorat d'État, Polytechnique de Turin Peter RIEDERER, Docteur Ingénieur, CSTB
Gerard SAUCE, Maître de conférences, Nice Sophia Antipolis Fadi HAGE CHEHADE, Professeur, Université Libanaise
Pascal Henry BIWOLE, Professeur, Université Clermont Auvergne Farouk FARDOUN, Professeur, Université Libanaise
II
Conception optimale de bâtiments à énergie nette nulle sous différents climats
Résumé:
La conception des bâtiments à consommation énergétique nette zéro (BCENN) a été introduite pour limiter la consommation d'énergie et les émissions polluantes dans les bâtiments. En général, il est admis qu'il y a trois étapes principales pour atteindre la performance du BCENN: d’abord l'utilisation de stratégies passives, puis de technologies économes en énergie, et enfin de systèmes de production d'énergie renouvelable (ER). L'optimisation des bâtiments est une méthode prometteuse pour évaluer les choix de conception de BCENN. Le défi dans la conception de BCENN est de trouver la meilleure combinaison de stratégies de conception qui feront face aux problèmes de performance énergétique d'un bâtiment particulier. Cette thèse présente une méthodologie pour l'optimisation multicritères basée sur la simulation des BCENN. La méthodologie est caractérisée principalement par quatre étapes: la simulation du bâtiment, le processus d'optimisation, l’aide à la décision multicritère (ADM) et une analyse de sensibilité pour évaluer la robustesse de la solution optimale. La méthodologie est appliquée à l’étude de l’optimisation de la conception des BCENN dans différentes études de cas, prises dans des zones climatiques diverses. La méthodologie proposée est un outil utile pour améliorer la conception des BCENN et faciliter la prise de décision dans les premières phases de la conception des bâtiments. L’amélioration des bâtiments en matière d'efficacité énergétique nécessite une optimisation des paramètres passifs. Une étude complète sur la conception passive optimale pour les bâtiments résidentiels est présentée. Vingt-cinq climats différents sont simulés dans le but de produire les meilleures pratiques pour réduire les charges énergétiques du bâtiment (pour le refroidissement et le chauffage) et son coût global sur son cycle de vie (hors déconstruction du bâtiment). Le confort thermique adaptatif des occupants est également amélioré en mettant en œuvre les stratégies de refroidissement passif appropriées telles que les dispositifs d’occultation et la ventilation naturelle. Les mesures passives optimales s’avèrent efficaces elles conduisent à une diminution de demande énergétique, du coût globale sur le cycle de vie, et de la surchauffe.
Les caractéristiques des systèmes de conditionnement de l’air et de production d’énergie mis en œuvre dans les BCENN doivent être sélectionnées avec soin pour garantir l'objectif de performance prévu. Dans cette thèse, six ensembles de systèmes énergétiques sont comparés et optimisés, pour la conception de BCENN dans des climats représentatifs choisis, à savoir Indore (besoin de froid dominant), Tromso (besoin de chaud dominant) et Beijing (climat mixte). La
III performance des BCENN y est évaluée en fonction du coût global sur le cycle de vie, du temps de retour sur investissement, du coût actualisé de l’énergie, des émissions de CO2, du bilan énergétique, de l’indice d'autosuffisance énergétique et enfin, de l'indice d'interaction au réseau électrique. Des recommandations pour chaque région sont fournies.
Mots-clés: BCENN, optimisation, climat, mesures passives, confort adaptatif, énergie
V
Optimal design of net zero energy buildings under different climates
Abstract:
The conception of net zero energy buildings (NZEB) has been introduced to limit energy consumption, global warming potentials, and pollution emissions in buildings. In general, it is traditionally agreed that there are three main steps to reach the NZEB performance, starting through the use of passive strategies, energy efficient technologies, and then renewable energy (RE) generation systems. Building optimization approaches are promising techniques to evaluate NZEB design choices. The challenge in NZEB design is to find the best combination of design strategies that will enhance the energy performance of a particular building. The aim of this thesis is to develop an understanding of NZEBs design concepts. Besides, it aims to assist NZEB designers to select the suitable design options of passive and RE systems based on a systemic evaluation in different climates. This thesis presents a methodology for the simulation-based multi-criteria optimization of NZEBs. Its main features include four steps: building energy simulation, optimization process, multi-criteria decision making (MCDM) and testing solution’s robustness. The methodology is applied to investigate the cost-effectiveness potential for optimizing the design of NZEBs in different case studies taken as diverse climatic zones. The proposed methodology is a useful tool to enhance NZEBs design and to facilitate decision making in early phases of building design. The high potential of buildings towards energy efficiency has drawn special attention to the passive design parameters. A comprehensive study on optimal passive design for residential buildings is presented. Twenty five different climates are simulated with the aim to suggest best practices to reduce building energy demands (for cooling and heating) in addition to the life cycle cost (LCC). The occupants’ adaptive thermal comfort is also improved by implementing the appropriate passive cooling strategies such as blinds and natural ventilation. The integrated optimal passive measures have demonstrated its competency since it leads to a significant energy demand, LCC, and overheating-period decrease. The configurations and capacities of the implemented RE systems in NZEBs must be appropriately selected to ensure the intended performance objective. In the thesis, investigation, optimization and comparison of six RE solution sets for designing NZEBs is carried out in three typical climates: Indore (cooling dominant), Tromso (heating dominant) and Beijing (mixed climate). The performance of NZEB is evaluated in terms of a combined performance comprised of building energy consumption, LCC,
VI payback period, levelized cost of energy, CO2eq emissions, load matching index, and grid interaction index. Recommendations for each region are provided.
Keywords:Net zero energy building, optimization, climate, passive measures, adaptive comfort, renewable energy, grid stress, environment, economy
VII
TO MY MOTHER,
TO MY FAMILY
IX
Acknowledgments
I would like to express my sincere gratitude to my directors Prof. Farouk Fardoun at the Lebanese University, Doctoral School of Sciences and Technology, and Prof. Pascal Henry Biwole at the University of Nice Sophia Antipolis for their firm support, encouragement and assistance throughout the duration of my study. Their precious guidance and advice provided many ideas, which have led to the completion of this research work.
I would also like to show my gratitude for the honorable jury members who accepted to examine my project: Mr. Christian Inard, Mr. Enrico Fabrizio, Mr. Peter Riederer, and Mr. Gerard Sauce.
My deepest thanks goes to the Lebanese University, the University of Nice Sophia Antipolis, in addition to the association of specialization and scientific orientation. Their financial support is greatly appreciated.
I would also like to thank my colleagues in LJAD, it is very pleasant to work in such a laboratory.
Special thanks go to my teachers and friends who supported me during all the period of my studies.
My biggest love and gratitude goes to my family and my friend Hassan Osseily who gave me everything possible to enable me reach higher education levels. I only hope that they know how their support and patience encouraged me to fulfill my and their dream.
XI
Contents
Introduction... 1
Introduction ... 4
Chapitre 1: Bâtiments à consommation énergétique nette nulle : Revue des définitions et approches d’optimisation en fonction des climats. ... 7
Résumé en Français ... 7
Chapter 1: Optimization Approaches and Climates Investigations in NZEB - A Review ... 9
Abstract ... 9
1. Introduction ... 11
2. NZEB definitions ... 15
2.1. General definition ... 16
2.2. International organizations adopted definition ... 16
2.3. RE supply option hierarchy ... 18
2.4. Classification based on energy measurements methods ... 19
2.5. Classification based on ranking RE sources ... 21
2.6. Definition based on imported/exported energy balance ... 21
2.7. Net Zero Exergy Building (NZExB) ... 22
3. State of the Art ... 24
4. Indices for NZEBs ... 31
4.1. Zero Energy Performance Index (zEPI) ... 31
4.2. Home Energy Rating System (HERS) ... 32
4.3. Energy Efficiency Rating ... 33
5. Investigated case studies and models simulations in different climatic zones ... 34
5.1. Introduction ... 34
5.2. Discussion ... 36
6. Optimization in NZEB designs ... 45
6.1. Introduction ... 45
6.2. Building optimization state of the art ... 45
7. Summary ... 53
8. Conclusion ... 55
Chapitre 2: Méthodologie d'optimisation multicritères pour les bâtiments à consommation énergétique nette nulle ... 58
XII
Chapter 2: Multi-Objective Optimization Methodology for Net Zero Energy Buildings ... 60
Abstract ... 60
1. Introduction ... 61
2. Methodology ... 64
2.1. Base case building simulation ... 65
2.2. Optimization problem formulation procedure... 65
2.3. Multi-criterion decision-making process ... 67
2.4. Sensitivity study ... 69
3. Implementation of the methodology ... 69
3.1. Base case studies in different climatic zones ... 69
3.2. Building simulation ... 72
3.2.1. Buildings’ specifications ... 72
3.2.2. Building renewable energy systems... 74
3.2.3. Life cycle cost (LCC)... 76
3.2.4. Base case simulation results ... 77
3.3. Optimization procedure ... 80
3.3.1. Formulation of the optimization problem ... 80
3.3.2. Optimization results ... 83
3.4. MCDM and Sensitivity Analysis ... 86
4. Conclusions ... 90
Chapitre 3: Optimisation des paramètres passifs des bâtiments à basse consommation dans différents climats ... 93
Résumé en français... 93
Chapter 3: Passive design optimization of low energy buildings in different climates ... 95
Abstract ... 95
1. Introduction ... 96
2. Base case building and investigated climates ... 99
2.1. Building model and design conditions ... 99
2.2. Investigated climates ... 103
3. Simulation of the base case model ... 105
4. Optimization phase ... 108
XIII
4.2. Decision variables ... 110
4.3. Optimization algorithm... 110
4.4. Optimization results ... 111
5. Optimal solution selection using multi-criteria decision making (MCDM) ... 114
5.1. Sensitivity analysis ... 114
5.2. Discussion on optimal solutions ... 117
6. Thermal comfort evaluation ... 119
6.1. Adaptive comfort model ... 120
6.2. Enhancement of occupants adaptive comfort, cooling load and LCC ... 121
7. Conclusion ... 126
Chapitre 4: Conception optimale des systèmes énergétiques et de production d’énergies renouvelables pour les bâtiments à consommation énergétique nette nulle ... 129
Résumé en Français ... 129
Chapter 4: Optimal design of renewable energy solution sets for net zero energy buildings .... 131
Abstract ... 131
1. Introduction ... 132
2. Building model, design conditions and energy demands... 138
3. Description of solution sets ... 142
3.1. Evacuated tube solar collectors ... 143
3.2. Flat plate solar collectors ... 143
3.3. Absorption chiller ... 144
3.4. Cooling tower ... 144
3.5. Electric air cooled chiller ... 144
3.6. Natural gas condensing boiler ... 144
3.7. Ground source heat pump ... 145
3.8. Photovoltaic array ... 145
3.9. Residential wind turbines ... 146
4. Formulation of the optimization problem ... 146
4.1. Optimization procedure ... 146
4.2. Objective functions ... 147
4.3. Decision variables ... 151
XIV
5.1. Economic impact analysis ... 153
5.2. Environmental impact analysis ... 155
5.3. Building’s energy analysis... 156
5.4. Grid stress analysis ... 157
5.5. Recommendations ... 158
6. Conclusion ... 160
Conclusions and perspectives ... 163
Conclusions et perspectives ... 166
XV
Nomenclature
A area (m2)
𝐴𝑊 Windows area (m2)
ASHP Air source heat pump
AHU Air handling unit
ASHPWH Air source heat pump water heater
ASHRAE American society of heating, refrigerating, and air-conditioning engineers AIA American institute of architects
ACH Air change per hour
AHU Air handling unit
ASHHP Air source hybrid heat pump AWHP Air to water heat pump
APV Area of the photovoltaic array, m2 AHX Area of the heat exchanger, m2
AC Alternating current
AC Air Conditioner
AHP Analytical Hierarchy Process ADM Aide à la décision multicritère ANN Artificial Neural Network BIPV Building integrated photovoltaic
BIPV-T Building integrated photovoltaic thermal BIM Building information modeling
BCENN Bâtiment à consommation énergétique nette nulle BDG Biodiesel generator
COP Coefficient of performance
CHP Cogeneration or combined heat and power CO2eq Carbone dioxide equivalent
C Cooling
C Concordance index
C Cost, $
CI Consistency index
CDD Cooling Degree Days
CCHP Combined cool heat and power
CH4 Methane
CHP Combined heat and power
𝐶𝑝 Water specific heat, kJ/kg.K
D Discordance index
DWHR Drain water heat recovery DOE Department of energy DPBP Discounted payback period
XVI
DHW Domestic hot water
DMOPSO Dynamic multi objective particle swarm optimization algorithm
DC Direct current
DM Decision maker
DG Diesel generator
D Depth of borehole, m
DB Drain back
EAHE Earth to air heat exchanger ERV Energy recovery ventilation ECM Electronically computated motors
Ext. External
EH Electric heater
E East
EER Energy efficiency ratio
EPBD EU directive on energy performance of buildings
EAC Electrical AC unit
EP Energy performance
Ex Experimental
ECBC Energy Conservation in Building Codes EUIa Actual Annual Energy Use Index EUIr Reference Annual Energy Use Index
EUL LA End use loads for lighting and appliances (kWh/y)
Ex Experimental
EC Electrochromic
EC Annual Energy Cost ($)
EP Expanded polystyrene
ELECTRE Elimination and Choice Expressing the Reality ETSC Evacuated tube solar collectors
𝐸𝑏𝑢𝑖𝑙𝑑𝑖𝑛𝑔 Total energy consumption, kWh/y.m2
ɳPump Overall pump efficiency
F Façade
FH Floor heating
FFH Fossil fuel heater F1, Fn Fitness values
FCU Fan coil unit
FO Fuel oil
FC Floor cooling
FPSC, FP Flat plate solar collectors 𝑓𝑙𝑜𝑎𝑑 Load matching index
𝑓𝑔𝑟𝑖𝑑,𝑦𝑒𝑎𝑟 Grid interaction index
XVII
GHG Greenhouse gas
GSHP Ground source heat pump
GS Geothermal system
GPS Generalized pattern search algorithm
GA Genetic algorithm
GRG Generalized Reduced Gradient Algorithm
GPSPSOCCHJ Generalized Particle Swarm Optimization with Hook Jeeves algorithm GPS Generalized Pattern Search algorithm
g-value Solar energy transmittance GWP Global warming potential
𝑔(𝑚) Monthly renewable energy generation, kWh
HP Heat pump
HPWH Heat pump water heater
HR Heat recovery
HRV Heat recovery ventilation
H Heating
HVAC Heating, ventilation and air conditioning HERS Home Energy Rating System
HR Heat recovery
H Windows height (m)
HX Heat exchanger
HDD Heating Degree Days
IESNA Illuminating engineering society of north America IEA International energy agency
ICT Information and communication technologies
IC Initial cost ($)
Loc Location
LCC Life cycle cost
LCA Life Cycle Assessment
LCOE Levelized cost of energy, $/kWh
LiBr Lithium bromide
𝑙(𝑚) Monthly load, kWh
LCIA Life Cycle Impact Assessment LPD Long-term Percentage of Dissatisfied Mtoe Mega tons of oil equivalent
MPC Model predictive control MENA Middle East and North Africa
MOPSO Multi objective particle swarm optimization MOGA Multi-objective genetic algorithm
MILP Mixed Integer Linear Programming MOO Multi-objective optimization
XVIII MCDM Multi-criterion decision-making
MOABC Multi-Objective Artificial Bee Colony MOBO Multi-Objective Building Optimization tool 𝑚̇ Hot water mass flow rate, kg/h
N2O Nitrous oxide emissions NGCB Natural gas condensing boiler
NREL National Renewable Energy Laboratory
N North
N Life period (year)
N Population size
NED Net Energy Deficit
NG Natural gas
NZEB Net zero energy building NZEOB Net zero emission building NPEB Net positive energy building
NC Night cooling
NPC Net present cost
NED Net energy deficit (kWh)
NSGA Non-dominated sorting genetic algorithm nMEUL Normalized Modified End Use Loads (kWh/y) NREL National Renewable Energy Laboratory NZExB Net Zero Exergy Building
NZE Net zero energy
NPV Net present value
NV Natural ventilation
NETSC Number of evacuated tube solar collectors NFPSC Number of flat plate solar collectors OPP On-site Power Production (kWh/y)
OPOBEM Optimization of an Office Building envelope Energy performance and configuration Model
Off Office
O Orientation
OMO Optimisation multi objectifs
O&M Operation and maintenance costs, ($)
PV Photovoltaic
𝑃𝑊𝑊𝐻𝑃 Cooling capacity of water to water heat pump, RT 𝑃𝐵𝐷𝐺 Capacity of biodiesel generator, kW
𝑃𝐴𝑆𝐻𝑃 Cooling capacity of air source heat pump, RT 𝑃𝑝𝑢𝑚𝑝 Pump rated power, kW
𝑃𝐵 Natural gas condensing boiler capacity, kW 𝑃𝐶𝑇 Cooling tower nominal cooling capacity, RT
XIX 𝑃𝑊𝑇 Wind turbine rated power, kW
PNEB Positive-net energy building
PE Primary energy
PL Predominant load
PCM Phase change material
PV Photovoltaic
PV/T Photovoltaic-thermal PMV Predicted mean votes PBP Payback period (Year)
PPD Predicted Percentage of Dissatisfied
PROMETHEE Preference Ranking Organization METHod for Enrichment of Evaluations
Pt Parent population
Qcool Cooling demand (kWh/y.m2) Qheat Heating demand (kWh/y.m2) QDHW Domestic hot water load, kW Qt Child descendant population
Q̇abc Absorption chiller rated capacity, kW Q̇e Electric chiller rated capacity, kW RHP Reversible heat pump
Ref Reference
REC Renewable energy credits
RE Renewable energy
REHVA Federation of European heating, ventilation and air-conditioning associations RER Renewable energy ratio
Rad Radiator
R Roof
REUL LA Reference end use loads for lighting and appliances (kWh/y)
RC Reinforced concrete
Rt Initial population
RT Refrigerant tons
rd Annual discount rate (%) 𝑟 Objective functions number
SD Shading devices
SP Set point
SCNH Swedish center for zero-energy buildings SEER Seasonal energy efficiency ratio
SC Solar collector
S South
S Simulation
SS Solution set
XX
SF Solar fraction [%]
SS Sequential research
SDHW Solar domestic hot water
SCOP Seasonal coefficient of performance SHC Solar heating and cooling
SDHW Solar domestic hot water
SSPP Strategic Sustainability Performance Plan STPV Semi-transparent photovoltaic
SPF Spray Polyurethane Foam
S Credibility index
SS Sequential research
TOPSIS Technique for Order of Preference by Similarity to Ideal Solution
TSA Tabu Search Algorithm
Ti Indoor operative temperature (˚K)
𝑇𝑟𝑚 Exponentially weighted running mean of outdoor dry-bulb air temperature (˚K) ∆𝑇 Mean temperature difference between inside and outside (˚K)
𝑇𝑠𝑢𝑝𝑝𝑙𝑦 Temperature of supplied hot water, ˚C
𝑇𝑡𝑎𝑝 Tap water temperature, ˚C
Tmean1 Daily average outdoor air temperature on the same day, ˚C
Tmean2 Average outdoor air temperature for the past seven days, ˚C
TEU Total energy use (kWh/y) TPES Total primary energy supply
TRNSYS Transient system simulation program
TWh Tera watt hour
TC Thermochromic
Tor Temperature operation range ˚C Tw Temperature of water supply, ˚C Ta Monthly mean air temperature, ˚C TCF Temperature correction factor
TIC Technologies de l’information et de la communication tCO2eq Tons of CO2eq
U-value Thermal transmittance, W/m2.K
UK United kingdom
USGBC U.S. green building council
UNDP United Nations Development Program USPW (N, rd) Uniform Series Present Worth factor (years)
VAV Variable air volume
VT Ventilation tower
VTC Vacuum tube collector
VR Ventilation rate
XXI
V Room volume (m3)
𝑉𝑊 Mean wind speed (m/s)
𝑉𝑡𝑎𝑛𝑘 Storage tank volume, L WWR Window to wall ratio
W West
WT Wind turbine
WWHP Water to eater heat pump
WSM Weighted sum method
WPM Weighted product method ZEB Zero energy building
ZEH Zero energy home
ZEL Zero energy level
XXII
List of Figures
Figure 1. 1 World’s building sector TPES final consumptions between 2011 and 2015 (Data source: [1]) ... 11 Figure 1. 2 Shares by sectors of world’s TPES (2015) (Data source: [1]) ... 12 Figure 1. 3 World’s building sector electricity consumption between 2011 and 2015 (Data source: [1]) ... 12 Figure 1. 4 Shares by sectors of World’s Electricity Consumption (2015) (Data source: [1]) ... 13 Figure 1. 5 World buildings and residences CO2eq emissions between 2011 and 2015 (Data source: [1]) ... 14 Figure 1. 6 Traditional three steps to achieve NZEB... 15 Figure 1. 7 Basic elements in definition of NZEB [21] ... 22 Figure 1. 8 Percentage of implementing passive, energy efficient and RE systems by type of thermal demand in 30 NZEB case studies (Data source: [34]) ... 28 Figure 1. 9 Percentage of main parameters in the 35 most important global low/ZEB standards (Data source: [10]) ... 29 Figure 1. 10 zEPI Scale to zero net energy [75] ... 31 Figure 1. 11 HERS Scale to zero energy home [78] ... 33 Figure 1. 12 Energy Efficiency Rating [79] ... 34 Figure 1. 13 Flowchart of the first-stage in designing ZEBs ... 53 Figure 1. 14 Flowchart of optimization procedure in the second-stage ... 54 Figure 1. 15 Flowchart of the third-stage to categorize the ZEBs ... 54
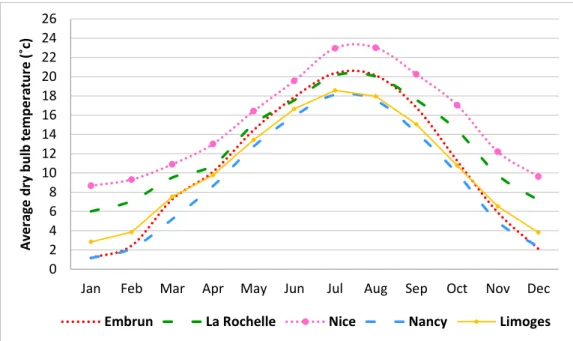
Figure 2. 1 Basic elements in definition of NZEB [16] ... 62 Figure 2. 2 Methodology to optimize NZEBs ... 64 Figure 2. 3 Methodology’s first step: Building simulation ... 65 Figure 2. 4 Methodology’s second step: Optimization procedure ... 67 Figure 2. 5 Methodology’s third step: MCDM ... 68 Figure 2. 6 Methodology’s fourth step: Sensitivity analysis ... 69 Figure 2. 7 Lebanon climatic zones [204] ... 70 Figure 2. 8 Monthly average dry bulb temperature for chosen regions in Lebanese climatic zones (Data source: [204]) ... 70 Figure 2. 9 France climatic zones [205] ... 71 Figure 2. 10 Monthly average dry bulb temperature for chosen regions in French climatic zones (Data Source: [206]) ... 72 Figure 2. 11 Plan view of building’s typical floors (with two apartments A and B) ... 73 Figure 2. 12 Monthly electrical load in each zone (kWh/m2) ... 78 Figure 2. 13 Monthly space heating thermal load (kWh/m2 of heated area) per zone ... 78 Figure 2. 14 Monthly space cooling thermal load (kWh/m2 of cooled area) per zone ... 79 Figure 2. 15 Bi-dimensional projections of the analyzed 4D-problem space for Beirut (Blue: Building variants, Red: Pareto-front) ... 84 Figure 3. 1 Typical floor plan of the base case building ... 99
XXIII Figure 3. 2 Occupants’ schedule of presence in living and dining, kitchen and bedrooms ... 101 Figure 3. 3 Hourly appliances consumption (kW) (Data source: [207,243]) ... 102 Figure 3. 4 World Map of Köppen–Geiger climate classification [244] ... 103 Figure 3. 5 Average energy costs (electricity and gas) in each of the investigated cities (Data source: [220,246–258]) ... 106 Figure 3. 6 Simulation phase steps to evaluate thermal loads and LCC ... 106 Figure 3. 7 Evaluated Qcool (kWh/y.m2), Qheat (kWh/y.m2) and 30-years LCC ($) for each of the investigated climates ... 107 Figure 3. 8 Building simulation and optimization phase steps ... 109 Figure 3. 9 Projection of “Category 1” Pareto front in (Qheat, LCC) 2D-space ... 112 Figure 3. 10 Projection of “Category 2” Pareto front in (Qcool, LCC) 2D-space ... 112 Figure 3. 11 Projection of “Category 3” Pareto front in (Qheat, Qcool) 2D-space ... 113 Figure 3. 12 Projection of “Category 3” Pareto front in (Qcool, LCC) 2D-space ... 113 Figure 3. 13 Projection of “Category 3” Pareto front in (Qheat, LCC) 2D-space ... 114 Figure 3. 14 Frequent solutions after ELECTRE III application for Singapore-Category 2 ... 115 Figure 3. 15 Sensitivity analysis phase steps ... 116 Figure 3. 16 Percentage of overheating hours for categories 2 and 3 ... 121 Figure 3. 17 Percentage of overheating hours after implementing the passive cooling strategies ... 123
Figure 4. 1 Typical floor plan of the Base case building ... 138 Figure 4. 2 Occupants’ schedule of presence in Living and dining, kitchen and bedrooms ... 140 Figure 4. 3 Hourly DHW consumption (L) ... 140 Figure 4. 4 Monthly cooling and heating loads for different regions ... 141 Figure 4. 5 Optimized objective functions for each solution set in different regions. a: Life cycle cost, b: CO2eq emissions, c: Grid interaction index, d: Total energy consumption ... 153 Figure 4. 6 Simple payback period of each solution set in different regions... 154 Figure 4. 7 LCOE for each solution set in different regions ... 155 Figure 4. 8 Load matching index for each solution set in different regions ... 156 Figure 4. 9 Variation of building’s annual energy load and RE generation. a) Indore, b) Tromso, c) Beijing ... 157 Figure 4. 10 ELECTRE III graphical representation. a) Indore, b) Tromso, c) Beijing ... 160
XXIV
List of Tables
Table 1. 1 NZEB RE supply option hierarchy (Data source: [13]) ... 19 Table 1.2 Summary of NZEB definitions ... 23 Table 1.3 NZEB requirements in some selected European countries (Data source: [29]) ... 25 Table 1. 4 Energy performance of some NZE Office buildings across Europe [35] ... 29 Table 1. 5 Case studies and buildings’ simulations general data, energy efficient systems adopted to cover HVAC and DHW loads, renewable electric and thermal systems and summary of the electrical balance ... 38 Table 1. 6 Most commonly used electric and thermal RE applications in different climates ... 44 Table 1. 7 Summary of recent studies on design optimization of NZEBs ... 47
Table 2. 1 Numerical scale for criteria comparative judgment (Data source: [203]) ... 68 Table 2. 2 Investigated building in each region ... 72 Table 2. 3 Building construction materials (Properties: Data source [207]) ... 73 Table 2. 4 SDHW system characteristics (Data source: [208]) ... 74 Table 2. 5 Parameters of PV module (Data source:[210]) ... 75 Table 2. 6 PV array size for different regions ... 76 Table 2. 7 Yearly electrical and thermal loads per zone ... 77 Table 2. 8 Summary of electrical balances in different regions ... 80 Table 2. 9 LCC for each region ... 80 Table 2. 10 Description and different options of decision variables used in the optimization problem ... 81 Table 2. 11 Implementation costs of different options used for the optimization analysis (Data source: [116], [47], [216], [217], [218] [219], [220], [221]) ... 82 Table 2. 12 Input parameters' setting of NSGA-II ... 83 Table 2. 13 Differences between the best attained value for each objective function and the base case ... 85 Table 2. 14 ELECTRE III method thresholds ... 86 Table 2. 15 Relative weight of each objective function and the consistency index for each case 86 Table 2. 16 Differences between the best solution by ELECTRE III and the base case ... 87 Table 2. 17 Summary of the optimal building design options in each region ... 88
Table 3. 1 Overview of the largely optimized passive parameters including the optimization characteristics (Data source: [5,31,40,47,82,84,92,97,98,106,107,109,110,112,115,126,129,131– 133,136,138–142,146–148,151,156,157,188,222–232]) ... 97 Table 3. 2 Thermo-physical characteristics of building's envelope (Properties: data source [207]) ... 100 Table 3. 3 Selected cities and climate characteristics (Data source: [244,245]) ... 104 Table 3. 4 Implementation costs of base case design options (Data source:[47,116,216]) ... 105 Table 3. 5 Categorization of investigated climatic zones ... 108
XXV Table 3. 6 Description and different options of decision variables used in the optimization
problem ... 110 Table 3. 7 Implementation costs of different glazing options used for the optimization analysis (Data source:[47,116,216,220,248,250–256]) ... 110 Table 3. 8 Input setting parameters of NSGA-II ... 111 Table 3. 9 Relative weight of each objective function for different DM preferences ... 115 Table 3. 10 Optimal decision variables with the highest percentage of occurrence ... 116 Table 3. 11 Summary of building energy and LCC savings ... 117 Table 3. 12 Comparison of the optimal decision variables with the benchmark recommendation ... 119 Table 3. 13 Options of passive cooling design strategies ... 122 Table 3. 14 Summary of the optimal passive cooling design strategies for each city ... 123 Table 3. 15 Summary of AC control months in each room ... 125 Table 3. 16 Summary of buildings’ cooling load, LCC, and savings after introducing passive cooling strategies and taking into account the occupants’ adaptive comfort ... 125
Table 4. 1 Some recently investigated NZEB energy production systems, and adopted evaluation criteria ... 134 Table 4. 2 Selected cities and climate characteristics (Data source: [244,245]) ... 138 Table 4. 3 Optimal U-value of building’s envelope elements in each region ... 139 Table 4. 4 Monthly AC control in each room ... 140 Table 4. 5 Summary of the investigated solution sets ... 143 Table 4. 6 ETSC characteristics (Data source: [286]) ... 143 Table 4. 7 FPSC characteristics (Data source: [208]) ... 144 Table 4. 8 Characteristics of borehole, U-type HX and working fluid (Data source: [290,291]) ... 145 Table 4. 9 Parameters of PV module (Data source:[210]) ... 145 Table 4. 10 Characteristics of WT (Data source: [292]) ... 146 Table 4. 11 Input parameters' setting of NSGA-II ... 147 Table 4. 12 Implementation cost of different design options (Data source:
[160,311,312,315,316,322,338,363–367])... 148 Table 4. 13 Annual O&M costs in percentage of the initial investment [293–295] ... 149 Table 4. 14 CO2eq emissions per type of energy source (Data source: [1,301,302]) ... 149 Table 4. 15 Different options of decision variable used in the optimization problem ... 151 Table 4. 16 Summary of the optimal decision variables for each solution set in different regions ... 152 Table 4. 17 Optimal solution sets in each region in function of evaluation criteria ... 158 Table 4. 18 ELECTRE III method thresholds ... 159
1
Introduction
A l’échelle mondiale, la charge énergétique des bâtiments continuera à augmenter dans les prochaines décennies. Les bâtiments (résidentiels, commerciaux et publics) ont consommé environ 30% de l'approvisionnement total en énergie primaire du monde en 2015 [1]. Si aucune mesure n'est prise pour améliorer l'efficacité énergétique dans les bâtiments, les besoins en énergie devraient augmenter de 50% d’ici à 2050 [2]. Fin de 2015, les bâtiments représentaient environ 49% de la consommation mondiale d'électricité, le secteur résidentiel représentant 27% de la consommation totale d'électricité et se classant au deuxième rang mondial des consommateurs d'électricité [1]. En général, les bâtiments sont aussi responsables d’environ 21% des émissions mondiales de CO2eq, avec environ 15% pour le secteur résidentiel [1]. Par conséquent, la consommation d'énergie du secteur résidentiel joue un rôle important dans l'augmentation des émissions mondiales de CO2eq et l’accélération du changement climatique.
Une nouvelle approche a émergé pour limiter la consommation d'énergie et les émissions polluantes dans les bâtiments : les bâtiments à consommation énergétique nette nulle (BCENN). De nombreuses recherches dans le monde tentent de trouver une définition générale pour le BCENN afin de faciliter leur application. Une revue de la littérature a montré qu’il n'y a pas de définition commune. Chacun définit le BCENN en fonction de ses besoins, intérêts et objectifs à atteindre.
L'optimisation multi objectifs (OMO) est une technique efficace pour évaluer, concevoir et obtenir la solution optimale pour une application spécifique. Les résultats d’OMO sont des ensembles de solutions non dominées appelées solutions optimales de Pareto, représentées par un front de Pareto [3][4]. Une fois le front de Pareto obtenu, vient l'importance d’un processus additionnel d’aide à la décision multicritère (ADM), pour sélectionner la solution optimale finale parmi toutes les solutions disponibles [5]. Des chercheurs du monde entier étudient l'applicabilité des méthodologies d'optimisation aux bâtiments, afin d'améliorer leur performance énergétique. La recherche d’une conception passive optimale pour chaque climat est un moyen essentiel d'aider les concepteurs à rendre les bâtiments énergétiquement efficaces, en particulier pour les bâtiments résidentiels. Les configurations et les capacités des systèmes d'énergie renouvelable (ER) mis en œuvre dans les BCENN doivent également être judicieusement sélectionnées pour garantir l'objectif de performance prévu. Les critères d'évaluation suggérés pour l'évaluation de la performance des BCENN sont divers et répondent à une variété de besoins.
2 Cette thèse est structurée comme suit:
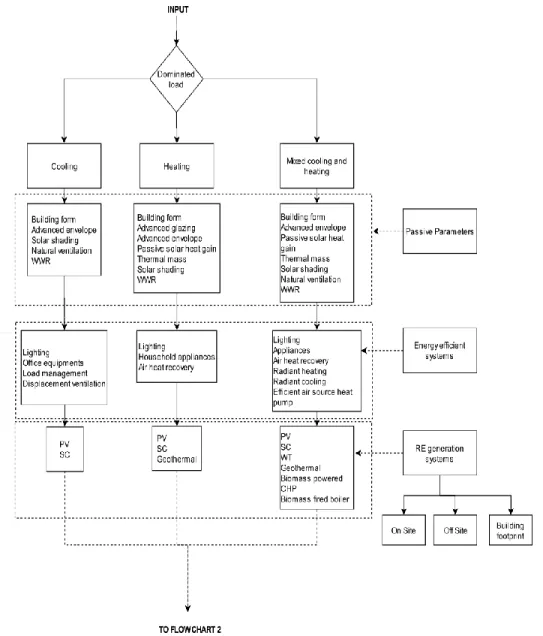
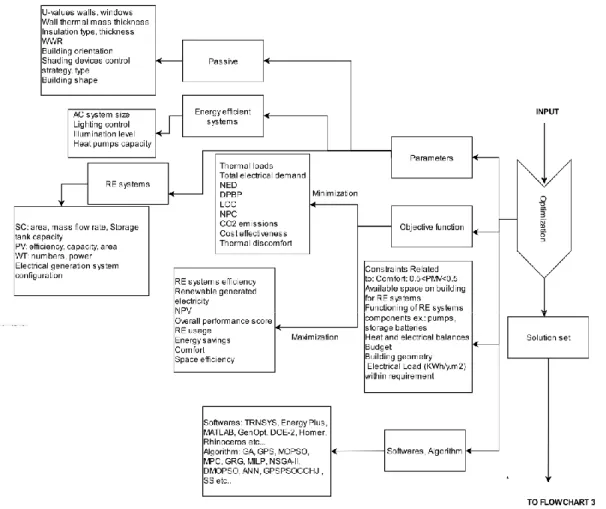
Le chapitre 1 fait une revue complète des définitions des BCENN à ce jour. Il s’en suit une présentation des études de cas typiques sous différents climats présents dans la littérature. Différentes méthodologies d'optimisation pour les bâtiments sont ensuite passées en revue. La technique d'optimisation, la fonction objective, les variables d'optimisation et les contraintes sont présentés. Les systèmes d’ER électriques et thermiques les plus couramment utilisées dans différentes zones climatiques sont également résumés. Un organigramme détaillé pour la conception de BCENN en trois étapes est suggéré.
Le chapitre 2 présente une méthodologie d’ADM pour l'optimisation des performances des BCENN. Le but de la méthode proposée est d'obtenir la meilleure solution de conception à partir d'un ensemble de solutions du front de Pareto, une solution qui reflète les préférences de décideur. La méthodologie de simulation proposée est composée de quatre étapes: simulation du bâtiment à l’aide d’un logiciel d’énergétique, optimisation, ADM et enfin, étude de sensibilité pour tester la robustesse du résultat optimal. En outre, elle est appliquée à un BCENN résidentiel typique dans différentes zones climatiques au Liban et en France. Enfin, un ensemble de recommandations est présenté afin d'améliorer la conception des performances des BCENN.
Le chapitre 3 mène une étude systématique pour trouver la conception passive optimale d’un bâtiment résidentiel. Vingt-cinq climats différents de la classification de Köppen Geiger sont simulés dans le but de produire les meilleures pratiques pour minimiser la demande énergétique du bâtiment (refroidissement et chauffage) ainsi que le coût du cycle de vie. Le confort thermique adaptatif des occupants est également inspecté dans le but d'obtenir des solutions de conception passives acceptables pour l’occupant.
Le chapitre 4 vise à aider les concepteurs de BCENN à choisir les options de conception appropriées en fonction d'une évaluation systématique. Il optimise et évalue six ensembles de solutions de conditionnement de l’air et d'ER pour passer d'un bâtiment à basse consommation énergétique (chapitre précédent), à un BCENN dans trois régions représentative des climats à besoin de refroidissement dominant, à besoin de chauffage dominant et mixte. Les ensembles de solutions étudiés sont des systèmes de production d'énergie fréquemment mis en œuvre dans la littérature. La performance des BCENN est évaluée en termes de performance combinée, composée d'indicateurs économiques (coût sur le cycle de vie, coût actualisé de l'énergie, délai de retour sur investissement), environnementaux (émissions en CO2eq), énergétiques (indice
3 d'autosuffisance énergétique, indice de réponse à la demande énergétique), et d’indicateur liés au réseau (indice d'interaction au réseau).
4
Introduction
Globally, buildings’ energy load is estimated to keep increasing in the next decades. Buildings (residential, commercial and public) have consumed around 30% of worlds’ total primary energy supply (TPES) in 2015 [1]. If no action is taken to develop energy efficiency in buildings, energy need is predicted to augment by 50% in 2050 [2]. By the end of 2015, buildings represented about 49% of the world’s electricity consumption, where the residential sector represents 27% of the total electrical usage and is ranked as the second-largest electricity consumer worldwide [1]. In general, buildings emit about 21% of global CO2eq emissions, and the residential sector, in particular, emits around 15% of universal CO2eq emissions [1]. Therefore, residential sector’s energy consumption plays an important role in increasing global CO2eq emissions and climate change.
Nowadays, a new approach is suggested to limit energy consumption and pollution emissions in buildings; Net zero energy buildings (NZEBs). Many studies in the world are trying to find a particular definition for NZEB in order to facilitate their application, by easily specifying and finding their target. There is no common definition. Each one defines NZEB depending on his/her needs, interests, and goals to achieve.
Multi-objective optimization (MOO) is an effective technique to evaluate, design and to get the optimal solution for a specific intention. MOO results are sets of non-dominated solutions called Pareto optimal solutions represented as a Pareto frontier [3][4]. Once the Pareto frontier is obtained, here comes the importance of the multi-criterion decision-making (MCDM) process in order to select the final optimal solution among all available possibilities [5]. Researchers worldwide are investigating the applicability of building optimization methodologies in order to enhance buildings’ energy performance. Adopting one optimal passive design recommendation for each climate is a fundamental way to help the buildings to become energy efficient, especially for residential buildings. The configurations and capacities of the implemented renewable energy (RE) systems in NZEBs must be appropriately selected to guarantee the intended performance objective. The inspected evaluation criteria suggested for NZEBs’ performance assessment are diverse and addresses a variety of needs.
This thesis is structured as follows:
Chapter 1 gives a comprehensive review of NZEB definitions that exist up-to-date, to the best of the authors’ knowledge. Followed by, a presentation of typical case studies in different
5 climates studied in the literature. Different optimization applications are reviewed, where the optimization techniques, objective functions, optimization variables, and constraints are presented. The most commonly used electric and thermal RE in different climatic zones are summarized. A detailed flowchart for three-stage of NZEB design is suggested.
Chapter 2 presents a MCDM methodology for NZEB performance optimization. The aim of the proposed method is to get the best design solution from a set of Pareto-front solutions, a solution which reflects the decision maker preferences. The suggested simulation-based methodology is composed of four steps: building energy simulation, optimization, MCDM and finally a sensitivity study to test the robustness of the optimal result. Besides, it is applied to a prototypical residential NZEB in different climatic zones in Lebanon and France. Finally, a set of recommendations is outlined in order to improve the performance design of NZEBs.
Chapter 3 conducts a comprehensive investigation on the optimal passive design for a case study residential building. Twenty-five different climates from Köppen Geiger classification are simulated with the aim to produce best practices to minimize building energy demands (cooling and heating) in addition to the life cycle cost (LCC). The occupants’ adaptive thermal comfort is also inspected aiming at getting more practical and detailed passive design solutions.
Chapter 4 aims to assist NZEB designers to select the suitable RE solution sets based on a systemic evaluation. It optimizes and evaluates six RE solution sets to go from low energy building to NZEB in one representative city of cooling dominant, heating dominant and mixed climates. The investigated solution sets include the frequently implemented or considered energy production systems in the literature. The performance of NZEB is evaluated in terms of combined performance comprised of economic indicators: LCC, levelized cost of energy (LCOE), and simple payback period, environment indicator: CO2eq emissions, energy balance and self-sufficiency indicator: load matching index in addition to grid stress indicator: grid interaction index.
7
Chapitre 1: Bâtiments à consommation énergétique nette nulle : Revue des
définitions et approches d’optimisation en fonction des climats.
Résumé en Français
Le concept des bâtiments à consommation énergétique nette nulle (BCENN) a été introduit pour limiter la consommation d'énergie et les émissions polluantes dans les bâtiments. Depuis 2006, le nombre des publications et des projets traitant ce sujet sont en constante augmentation. Cependant, il demeure difficile de trouver une définition globale de BCENN regroupant tous les concepts. Des nombreuses organisations et chercheurs ont présenté leur définition permettant de classer les BCENN. La classification de BCENN est basée sur les options de production d’énergie renouvelable (ER), le processus de mesure de l'énergie, la localisation des sources d’ER et les bilans, qu'ils soient énergétiques ou exergétiques. Une des définitions les plus courantes est qu’un BCENN est un bâtiment avec des demandes énergétiques significativement basses, qui sont assurées à la fois par les ressources de réseau public et d’ER du site. De plus, la balance annuelle entre les deux sources d’énergie est au moins égal à zéro ou en faveur des ER du site.
En général, il est convenu qu'il y a trois étapes principales pour atteindre la performance BCENN : d’abord l'utilisation des stratégies passives, puis l’utilisation de technologies économes en énergie et enfin, le recours à des systèmes de génération d'ER. Ces trois étapes traditionnelles peuvent s'accompagner de l'intégration intelligente de technologies énergétiques avancées telles que le photovoltaïque-thermique, le photovoltaïque intégré au bâtiment, les fenêtres avec vitrage photovoltaïque semi-transparent, les technologies de contrôle de l'éclairage naturel, les fenêtres avec vitrage électrochrome et thermochrome, les dispositifs d'ombrage contrôlés et les systèmes de stockage thermique intégrés au bâtiment [6].
Un état de l'art montre que l’essentiel des études sur les BCENN visent à économiser l'énergie, réduire la facture d'électricité, assurer l'indépendance énergétique, réduire les émissions polluantes et assurer le confort des occupants. Certaines études s'intéressent également à l'esthétique en combinant des technologies modernes pour atteindre une haute performance énergétique et améliorer la durabilité.
Le recours à des méthodes d’optimisation est une voie prometteuse pour évaluer les choix de conception des BCENN. L'optimisation d'une fonction objective liée à l’énergie et/ou
8 l’environnement et/ou l’économie est faite pour choisir la solution optimale permettant d’atteindre la consommation énergétique nette nulle.
Ce chapitre commence par présenter les défis énergétiques et de pollution auxquels le monde est confronté. En outre, il montre, au mieux à la connaissance de l'auteur, les définitions existantes pour le BCENN et les études de cas correspondantes dans huit zones climatiques différentes (climat continental humide, subtropical humide, méditerranéen, continental modéré, océanique, tropical, aride, chaud). Le chapitre relève également l'importance de traiter chaque climat séparément car même au sein d’un même pays, deux ou plusieurs climats coexistent généralement. Les inconvénients des BCENN sont également présentés. Différents problèmes d'optimisation sont également examinés dans la dernière section. Finalement, trois organigrammes sont proposés pour résumer l’état de l’art sur les BCENN. L’un présente les étapes de conception de ces bâtiments, le second, les différentes procédures d'optimisation tandis que le dernier permet de catégoriser les BCENN.
Ce chapitre est basé sur l’article de revue:
Fatima Harkouss, Farouk Fardoun, Pascal Henry Biwole. Optimization Approaches and Climates investigations in NZEB-A Review, Building Simulation journal, in press, 2018.
9
Chapter 1: Optimization Approaches and Climates Investigations in NZEB -
A Review
Abstract
The conception of net zero energy buildings (NZEB) has been introduced to limit energy consumption and pollution emissions in buildings. Classification of NZEB is based on renewable-energy (RE) supply options, renewable-energy measurement process, RE-sources location, and balances whether are energetic or exergetic. In general, it is traditionally agreed that there are three main steps to reach the NZEB performance, starting through the use of passive strategies, energy efficient technologies, and then RE generation systems. Then, these three steps could be accompanied with the smart integration of advanced efficient energy technologies. A state of the art shows that the main ZEB studies are related to: energy savings, reduce electric bills, energy independence, pollution reduction, and occupants comfort, in addition, others are more interested in the aesthetic aspect by combining modern technologies with innovations to achieve high energy and sustainability performance. Building optimization is a promising technique to evaluate NZEB design choices; it has been adopted to choose the perfect solution to reach the zero energy performance through the optimization of an objective function related to energy (thermal loads, RE generation, energy savings) and/or environment (CO2 emissions) and/or economy (Life-cycle cost (LCC), Net-present value (NPV), investment cost). This chapter starts by presenting the global energetic and pollution challenges the world faces. Moreover, it shows, to the best to the author’s knowledge, the existing NZEB definitions and the corresponding case studies investigated in 8 different climatic zones (Humid continental, humid subtropical, Mediterranean, moderate continental, marine west coast, tropical, semi-arid and hot), the chapter also focus on the importance to treat each climate separately. Even in the same country, two or more climates may co-exist. NZEBs drawbacks are also presented. Furthermore, different optimization problems are reviewed in the last section. Building energy optimization methods are employed to obtain the ideal solution for specific objective functions which are either related to energy, and/or environment and/or economy. Optimization variables are distributed between passive and/or RE generation systems. Finally, a table summarizing the most commonly used electric and thermal RE applications which yield to the zero energy balance in each climate, as well as three flowcharts are presented to summarize the whole three-stage procedure, to reach NZEB, starting from
10 building designing, passing through the optimization procedure, and lastly categorizing the zero energy balance.
11
1. Introduction
Economic growth and social development nowadays push governments to focus on providing population with necessary energy requirements. Concerns about energy security arise from increasing energy demand, rising oil prices, and doubts from oil and fossil fuel depletion. Currently, the concept of energy security includes challenges to provide secure, unabated, reasonably priced, and sustainable energy sources for electricity supplies and other energetic applications, taking into consideration reducing greenhouse gases emissions and exploiting renewable energy (RE) resources [7].
Globally, buildings’ energy load is estimated to keep increasing in the next decades. Buildings (residential, commercial and public) have consumed around 30% of worlds’ total primary energy supply (TPES) in 2015 [1]. As Figure 1. 1 shows, TPES final consumption in buildings has grown from 2776.48 Mtoe in 2011 to 2806.88 Mtoe in 2015, and it is predicted to reach 4400 Mtoe by 2050 [1,8]. The residential sector represents approximately 73% of TPES final consumption in buildings, and is ranked as the third-largest main energy consumer worldwide (21.85% of world’s TPES) after industrial and transportation sectors (Figure 1. 2). If no action is taken to develop energy efficiency in buildings, energy need is predicted to augment by 50% in 2050 [2].
12
Figure 1. 2 Shares by sectors of world’s TPES (2015) (Data source: [1])
By the end of 2015, buildings represented about 49.29% (9957.86 TWh) of the world’s electricity consumption, where the residential sector represents 27% (5465.7 TWh) of the total electrical usage, and is ranked as the second-largest electricity consumer worldwide (Figure 1. 3, Figure 1. 4). Comparing these values to those of 2011, the electric consumption in buildings sector is increased by 8.13% [1].
13
Figure 1. 4 Shares by sectors of World’s Electricity Consumption (2015) (Data source: [1])
The greenhouse gases emissions due to climate changes are becoming more and more obvious to scientists. Figure 1. 5 shows that during 2015, CO2eq emissions from building sector are estimated to be about 6680.37 MtCO2eq, which illustrates a raise when compared to the emissions of the year 2011 (6635.78 MtCO2eq). In general, buildings emit about 21% of global CO2eq emissions, and the residential sector in particular emits around 15% of universal CO2eq emissions [1]. Therefore, residential sector’s energy consumption plays an important role on increasing global CO2eq emissions and climate change. Furthermore, climate change affects solar radiation, wind speed and direction, precipitation, temperature, and humidity, which in turn influence electricity demand for cooling and heating loads in buildings. Hence, the relationship between building energy consumption and climate change is reciprocal. An investigation in Europe shows that climate alteration will lead to an increase in winter's humidity by 15% in 2020 and 25% in 2050. Another investigation shows that London's cooling degree-days had augmented by 20% and 60% in 1995 and 2005 respectively when compared to 1976, and will be increased by 200% in 2080 [8].
14
Figure 1. 5 World buildings and residences CO2eq emissions between 2011 and 2015 (Data source: [1])
Medical progress, public health amelioration, personal hygiene, food availability, and development in agriculture, industry, and transport sectors are reasons of the growth in population. The world’s population size has increased from 6.99 billion in 2011 to 7.33 billion in 2015 (increase of 4.8%) [1]. It is expected that the population will keep growing to reach 8.5 billion in 2030 [9]. Increase of population means an increase of energy consumptions which exert more demands on energy resources and making them rare.
The world energy consumption is also affected by urbanization rates. The urbanization rate is predicted to attain 56% by 2020 [8].
Nowadays, a new approach is suggested to limit energy consumption and pollution emissions in buildings (since buildings have a real potential to ameliorate energy efficiency); NZEBs. In this work, a comprehensive review on NZEB definitions that exist up-to-date, to the best of the authors’ knowledge, is carried out. Followed by, a presentation of typical case studies in different climates studied in literature. Different optimization applications are reviewed, where the optimization technique, objective function, optimization variables, and constraints are presented. The most commonly used electric and thermal RE in different climatic zones are summarized. A detailed flowchart for three-stage of NZEB design is suggested.
15
2. NZEB definitions
Many researches in the world are trying to find a particular definition for NZEB in order to facilitate their application by easily specifying and finding their target. There are in excess of 70 low or zero energy/carbon building definition and standards around the world [10]. This section presents the most known international NZEB definitions. There is no common definition; each one defines NZEB depending on his needs, interests, and goals to achieve. In general, it is agreed that the three traditional essential steps to achieve the NZEB performance are as presented in Figure 1. 6: the utilization of passive design strategies, energy efficient technologies and RE generation systems [11][12].
Moreover, these three traditional steps could be accompanied with the smart integration of advanced efficient energy technologies such as photovoltaic-thermal (PV/T), building-integrated PV (BIPV), windows with semi-transparent PV (STPV) glazing, daylighting control technologies, including electrochromic (EC) and thermochromic (TC) windows coatings, controlled shading devices and building integrated thermal storage (BITES) [6].
Figure 1. 6 Traditional three steps to achieve NZEB Passive Strategies
•Envelope Insulation •Orientation •Natural ventilation •Daylighting
•Phase change material (PCM)
Energie efficient technologies
•HVAC
•Domestic hot water (DHW) •Lighting •Appliances RE generation systems •Photovoltaic (PV) •Wind turbines •Solar collectors
16
2.1. General definition
A ZEB is a building with significantly small energy demands and the balance of energy demands can be provided by RE systems [13]. ZEB can be divided in two types: grid-connected and off-grid (stand-alone). NZEB is a ZEB connected to the utility grid (electricity grid, district hot water, or other central energy distribution system) to balance its energy needs. NZEB might employ utility’s energy when the on-site RE generation doesn’t meet its needs. However, it has to return back to the grid the equivalent of the energy drawn as a RE form in a yearly basis, in order to maintain the zero energy status of the building. Once the on-site energy production surpasses the building’s needs, the additional energy is transferred to the utility grid, or stored in the building for later use during non-favorable weather conditions. The off-grid ZEB is a grid-independent building that requires supplemental on-site generation potentials combined with important energy storage technologies. In addition to RE, it usually imports fossil energy sources for backup generators, cooking, domestic hot water and space heating to cover the energy demands. Some buildings (hospitals, laboratories, grocery stores) have high energy needs, so they tend to utilize off-site supply options to reach NZEB position [14].
A NZEB can be classified as high-quality when it exploits the passive strategies and energy efficient technologies to the maximum extents, and then utilizes the available RE resources within the building footprint.
Weather conditions influence the RE resources. During winter, summer or abnormal seasons, solar and wind energies may highly fluctuate. Hence, a building may not achieve a NZE situation each year, so it may fall into near NZEB. The NZEB position must be followed-up each year by means of necessary metering systems [14].
2.2. International organizations adopted definition
According to the American Society of Heating, Refrigerating, and Air-Conditioning Engineers (ASHRAE), the one way to decide if a building can be considered NZEB is to consider the energy crossing the building's boundary. For source, emission and cost NZEB definitions to be considered, conversion coefficients for the metric of benefits are needed. However, these coefficients are difficult to obtain. ASHRAE in agreement with the American Institute of Architects (AIA), the U.S. Green Building Council (USGBC), and the Illuminating Engineering Society of North America (IESNA) adopted the Net zero site energy to define NZEB. This
17 definition corresponds to a building that produces as much RE as its annual consumption when measured at the site. NZEBs can switch energy with the utility grid as long as the net energy balance is zero on an annual basis [15]. Moreover, The Federation of European Heating, Ventilation and Air-conditioning Associations (REHVA) defines a NZEB as grid-connected energy-efficient building that equilibrates its total annual energy demands by on-site energy production and related feed-in green credits [16]. On the contrary of an independent building and to highlight the balance concept, the term “Net” has been presented. So, it is possible to classify buildings as NZEBs, nearly NZEBs or Net plus energy buildings. Knowing that, in independent buildings, the “net” term does not exist, since there is no connection with the grid. The European Directive on Energy Performance of Buildings (EPBD) defines “nearly zero-energy building” as a building with high energy performance. The almost nil or slight quantity of energy required in the building must be ensured to the maximum extent by RE resources whether located on-site or nearby [17]. The U.S. department of energy (DOE) defines NZEB, residential or commercial, as a building with reduced needs for energy through efficiency gains (60 to 70 percent lower than conventional practice), with the balance of energy demands supplied by RE technologies. In the residential sector, the US DOE called NZEB as a net zero energy home (NZEH). A net-zero energy home produces annually, with on-site RE sources, as much energy as it consumes. The home must offer an accepted level of service and comfort. Purchased fuel will be transformed to an electrical equivalent at a conversion efficiency of 40%. Co-generation with purchased fuel is not involved [18]. Lausten, in an IEA information paper (2008) [19], defines ZEB as a building that does not utilize fossil fuels and obtains all its energy needs from RE resources such as solar energy. According to Lausten there are several ways to classify ZEBs:
1. Zero Net Energy Buildings: they are yearly neutral buildings; the energy exported from
the building to the supply grid is equal to that imported from the grid. This type of buildings does not use fossil fuels for any energy needs.
2. Zero Stand Alone Buildings: these buildings do not need to be connected to the utility
grid. They may use it just as backup. They are self-independent, they generate the required energy to cover their energy needs, and are capable to store the generated energy for night-time or winternight-time employ.
18
3. Plus Energy Buildings/Net Positive Energy Buildings (NPEB): these buildings transfer
to the supply grid more energy than they yearly import from it, as they generate much more RE than they need.
4. Zero Carbon Buildings: these buildings use energy resources that do not contribute to
CO2 emissions. They are carbon neutral or positive, which means that they generate sufficient free-CO2 energy to cover their yearly energy needs.
2.3. RE supply option hierarchy
Torcellini et al. (2006) developed a hierarchy which classifies NZEBs based on RE supply options that a building can employ (Table 1. 1) [13].
1- Option 0: it tends to lower building’s energy demands through energy efficient
technologies and demand-side RE systems. The demand-side RE systems correspond to the passive use of RE sources, for example: the solar day-lighting, passive solar heating, passive cooling, wind catching.
2- Option 1: it is an on-site supply option. It tends to exploit RE sources available within
building’s footprint. Generated RE is directly connected to building’s energy distribution systems (electricity, hot water), which reduces transmission and distribution losses. The footprint energy collection area is assured to provide long-term production over building’s lifetime; accordingly it is not necessary to displace/disassemble these systems due to future development plans of adjacent lands.
3- Option 2: it is an on-site supply option. It tends to exploit RE resources available at the
boundary of building’s site, but not mounted on the building’s roof itself or within its footprint.
4- Option 3: it is an off-site supply option. It tends to bring to site off-site renewable resources
in order to generate electricity on-site, these resources must be available within the building lifetime .This option is less preferable than options 1 and 2, because of the Carbon traces related to the production and transportation of renewable resources to the site.
5- Option 4: it is an off-site supply option. It consists to purchase installed RE sources.
Building owner negotiates with Power Company in order to build off-site wind turbine and solar PV because of better off-site solar and wind resources. The building might own a part of the hardware and obtain credits for the power. The building would also pay an amount
19 to the utility to transport this energy. It is the worst classification; in general, it does not reduce the energy consumption.
Table 1. 1 NZEB RE supply option hierarchy (Data source: [13])
Option 0 →
Building envelope improvement, efficient energy measures &demand-side RE technologies
→
Insulation, efficient equipment, lighting, passive solar heating, day-lighting, solar ventilation air pre-heaters, natural ventilation, evaporative cooling.
Option 1 → RE within building footprint → Thermal solar collectors, PV located on building’s roof or façade, building-mounted wind turbines.
Option 2 →
RE at boundary of building’s site, not mounted on building nor within building footprint
→
Parking lot PV, ground-mounted thermal solar systems, tower-based wind turbines, on-site solar-driven chiller.
Option 3 → RE from off-site to produce
electricity on-site →
Wood pellets, biodiesel, waste, and vegetable oil imported to the site, combined heat and power (CHP) systems, to produce electricity and heat.
Option 4 → Purchase installed off-site certified RE source →
PV panels installed off-site, utility-based wind turbines, RECs (e.g. Green credits certified by Green-E (2009)).
2.4.Classification based on energy measurements methods
Torcellini et al. (2006) classified NZEB into four categories based on energy measurements process, in order to clarify the concept of NZEB [13]. Each category can be used to achieve a certain owner’s project target. And, there is no category better than the other. Every category exploits the grid for net usage and has various appropriate RE resources.
1- Net-zero site energy: a building that yearly generates from RE at least as much as it
consumes.
o Advantages: easy to achieve, can be directly measured, easy to understand by the
building society, no outside fluctuations (e.g. fuel prices, availability) could affect the performance of the building.
o Disadvantages: needs additional electrical exports from solar energy to offset
natural gas use. Doesn’t equate energy values of fuel kinds, does not take into consideration the non-energy distinctions between fuel kinds (supply availability, pollution). It doesn’t necessary achieve energy price savings. If peak loads and utility bills are not controlled, the energy charges may not be minimized.
2- Net-zero source energy: a building that yearly generates at least as much RE as it
![Figure 1. 3 World’s building sector electricity consumption between 2011 and 2015 (Data source: [1])](https://thumb-eu.123doks.com/thumbv2/123doknet/12923166.373488/39.918.174.745.104.417/figure-world-building-sector-electricity-consumption-data-source.webp)


![Figure 2. 8 Monthly average dry bulb temperature for chosen regions in Lebanese climatic zones (Data source: [204]) -202468101214161820222426283032](https://thumb-eu.123doks.com/thumbv2/123doknet/12923166.373488/97.918.142.773.618.972/figure-monthly-average-temperature-chosen-regions-lebanese-climatic.webp)
![Figure 2. 9 France climatic zones [205]](https://thumb-eu.123doks.com/thumbv2/123doknet/12923166.373488/98.918.233.684.511.864/figure-france-climatic-zones.webp)
![Table 2. 3 Building construction materials (Properties: Data source [207]) Components Layers (Out to in)](https://thumb-eu.123doks.com/thumbv2/123doknet/12923166.373488/100.918.190.730.110.488/table-building-construction-materials-properties-source-components-layers.webp)
