Abstract — Neural prostheses have generally relied on signals from cortical motor regions to control reaching movements of a robotic arm. However, little work has been done in exploring the involvement of nonmotor cortical and associative regions during motor tasks. In this study, we identify regions which may encode direction during planning and movement of a center-out motor task. Local field potentials were collected using stereoelectroencephalography (SEEG) from nine epilepsy patients implanted with multiple depth electrodes for clinical purposes. Spectral analysis of the recorded data was performed using nonparametric statistical techniques to identify regions that may encode direction of movements during the motor task. The analysis revealed several nonmotor regions; including the right insular cortex, right temporal pole, right superior parietal lobule, and the right lingual gyrus, that encode directionality before and after movement onset. We observed that each of these regions encode direction in different frequency bands. This preliminary study suggests that nonmotor regions may be useful in assisting in neural prosthetic control.
I. INTRODUCTION
Motor control and its neural correlates have been studied for decades. Pioneering work describing how neurons in the motor cortex tune with movement direction led to the emergence of a plethora of primate experiments [1]. Unlike the primary visual cortex, where the neural activity represents patterns of light, there is a debate as to whether the neural activity in the motor cortex represents movement parameters [2]. It seems that motor control activity is the confluence of many distributed neuronal firing patterns [3].
Only a few studies have used invasive recording techniques to understand the role of nonmotor regions in motor control [4-6]. The majority of the studies have been conducted using neuroimaging techniques such as positron emission tomography (PET) and functional magnetic resonance imaging (fMRI) [3]. These signal acquisition techniques suffer from limitations such as low spatial resolution, low temporal resolution, or recording far from the neural source [7].
In this study nine epilepsy patients implanted using stereoelectroencephalography (SEEG) participated in a center-out motor task. SEEG not only offers millisecond temporal resolution but also offers a wide coverage of both deep and peripheral brain structures, signals that are inaccessible by traditional techniques [8]. Thus, SEEG allows us to investigate a wide range of nonmotor regions and explore their involvement in motor control.
For each trial, subjects were asked to make reaching movements to targets at different speeds. This provides an opportunity to analyze the neural correlates of motor control
under various movement speeds. Here we examine two separate epochs in the task trial; one window is associated with motor planning while the other captures the neural signals during movement execution. We identified parts of the occipital and parietal lobe that encode directions during motor planning, while parts of the insular cortex, superior frontal sulcus, and lingual gyrus encode direction during movement execution. These results suggest that many nonmotor regions are involved in motor control and warrant further investigation to gain a holistic understanding of how movements are generated.
II. METHODS
A. Subjects
SEEG recording was performed in medically refractory epileptic patients in order to define the epileptogenic zone for possible resection. The choice of electrode location was based on preimplantation video-EEG recordings and was made independently of the present study. This study did not add any invasive procedure to depth SEEG recordings. All subjects enrolled voluntarily and gave informed consent. Experimental protocols were approved by the Cleveland Clinic Institutional Review Board. Methods were carried out in accordance with approved guidelines. Criteria required 9 individuals over the age of 18 with the ability to provide informed consent and perform the behavioral tasks. Besides the behavioral experiments, no alterations were made to the course of clinical care.
B. Stereoelectroencephalographic (SEEG) Implantations For each subject, approximately 8 to 13 stereotactically placed electrodes were implanted. Each electrode contact had a 0.8 mm diameter, was 2 mm long, and contacts were spaced 1.5 mm apart. Depth electrodes were inserted using a robotic surgical implantation platform, (ROSA, Medtech Surgical Inc., USA) in either orthogonal or oblique orientations, allowing intracranial recording from lateral, intermediate and/or deep cortical and subcortical structures in a three-dimensional arrangement [9]. See Fig. 1. The day prior to surgery, volumetric preoperative MRIs (T contrasted with Multihance® - 0.1mmol/Kg) were obtained and used to preoperative plan electrodes trajectories. All trajectories were evaluated for safety; any trajectory that appeared to compromise vascular structures was adjusted appropriately without affecting the sampling from areas of interest. C. Electrophysiological Recordings
SEEG electrophysiological data was acquired and achieved using a conventional clinical electrophysiology
The Role of Nonmotor Brain Regions during Human Motor Control
Jacob J. Johnson, Macauley S. Breault, Pierre Sacre, Matthew S. D. Kerr, Mathew Johnson, Juan
Bulacio, Jorge Gonzalez-Martinez, Sridevi V. Sarma -Member IEEE, John T. Gale
J.J.Johnson is with the Department of Electrical and Electronics Engineering, Indian Institute of Technology Guwahati, Assam 780139 India (e-mail: [email protected]). M. S. Breault, P. Sacre, M. Kerr, K. Kahnand S.V. Sarma are with the Department of Biomedical Engineering, Johns Hopkins University, Baltimore, MD 21218 USA (e-mail: ssarma2@ jhu.edu). J. T. Gale is with the Department of Neurosurgery, Emory University (e-mail: [email protected])
acquiring system (Nihon Kohden 1200, Nihon Kohden America, USA) at a sampling rate of 1 KHz for the motor task. Behavioral event data were simultaneously acquired during behavioral experiments along with the SEEG electrophysiology and stored for subsequent analysis. This is a provisional file, not the final typeset article SEEG electrophysiology and stored for subsequent analysis. All signals were referenced to contact affixed to skull. Archived electrophysiological data was not filtered prior to offline analysis.
Each patient had electrode contacts characterized according to anatomical location. The anatomical locations of all contacts were identified through inspection of post-operative imaging, requiring agreement by two clinical experts. Coronal and sagittal views were available for every contact. None of the recording electrodes selected for this study demonstrated epileptic activity (ictal or interictal) during the recording session.
D. Motor Task
Subjects performed the behavioral task in their Epilepsy Monitoring Unit (EMU) room while seated in a chair that was placed in front of the behavioral system (Fig. 1A), using methods previously described in [10]. The behavioral system consisted of a computer presentation screen, an InMotion2 robotic manipulandum (Interactive Motion Technologies, USA), and a behavioral control system. The computer screen was used to present task stimuli to the subject and was located approximately two feet from the subject’s sitting position. The robotic manipulandum is an FDA-approved device for motor recovery and allows for the precise tracking of arm position in a horizontal two-dimensional plane relative to the subject. This manipulandum allows the subject to control the position of a cursor during the behavioral task and was used to apply force perturbations to the subject during precise elements of the behavioral task. The behavioral control system consisted of a Windows-based laptop computer running MonkeyLogic through a MATLAB® interface (MathWorks, USA).
E. Data Analysis
All electrophysiological and behavioral analyses were conducted offline using custom MATLAB scripts. To search for direction-encoding brain regions, we examined differences in the neural responses between two specified direction conditions (condition 1 and condition 2) during specific epochs in the trial (target cue and go cue) by means of a nonparametric cluster statistic, applied to spectrograms [11].
Oscillatory power was calculated using multitapers from the Chronux toolbox [12]. Three orthogonal tapers were used with a 300 ms window sliding at 50 ms steps was used. The power for each frequency time bin was log normalized based on the power across the entire recording session by fitting the log of the power in each frequency bin to a Gaussian distribution.
The task conditions were defined as groups of directions. For example, condition 1 could be (Up and Right) and condition 2 would be (Down and Left). Therefore, 7 unique
combinations of conditions called for comparison. Spectrograms for each brain region were constructed and averaged across trials time-locked to the specified epoch all subjects.
A nonparametric cluster-based test was performed to compare spectrograms of both conditions. This test finds statistically significant differences between any given contiguous time-frequency windows for comparative conditions by leverages the dependency between adjacent frequency-time windows in order to avoid over penalizing with multiple comparison corrections [11].
Clusters are defined as a set of adjacent time-frequency windows whose activity differs significantly between condition 1 and condition 2 trials. For each frequency-time window in the spectrogram, a null distribution was created by shuffling the condition labels for trials within each subject 1000 times. For each shuffle, the average difference between the newly labeled spectrograms was calculated. A p-value was assigned to each window by comparing the difference acquired from the true labels with the distribution of differences acquired from the shuffled labels. Clusters were formed by grouping windows with significant p-values (p<0.01) that were adjacent in either time or frequency. The test statistic for each cluster was calculated by taking the sum of the log of the p-values for each window in the cluster. This prioritizes clusters that have both strong differences as well as large sizes. The observed cluster statistic was obtained with the original labels. It, in turn, was then compared against the null distribution of cluster statistics in order to obtain the final p-value of the test.
Figure 1: Motor Task. (A) Subject sits in front of screen. (B)
Slides are numbers left to right, the cursor controlled by the manipulandum is yellow. (1) Bar instructing the subject how fast to move. (2) Home target appears. (3) Upon the cursor reaching the home target, a new target appears. (4) The new target turns green, functioning as a go cue. (5) In this example, the movement speed is inside the allowable range, so the image of a five-dollar bill was shown, functioning as a reward.
B
A
A
Test test test
TABLE 2
Go cue regions and corresponding spectrograms
Regions Frequency Band Condition 1 Condition 2
Superior frontal
sulcus 2 – 4 Hz Right Up, down, and right
Right lingual
gyrus 5 – 19 Hz Right
Up, down, and right Right temporal
pole 17 – 78 Hz Up and down Right and left
Right insular
cortex 50 – 92 Hz Right
Up, down, and right Right insular
cortex 50 – 92 Hz Up and Right Down and left
Supracalcarine
cortex 92 – 200 Hz Left Up, right, and down
TABLE 1
Target cue regions and corresponding spectrograms
Regions Frequency Band Condition 1 Condition 2
Right lingual
gyrus 4 – 38 Hz Up and left
Down and right Right occipital
gyrus 7 – 32 Hz Up and left
Down and right Right temporal pole 27 – 109 Hz Down Up, right, and left Right superior
parietal lobe 51 – 142 Hz Up and left
Down and right Postcentral gyrus 38 – 200 Hz Up Right, down, and left Left parietal
lobe 46 – 200 Hz Up and left
Down and right
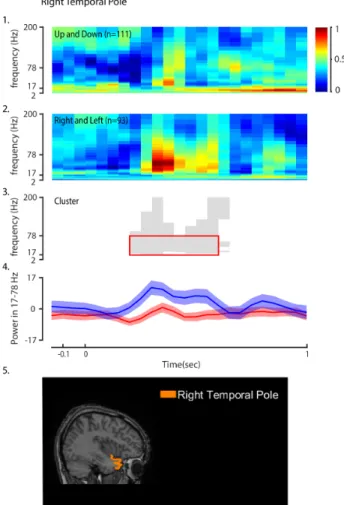
Figure 2: Right temporal pole during go cue. The number n
represents the number of trials pooled for the condition from all subjects. (1) Average spectrogram for condition 1 (Up and Down). (2) Average spectrogram for condition 2 (Left and Right). (3) Significant Cluster (p=0.001) obtained from the cluster based nonparametric cluster statistic. (4) Mean oscillatory power within 17-78 Hz. (5) Position of right temporal pole.
Figure 3: Right lingual gyrus during target cue. The number n
represents the number of trials pooled for the condition from all subjects. (1) Average spectrogram for condition 1 (Up and Left). (2) Average spectrogram for condition 2 (Down and Right). (3) Significant Cluster (p=0.001) obtained from the cluster based nonparametric cluster statistic. (4) Mean oscillatory power within 4-38 Hz. Error bars represent two standard error from mean. (5) Position of right lingual gyrus.
III. RESULTS
A. Nonmotor Regions during Target Cue
During the target cue, six regions were identified with significant clusters. Table 1 lists out these regions and their corresponding significant frequency bands. Figure 3 shows the mean spectrogram and the significant cluster of a region during target cue.
B. Nonmotor Regions during Go Cue
For the movement execution, six regions were identified with significant clusters. Table 2 lists out these regions and their corresponding significant frequency bands. Figure 2 shows the mean spectrogram and the significant cluster of a region during go cue.
IV. DISCUSSION
The above analysis shows that SEEG spectrogram analysis has the ability to capture neural responses encoding direction from nonmotor brain regions which are typically difficult to probe in human subjects. With the ability to detect differences in neural activity across different frequency bands using cluster analysis, the use of SEEG as an incredibly useful tool for examining neural correlates is further bolstered. of frequency but distributed in multiple bands of frequencies for different set of directions.
The lingual gyrus and superior parietal lobule have been previously reported to be correlated with motor imagery through neuroimaging techniques [13,14]. The results in this paper not only coincide with previous claims but further pinpoint the frequency bands where directional information may be encoded in these regions.
The insular cortex has been associated with the motor function because of its anatomical connections while neuroimaging techniques have identified superior frontal sulcus to motor commands [3,15]. Based on the evidence shown here, the posterior insular cortex and superior frontal sulcus may be encoding direction during movement execution.
The right lingual gyrus and the right temporal pole were observed to encode different direction sets during target cue and go cue. This suggests that different neurons from these regions could encode different sets of directions as the recording sites for each region vary across subjects.
V. FUTURE WORK
In this study, nonmotor regions were identified that may encode direction during a motor task. To further understand the role these regions have on movement execution, neural correlates should be identified using metrics that characterize the motor activity during reaching movements such as path trajectory and speed. This would enable the ability to perform a network-based analysis to track the flow of movement information across multiple brain regions.
ACKNOWLEDGMENT
This work was supported by a National Science Foundation grant (EFRI-MC3: # 1137237) awarded to S.V.S., J.A.G., J.B. and J.T.G.
REFERENCES
[1] E. P. Simoncelli and D. J. Heeger, “A model of neuronal responses in visual area MT,” Vision Res., vol. 38, no. 5, pp. 743–761, 1998. [2] M. M. Churchland, J. P. Cunningham, M. T. Kaufman, J. D. Foster, P.
Nuyujukian, S. I. Ryu, and K. V Shenoy, “Neural population dynamics during reaching,” Nature, vol. 487, no. 7405, pp. 51–56, 2012.
[3] T. Hanakawa, M. A. Dimyan, and M. Hallett, “Motor planning, imagery, and execution in the distributed motor network: A time-course study with functional MRI,” Cereb. Cortex, vol. 18, no. 12, pp. 2775–2788, 2008.
[4] T. Aflalo, S. Kellis, C. Klaes, B. Lee, Y. Shi, K. Pejsa, K. Shanfield, S. Hayes-Jackson, M. Aisen, C. Heck, C. Liu, and R. Andersen, “Decoding motor imagery from the posterior parietal cortex of a tetraplecig human,” Science, vol. 348, no. 6237, pp. 906–910, 2015. [5] A. Afshar, G. Santhanam, B. M. Yu, S. I. Ryu, M. Sahani, and K. V.
Shenoy, “Single-Trial Neural Correlates of Arm Movement Preparation,” Neuron, vol. 71, no. 3, pp. 555–564, Jan. 2017. [6] M. Kerr, et al., “The Role of Associative Cortices and Hippocampus
during Movement Perturbations,” Front. Neural Circuits, vol. 11, p. 26, April 2017.
[7] N. K. Logothetis, “What we can do and what we cannot do with fMRI,” Nature, vol. 453, no. 7197, pp. 869–878, Jun. 2008.
[8] M. Cossu, F. Cardinale, L. Castana, A. Citterio, S. Francione, L. Tassi, A. L. Benabid, and G. Lo Russo, “Stereoelectroencephalography in the Presurgical Evaluation of Focal Epilepsy: A Retrospective Analysis of 215 Procedures,” Neurosurgery, vol. 57, no. 4, pp. 706– 718, Oct. 2005.
[9] J. Gonzalez-Martinez, J. Bulacio, S. Thompson, J. Gale, S. Smithason, I. Najm, and W. Bingaman, “Technique, results, and complications related to robot-assisted stereoelectroencephalography,”
Neurosurgery, vol. 78, no. 2, pp. 169–179, 2016.
[10] M. A. Johnson, S. Thompson, J. Gonzalez-Martinez, H. J. Park, J. Bulacio, I. Najm, K. Kahn, M. Kerr, S. V Sarma, and J. T. Gale, “Performing behavioral tasks in subjects with intracranial electrodes,” J. Vis. Exp., no. 92, p. e51947, 2014.
[11] E. Maris and R. Oostenveld, “Nonparametric statistical testing of EEG- and MEG-data,” J. Neurosci. Methods, vol. 164, no. 1, pp. 177– 190, 2007.
[12] H. Bokil, P. Andrews, J. E. Kulkarni, S. Mehta, and P. P. Mitra, “Chronux: A platform for analyzing neural signals,” J. Neurosci. Methods, vol. 192, no. 1, pp. 146–151, 2010.
[13] S. Shomstein, “Cognitive functions of the posterior parietal cortex: top-down and bottom-up attentional control,” Front. Integr. Neurosci., vol. 6, no. July, p. 38, 2012.
[14] P. Servos, R. Osu, A. Santi, and M. Kawato, “The neural substrates of biological motion perception: an fMRI study,” Cereb. Cortex, vol. 12, no. 7, pp. 772–782, 2002.
[15] X. Gu, P. R. Hof, K. J. Friston, and J. Fan, “Anterior insular cortex and emotional awareness,” J. Comp. Neurol., vol. 521, no. 15, pp. 3371–3388, 2013.