MUSCULOSKELETAL
Metallic artefact reduction with monoenergetic dual-energy
CT: systematic ex vivo evaluation of posterior spinal fusion
implants from various vendors and different spine levels
R. Guggenberger&S. Winklhofer&G. Osterhoff&G. A. Wanner&M. Fortunati&G. Andreisek&
H. Alkadhi&P. Stolzmann
Received: 29 January 2012 / Revised: 3 April 2012 / Accepted: 4 April 2012 / Published online: 30 May 2012 # European Society of Radiology 2012
Abstract
Objectives To evaluate optimal monoenergetic dual-energy computed tomography (DECT) settings for artefact reduc-tion of posterior spinal fusion implants of various vendors and spine levels.
Methods Posterior spinal fusion implants of five vendors for cervical, thoracic and lumbar spine were examined ex vivo with single-energy (SE) CT (120 kVp) and DECT (140/100 kVp). Extrapolated monoenergetic DECT images at 64, 69, 88, 105 keV and individually adjusted monoenergy for optimised image quality (OPTkeV) were generated. Two independent radiologists assessed quantitative and qualita-tive image parameters for each device and spine level. Results Inter-reader agreements of quantitative and qualita-tive parameters were high (ICC00.81–1.00, κ00.54–0.77). HU values of spinal fusion implants were significantly different among vendors (P<0.001), spine levels (P<0.01) and among SECT, monoenergetic DECT of 64, 69, 88, 105 keV and OPTkeV (P<0.01). Image quality was signif-icantly (P<0.001) different between datasets and improved
with higher monoenergies of DECT compared with SECT (V00.58, P<0.001). Artefacts decreased significantly (V00.51, P<0.001) at higher monoenergies. OPTkeV val-ues ranged from 123–141 keV. OPTkeV according to vendor and spine level are presented herein.
Conclusions Monoenergetic DECT provides significantly better image quality and less metallic artefacts from implants than SECT. Use of individual keV values for vendor and spine level is recommended.
Key Points
• Artefacts pose problems for CT following posterior spinal fusion implants.
• CT images are interpreted better with monoenergetic ex-trapolation using dual-energy (DE) CT.
• DECT extrapolation improves image quality and reduces metallic artefacts over SECT.
• There were considerable differences in monoenergy values among vendors and spine levels.
• Use of individualised monoenergy values is indicated for different metallic hardware devices.
Keywords Metallic artefact reduction . Monoenergetic . Dual-energy computed tomography . Posterior spinal fusion implants . Postprocessing
Introduction
Spinal fusion implants have become valuable hardware tools in orthopaedic surgery and are used for a variety of spine conditions, including traumatic and osteoporotic unstable vertebral fractures, symptomatic spondylolisthe-sis, spinal stenospondylolisthe-sis, and for the correction of spine deformities [1–5]. Complications of spinal fusion R. Guggenberger
:
S. Winklhofer:
G. Andreisek:
H. Alkadhi:
P. Stolzmann (*)
Institute of Diagnostic and Interventional Radiology, University Hospital Zurich,
Raemistrasse 100, 8091 Zurich, Switzerland e-mail: [email protected] G. Osterhoff
:
G. A. WannerDepartment of Surgery, Division of Trauma Surgery, University Hospital Zurich,
Zurich, Switzerland M. Fortunati The Spine Center, Thun, Switzerland
surgery comprise implant fracture, loosening, faulty placement and infections which may all be associated with substantial morbidity [6]. Thus, early detection of complications is desirable and poses a frequent radio-logical question in daily routine practice [7].
Computed tomography (CT) plays a key role in imaging spinal fusion implants after surgery due to its high spatial resolution, robustness and wide availability [8]. Metallic hardware, however, causes beam-hardening of the X-ray, leading to dark bands on CT images that are referred to as streak artefacts. These artefacts impede clear depiction of the implant itself, metallic–bone interfaces and tissue in close vicinity to the implants [9]. To reduce streak artefacts and to increase the diagnostic yield of CT in postoperative patients with spinal fusion implants, previous research has basically focused on CT acquisition [8,10] or reconstruction parameters [11,12].
Dual-energy (DE) CT combines both approaches with the acquisition of image data at two different energy spectra [13] together with the reconstruction of monoenergetic extrapolations [14]. This latter technique of monoenergetic extrapolation has been demonstrated to be effective for increasing the interpretability through reduction of metallic streak artefacts [15,16]. Bamberg et al. [15] suggested that high monoenergy reconstructions can be performed at an overall value of 105 keV including various metallic implants in the spine, hip, femur, humerus, radius, ulna and ankle. However, vendors and material specifications were not known to the authors of that study, and no differences were taken into account among implants and spine levels. Zhou et al. [16] recommended an overall setting at 130 keV, but no individual optimisation of the monoenergy values with re-gard to material and geometry was performed.
The aim of our ex vivo study was thus to systematically evaluate the optimal monoenergetic DECT settings for me-tallic artefact reduction of posterior spinal fusion implants according to various vendors and at different spine levels. We hypothesised that there are vendor- and region-specific optimal values for monoenergetic DECT.
Materials and methods
Posterior spinal fusion metallic implants for the cervical, thoracic and lumbar spine of five main vendors (Braun®, Melsungen, Germany; DePuy®, Warsaw, IN, USA; Medtronic®, Minneapolis, MN, USA; Stryker®, Selzach, Solothurn, Switzerland; and Synthes®, Zuchwil, Solothurn, Switzerland) (Table1), which cover more than 70% of the overall market share of spinal orthopaedic hardware were included in this ex vivo study [17]. All implants were assembled by one trauma surgeon who mounted the devices onto an acrylic plastic spine phantom.
CT data acquisition
All examinations were performed on a second genera-tion dual-source CT machine (Somatom Flash, Siemens Healthcare, Forchheim, Germany). Single-energy (SE) CT acquisitions were performed with the following parameters: slice acquisition 128 × 0.6 mm; pitch 0.8; rotation time 0.5 s, tube voltage 120 kVp, tube current-time product 270 mAs/rotation. DECT acquisi-tions were performed with the following parameters: slice acquisition 2 × 32 × 0.6 mm, pitch 0.8, rotation time 0.5 s, and a tube voltage pair of 100 and 140 kVp, using a tin filter for better energy spectrum separation [18]. Tube current-time products for DECT were 230 mAs/rotation and 180 mAs/rotation for the two tubes. The tube currents were selected to keep the radiation doses constant for both SECT and DECT at all spinal levels (CTDIvol018.2 mGy), being similar to that of our
standard protocol for spine imaging.
SECT datasets at 120kVp and DECT datasets at 100 kVp and 140 kVp were reconstructed with a slice thickness of 1.5 mm and an increment of 1 mm using a fixed field of view (FoV) of 200 mm (image matrix 512×512). A sharp convolution kernel was chosen for image reconstructions of the DE (D30) and SE acquisitions (B70).
Monoenergetic images
Post-processing was performed using commercially avail-able software (Syngo, software VE40A, monoenergetic ap-plication algorithm) on a dedicated workstation (MMWP; Siemens HealthCare, Forchheim, Germany). The algorithm of the software decomposes the image information into two image components on the basis of the 100 kVp and the 140 kVp image data. The first component includes all voxels with a linear dependence of CT numbers and spectral meas-urements. The second component includes voxels that dem-onstrate an additional photo-effect with a substantially increased difference of CT numbers between both spectral measurements. This allows for the subsequent extrapolation of monoenergetic datasets by scaling both components sep-arately to a specific monoenergy value [14].
Using this software algorithm, monoenergetic DECT reconstructions were produced at 64, 69, 88, 105 keV (Figs.1 and2). These monoenergy values were chosen to match the mean energies of the standard 120 kVp (64 keV), 140 kVp (69 keV), and tin-filtered 140 kVp (88 keV) spectrums. The monoenergy value of 105 keV was chosen based on a previ-ous study on prosthetic implants in variprevi-ous body parts [15]. In addition, two experienced radiologists in consensus (G.A. and H.A. with 5 and 7 years of experience in musculoskeletal imaging) manually selected an optimised keV value (OPT-keV) from a possible range of monoenergies from 40 to
190 keV for each vendor and spine level. The OPTkeV was chosen such that images showed fewest metallic streak arte-facts and best image quality.
CT data analysis
First, the SECT images demonstrating the most pronounced streak artefacts were identified in the axial plane by the same two readers who selected the OPTkeV value. Corresponding images of monoenergetic DECT datasets at 64, 69, 88, 105 keV and the OPTkeV were identified in the same z-position.
Then, two other independent radiologists (S.W. and R.G., with 2 and 4 years of experience in musculoskeletal imaging)— who were blinded to each other, acquisition protocol and post-processing—evaluated the information in all images quantita-tively and qualitaquantita-tively in random order.
Quantitative analysis Streak artefacts were quantified by measuring the Hounsfield value (HU) of the most pro-nounced streak on SECT and monoenergetic DECT recon-structions using an electronic calliper tool provided by the software. Thereby, a circular region of interest (ROI) was placed in the spine phantom adjacent to the implants within the hypodense streaks, carefully avoiding partial volume
artefacts. A reference CT number was measured in the spine phantom material outside of the streak artefacts. Additional ROIs were placed in the metal hardware at the position of the largest diameter of the screws and rods in order to avoid partial volume artefacts, and in an area outside the phantom and metal hardware without any artefacts for noise measure-ments. Image noise was defined as the standard deviation of CT number measurements obtained outside of the phantom. Qualitative analysis Both readers classified the image quality on a five-point Likert scale: 0, excellent image quality with full diagnostic interpretability of the implant, metallic–bone interfaces, and surrounding tissue: 1, good image quality allowing for the diagnostic interpretability with a high confi-dence; 2, acceptable image quality and diagnostic interpret-ability; 3, markedly reduced image quality and impaired diagnostic interpretability of the implants, metallic-bone inter-faces, and/or tissue components; 4, severely reduced image quality, allowing no diagnostic interpretability of implants, metallic-bone interfaces, and/or surrounding tissue.
In addition, the magnitude of artefacts was graded on a four-point Likert scale: 0, absence of streak artefacts; 1, minor streak artefacts; 2 moderate streak artefacts; 3 massive streak artefacts [15]. In two cases of disagreement, consensus read-ing was performed in order to reach a decision.
Table 1 Mean CT numbers (HU values) and standard deviations of different spinal implants according to manufacturer and spinal level
Braun® DePuy® Medtronic® Stryker® Synthes®
Cervical — 3,068 (± 1) 2,985 (± 71) 2,993 (± 58) 3,012 (± 41)
Thoracic 3,038 (± 35) 3,060 (± 16) 2,645 (± 134) 2,951 (± 80) 3,068 (± 0) Lumbar 3,038 (± 35) 3,009 (± 86) 2,756 (± 158) 2,951 (± 80) 2,912 (± 82) Numbers represent measured mean HU values of spinal implants
Numbers in parentheses represent ± standard deviation
Fig. 1 Image examples of posterior spinal fusion implants of the cervical spine
manufactured by Stryker®. Single-energy (SE) CT and monoenergetic dual-energy (DE) CT data at 64 and 69 keV showed marked streak artefacts (top row, from left to right). Decreasing streak artefacts and improving image quality are seen at increasing extrapolated monoenergies from DECT data at 88, 105 and optimised keV (i.e. 138 keV; bottom row, from left to right). Note the markedly improved depiction of the left-sided pedicular screw fixation at 105 keV and 138 keV com-pared with SECT, respectively
Statistical analysis
Continuous variables were expressed as means ± standard deviations and categorical variables as frequencies and percentages.
Inter-reader agreements of quantitative (i.e. CT number of spinal fusion implant, streak artefacts, reference tissue and image noise) and qualitative parameters (i.e. image quality and magnitude of artefact) were analysed with intra-class correlation coefficients (ICC) and weighted kap-pa statistics. According to Landis and Koch, ICCs of 0.61– 0.80 were interpreted as having a substantial level of agree-ment and 0.81–1 as having a high level of agreeagree-ment [19]. A kappa greater than 0.7 corresponded to excellent agreement and a kappa of 0.5-0.7 corresponded to good agreement.
The independent samples Kruskal–Wallis test was used to assess for differences in CT numbers of spinal fusion implant among vendors and spine levels (i.e. cervical, thoracic and lumbar spine). Comparison of CT numbers of artefacts and reference tissues between datasets were carried out using related samples Friedman's analyses. Optimised monoenergy (OPTkeV) datasets were compared with previously suggested keV settings for monoenergetic extrapolations (105 keV and 130 keV) [15,16] using the Wilcoxon signed rank test.
The Mantel–Haenszel χ2
-test was used to compare image quality and artefacts among SECT, DECT monoenergy images at 64, 69, 88, 105 keV and OPTkeV. Cramer’s V correlation coefficient was utilised for evaluating associa-tions between image quality as well as artefacts with the different kVp (SECT) and keV (DECT) settings. Co-linearity between image quality and artefact scorings was assessed using Kendall’s τ correlation analysis for ordinal variables. Corresponding to the quantitative analyses, image
quality and artefacts of OPTkeV datasets were compared using the Wilcoxon signed rank test.
Data analysis was performed using commercially avail-able software (IBM SPSS Statistics Version 19, release 19.0.0, Chicago, IL, USA). A P value of <0.05 was consid-ered statistically significant.
Results
High inter-reader agreements for CT numbers of posterior spinal fusion implants, streak artefacts, reference tissue and for image noise was found with ICCs ranging from 0.81 to 1.00 (P<0.001 each). Regarding the qualitative assessment of artefacts and image quality, inter-reader agreements were excellent (κ00.77) and good (κ00.54) (P<0.001 each), respectively.
Quantitative analysis CT numbers of posterior spinal fusion implants were significantly different among vendors (P<0.001) and spine levels (P<0.01). CT numbers of spinal fusion implants remained significantly different when analysed sepa-rately with respect to the cervical (P<0.01) , thoracic (P<0.01) and lumbar spine (P<0.001) (Table1).
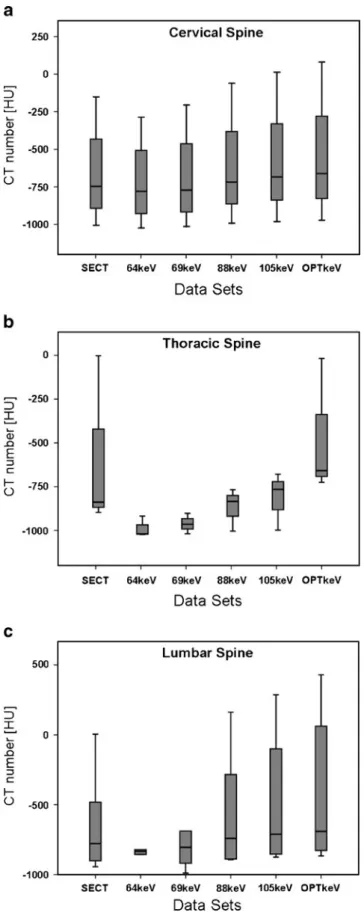
CT numbers of artefacts were significantly (P < 0.01) different among SECT, monoenergetic DECT images at 64, 69, 88, 105 keV and OPTkeV. CT numbers of artefacts remained significantly different when analysed separately with respect to cervical (P<0.05), thoracic as well as the lumbar spine (both P<0.001). Figure3plots CT numbers of artefacts at different spine levels for SECT and monoener-getic DECT images at 64, 69, 88, 105 keV and OPTkeV. Mean OPTkeV datasets equalled 134±7 keV ranging from Fig. 2 Image examples of posterior spinal fusion implants of the
lumbar spine manufactured by Braun®. SECT and monoenergetic DECT data at 64 and 69 keV showed marked streak artefacts (top row, from left to right). Decreasing streak artefacts and improving image quality are seen at increasing extrapolated monoenergies from
DECT data at 88, 105 and optimised keV (i.e. 123 keV; bottom row, from left to right). Note the improved depiction of the metallic–bone interfaces at higher energy values of 105 keV and 123 keV compared with SECT, respectively
123 to 141 keV, with differences among vendors and spine levels (see Table2). OPTkeV settings for the different spine
levels were 136±7.9 keV and 128.6±5.8 keV for the cervi-cal and thoraco-lumbar spine level, respectively.
OPTkeVs were significantly higher than previously rec-ommended monoenergy values of 105 keV (P<0.01) and 130 keV (P<0.05). CT numbers of the spine phantom and image noise did not differ between datasets (P00.80). Image noise regarding the different monoenergy values were 3± 1HU 4±2HU, 3±1HU, 3±1HU, 4±1HU and 4±1HU for SECT, 64, 69, 88, 105 keV and OPTkeV.
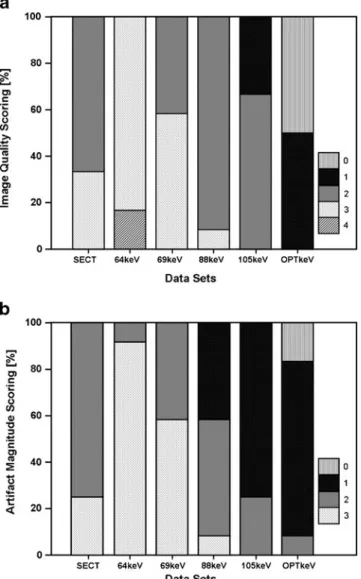
Qualitative analysis Image quality was significantly (P< 0.001) different between SECT and monoenergetic DECT images of 64, 69, 88, 105 keV and OPTkeV. The image quality improved at higher monoenergies compared with SECT images (V00.58, P<0.001). Figure4ademonstrates percentages of total ratings of image quality scores for SECT and monoenergetic DECT images with energies of 64, 69, 88, 105 keV and OPTkeV.
The magnitude of artefacts was significantly correlated (V0 0.51, P<0.001) with datasets. Figure4bdemonstrates percen-tages of artefacts scores for SECT and monoenergetic DECT images with energies of 64, 69, 88, 105 keV and OPTkeV.
More specifically, images showed more artefacts at lower monoenergies followed by SECT images. Image quality and artefact scorings were co-linear (τ 00.63, P < 0.001). Corresponding to quantitative analyses, image quality and artefacts of OPTkeV datasets were significantly different from those of monoenergetic DECT at 105 keV (P<0.01 and P<0.05, respectively). Figures1and2represent exam-ples of posterior spinal fusion implants of the cervical and lumbar spine respectively, imaged with SECT and DECT at different monoenergies.
Discussion
This study confirms previous work in the field of metallic artefact reduction through monoenergetic extrapolation of DECT data by demonstrating significant improvements in im-age quality with decreased streak artefacts compared with SECT. In addition, our study extends previous knowledge by indicating differences in optimal monoenergies among vendors and spine levels, illustrated by a wide range of OPTkeV values from 123 to 141 keV. Thus, our results suggest that individually optimised monoenergy values depend on vendor and spine level and are recommended for DECT imaging of posterior spinal fusion implants.
Fig. 3 Box plots demonstrate CT numbers of streak artefacts with respect to datasets of SECT, monoenergetic extrapolation of DECT data at 64, 69, 88, 105 keV and optimised keV (OPTkeV) for different spine levels; (a) cervical, (b) thoracic and (c) lumbar. CT numbers of artefacts were significantly (P<0.01) different among datasets demonstrating a decreasing magnitude
In general, metallic hardware represents the prototype of a high attenuating material that causes streak artefacts in CT imaging [9]. These artefacts hamper the diagnostic interpret-ability of the implants themselves, of metallic–bone inter-faces and of adjacent tissue. The magnitude of artefacts is related to tube voltage and current, image reconstruction algorithm and kernel, as well as hardware composition, geometry and body region [8].
In this study, we used a second generation dual-source CT machine with two X-ray tubes. Both tubes are simultaneously operated at different tube voltages, generating two spectra with different peak photon energies. This machine is addition-ally equipped with a tin filter that is mounted in front of the high energy X-ray tube, which improves the separation of the two energy spectra, enhancing tissue separation based on differences in z-numbers [18]. Monoenergetic extrapolation of DECT as performed in this study is based upon the decom-position of image data into two components that represent materials with either high or low z-numbers. Thereby, voxels are ascribed to either component depending on the difference in CT numbers between the two spectral measurements at 100 kVp and 140 kVp. Subsequent and separate rescaling of the
according CT numbers of voxels to a specific monoenergy value allows for extrapolation of certain monoenergetic data-sets [14]. These post-processed images resemble images that would have been acquired with X-ray photons of a specific rather than a broad spectrum of energies.
This algorithm has recently been reported in musculo-skeletal CT imaging to allow for the reduction of streak artefacts caused by metallic hardware [15,16]. In line with these studies, our results show that streak artefacts decreased while image quality improved with monoenergetic post-processing. It is important to note that the OPTkeV value does not represent the highest possible keV value that can be applied (190 keV). At higher monoenergies exceeding the OPTkeV value, the delineation of metallic–bone interfaces became difficult again.
Previously recommended monoenergies were 105 keV [15] and 130 keV [16]. These monoenergies were suggested as overall keV values for both external and internal metal orthopaedic devices not differentiating between vendor, body region, type or geometry of orthopaedic hardware. By systematically and individually analysing the various devices, we found significant differences in CT numbers Table 2 Product specifications of posterior spinal fusion implants listed by spine levels and vendors (ordered alphabetically). Note differences in optimal monoenergy values (OPTkeVs) regarding image quality and magnitude of artefacts among vendors and spine levels
Vendor Spine level Specification Screws Rods OPTkeV
Alloy Diameter (mm) Alloy Diameter (mm) Length (mm)
Braun® Thoracic/ Lumbar
Aesculap S4 System Polyaxial Screw Titanium 5.0 Titanium 6.0 123 50
DePuy® Cervical Expedium 5.5 System Monoaxial Screws Titanium 4.4 Titanium 4.0 135 20
Thoracic Expedium 5.5 System Polyaxial Screws Titanium 6.0 Titanium 6.0 130 40
Lumbar Expedium 5.5 System Polyaxial Screws Titanium 7.0 Titanium 6.5 130 50
Medtronic® Cervical CD Horizon Legacy 5.5 Titanium 5.5 Titanium 5.5 126 25
Thoracic CD Horizon Legacy 5.5 Titanium 5.5 Titanium 5.5 126 30
Lumbar CD Horizon Legacy 5.5 Titanium 5.5 Titanium 5.5 126 40
Stryker® Cervical Xia 3 polyaxial Titanium 4.5 Titanium 5.5 138 20–45
Thoracic/ Lumbar
Xia 3 polyaxial Titanium 6.5 Titanium 6.0 138
25–90
Synthes® Cervical Synapse monoaxial Titanium 3.5–4.5 Titanium 3.5 145 14–32
Thoracic USS II polyaxial Titanium 5.2–6.2 Titanium 5.0 126 35–45
Lumbar USS II polyaxial Titanium 6.2–7.0 Titanium 6.0 126 50–55
among vendors and spine levels. Moreover, image quality and artefacts were significantly related to certain monoe-nergy values. OPTkeV values ranged from 123 to 141 keV and were significantly different from the previously sug-gested values of 105 keV [15] and 130 keV [16]. These differences in OPTkeV values are most likely caused by the inclusion in these studies of orthopaedic devices for the hip, femur, humerus, radius, ulna and ankle with substantial differences in composition and geometry compared with posterior spinal implants in our study. Although mean
OPTkev in this study was significantly different from both reported energies, the difference was rather small when compared with 130 keV. Both aforementioned studies deal with in vivo conditions, while this study is an ex vivo evaluation. However, the influence of both, material com-position and geometry of implants on CT artefacts is hardware-inherent and does not depend on in vivo or ex vivo conditions. We therefore think that our deductions may be applicable to in vivo conditions alike. We found a range of OPTkeV energies between 123 and 141 keV (mean 134± 7 keV) reflecting the heterogeneity of optimal and individ-ualized monoenergetic extrapolations. In order to provide a comprehensive approach for clinical routine situations, where mostly the specific vendor and type of a spinal implant of a spinal level is not known, we calculated OPT-keVs for the different spine levels. The mean values of 136 keV and 129 keV regarding cervical and thoraco-lumbar spine level, respectively, may then serve as standard settings.
In conclusion, we suggest individual post-processing parameters for monoenergetic extrapolation of DECT data according to vendor and spine level in order to obtain best possible image quality and fewest metallic artefacts from posterior spinal fusion implants with optimal keV settings ranging between 123 and 141 keV.
Study limitations
First, spinal fusion implants were imaged ex vivo. Second, posterior spinal fusion implants of the five main vendors were examined. Additional differences in optimal monoe-nergy values of monoenergetic extrapolation may exist for other vendors and types of fusion hardware (e.g. anterior or lateral fusion devices). Third, none of the spinal fusion implants was made of stainless steel which is rarely used in the current orthopaedic hardware products on the market anyway. Although all implants are almost uniformly made of titanium alloy, significant differences exist in relation to hardware geometry, i.e. screw and rod diameters or three-dimensional composition of assembled components. This is because streak artefacts do not only depend on photon quality but also on the geometry and the z-number of the implant [20]. Fourth, we did not investigate other factors known to influence artefacts in CT imaging such as the imaging protocol and reconstruction kernels [21].
In conclusion, monoenergetic extrapolation of DECT for the imaging of posterior spinal fusion implants significantly improves image quality and reduces metallic artefacts com-pared with SECT. Systematic analysis revealed considerable differences in optimal monoenergy values ranging from 124–146 keV in order to provide the best image quality with fewest artefacts according to vendor and spine level. Use of individualised monoenergy values is thus advocated. Fig. 4 Distribution of image quality (a) and artefact magnitude (b)
with regard to the different datasets of SECT, monoenergetic extrapo-lation of DECT data at 64, 69, 88, 105 keV and optimised keV (OPTkeV). Image quality was scored on a five-point Likert scale (0, excellent image quality with full diagnostic interpretability of the implant, metallic–bone interfaces, and surrounding tissue; to 4, severe-ly reduced image quality allowing no diagnostic interpretability of implants, metallic-bone interfaces, and/or surrounding tissue). Artefact magnitude was scored on a four-point Likert scale (0, absence of streak artefacts; to 3, massive streak artefacts). Both parameters significantly improved (both P<0.001) with monoenergetic datasets and were opti-mal at OPTkeV
Acknowledgements The authors wish to thank the product specialists T. Frommenwiler (Braun®), M. Schroeder (DePuy®), A. Gertsch (Medtronic®) and G. Guaresi (Stryker®) for their support, and all participating vendors (including Synthes®) for providing us with spinal fusion implants and product specifications.
References
1. Ponnusamy KE, Iyer S, Gupta G, Khanna AJ (2011) Instrumenta-tion of the osteoporotic spine: biomechanical and clinical consid-erations. Spine J 11:54–63
2. Cheng JS, Lee MJ, Massicotte E et al (2011) Clinical guidelines and payer policies on fusion for the treatment of chronic low back pain. Spine (Phila Pa 1976) 36:S144–S163
3. Willems P, de Bie R, Oner C, Castelein R, de Kleuver M (2011) Clinical decision making in spinal fusion for chronic low back pain. Results of a nationwide survey among spine surgeons. BMJ Open 1:e000391
4. Wood KB, Fritzell P, Dettori JR, Hashimoto R, Lund T, Shaffrey C (2011) Effectiveness of spinal fusion versus structured rehabilita-tion in chronic low back pain patients with and without isthmic spondylolisthesis: a systematic review. Spine (Phila Pa 1976) 36: S110–S119
5. Sucato DJ (2010) Management of severe spinal deformity: scolio-sis and kyphoscolio-sis. Spine (Phila Pa 1976) 35:2186–2192
6. Young PM, Berquist TH, Bancroft LW, Peterson JJ (2007) Com-plications of spinal instrumentation. Radiographics 27:775–789 7. Murtagh RD, Quencer RM, Castellvi AE, Yue JJ (2011) New
techniques in lumbar spinal instrumentation: what the radiologist needs to know. Radiology 260:317–330
8. Douglas-Akinwande AC, Buckwalter KA, Rydberg J, Rankin JL, Choplin RH (2006) Multichannel CT: evaluating the spine in postoperative patients with orthopedic hardware. Radiographics 26:S97–S110
9. Barrett JF, Keat N (2004) Artifacts in CT: recognition and avoid-ance. Radiographics 24:1679–1691
10. Buckwalter KA, Parr JA, Choplin RH, Capello WN (2006) Mul-tichannel CT imaging of orthopedic hardware and implants. Semin Musculoskelet Radiol 10:86–97
11. Kachelriess M, Watzke O, Kalender WA (2001) Generalized multi-dimensional adaptive filtering for conventional and spiral single-slice, multi-single-slice, and cone-beam CT. Med Phys 28:475–490 12. Veldkamp WJ, Joemai RM, van der Molen AJ, Geleijns J (2010)
Development and validation of segmentation and interpolation techniques in sinograms for metal artifact suppression in CT. Med Phys 37:620–628
13. Flohr TG, McCollough CH, Bruder H et al (2006) First perfor-mance evaluation of a dual-source CT (DSCT) system. Eur Radiol 16:256–268
14. Yu H, Zeng K, Bharkhada DK et al (2007) A segmentation-based method for metal artifact reduction. Acad Radiol 14:495–504 15. Bamberg F, Dierks A, Nikolaou K, Reiser MF, Becker CR,
Johnson TR (2011) Metal artifact reduction by dual energy com-puted tomography using monoenergetic extrapolation. Eur Radiol 21:1424–1429
16. Zhou C, Zhao YE, Luo S et al (2011) Monoenergetic imaging of dual-energy CT reduces artifacts from implanted metal orthopedic devices in patients with factures. Acad Radiol 18:1252–1257 17. Menze M (2009) Spine revenues up 11.1%. New trend? In:
Pearl-diver technologies. S. Ellison. Available via http://www.pearldi-verinc.com/pdi/articles.jsp?q0/var/www/html/pearldiver/market/ spine/html/Spine-Revenues-Up-11-percent-New-Trend-09-16-09.html&t0Spine+Revenues+Up+11+percent+−+New+Trend? &c0spine
18. Stolzmann P, Leschka S, Scheffel H et al (2010) Characterization of urinary stones with dual-energy CT: improved differentiation using a tin filter. Invest Radiol 45:1–6
19. Landis JR, Koch GG (1977) The measurement of observer agree-ment for categorical data. Biometrics 33:159–174
20. Haramati N, Staron RB, Mazel-Sperling K et al (1994) CT scans through metal scanning technique versus hardware composition. Comput Med Imaging Graph 18:429–434
21. Lee MJ, Kim S, Lee SA et al (2007) Overcoming artifacts from metallic orthopedic implants at high-field-strength MR imaging and multi-detector CT. Radiographics 27:791–803