HAL Id: hal-02537118
https://hal.sorbonne-universite.fr/hal-02537118
Submitted on 8 Apr 2020
HAL is a multi-disciplinary open access
archive for the deposit and dissemination of
sci-entific research documents, whether they are
pub-lished or not. The documents may come from
teaching and research institutions in France or
abroad, or from public or private research centers.
L’archive ouverte pluridisciplinaire HAL, est
destinée au dépôt et à la diffusion de documents
scientifiques de niveau recherche, publiés ou non,
émanant des établissements d’enseignement et de
recherche français ou étrangers, des laboratoires
publics ou privés.
Lack of association between modifiable exposures and
glioma risk: a Mendelian randomization analysis
Charlie Saunders, Alex Cornish, Ben Kinnersley, Philip Law, Elizabeth Claus,
Dora Il’Yasova, Joellen Schildkraut, Jill Barnholtz-Sloan, Sara Olson, Jonine
Bernstein, et al.
To cite this version:
Charlie Saunders, Alex Cornish, Ben Kinnersley, Philip Law, Elizabeth Claus, et al.. Lack of
asso-ciation between modifiable exposures and glioma risk: a Mendelian randomization analysis.
Neuro-Oncology, Oxford University Press (OUP), 2020, 22 (2), pp.207 - 215. �10.1093/neuonc/noz209�.
�hal-02537118�
Neuro-Oncology
22(2), 207–215, 2020 | doi:10.1093/neuonc/noz209 | Advance Access date 30 October 2019
© The Author(s) 2019. Published by Oxford University Press on behalf of the Society for Neuro-Oncology.
Lack of association between modifiable exposures and
glioma risk: a Mendelian randomization analysis
Charlie N. Saunders, Alex J. Cornish, Ben Kinnersley, Philip J. Law, Elizabeth B. Claus,
Dora Il’yasova, Joellen Schildkraut, Jill S. Barnholtz-Sloan, Sara H. Olson, Jonine L. Bernstein,
Rose K. Lai, Stephen Chanock, Preetha Rajaraman, Christoffer Johansen, Robert B. Jenkins,
Beatrice S. Melin, Margaret R. Wrensch, Marc Sanson, Melissa L. Bondy, and Richard S. Houlston
Division of Genetics and Epidemiology, The Institute of Cancer Research, London, UK (C.N.S., A.J.C., B.K., P.J.L.); Department of Population and Quantitative Health Sciences and the Cleveland Center for Health Outcomes Research, Case Western Reserve University School of Medicine, Cleveland, Ohio, USA (J.S.B-S.); Section of Epidemiology and Population Sciences, Department of Medicine, Dan L. Duncan Comprehensive Cancer Center, Baylor College of Medicine, Houston, Texas, USA (M.L.B.); School of Public Health, Yale University, New Haven, Connecticut, USA (E.B.C.); Department of Neurosurgery, Brigham and Women’s Hospital, Boston, Massachusetts, USA (E.B.C.); Department of Epidemiology and Biostatistics, School of Public Health, Georgia State University, Atlanta, Georgia, USA (D.I.); Duke Cancer Institute, Duke University Medical Center, Durham, North Carolina, USA (D.I., J.S.); Cancer Control and Prevention Program, Department of Community and Family Medicine, Duke University Medical Center, Durham, North Carolina, USA (D.I., J.S.);Department of Epidemiology and Biostatistics, Memorial Sloan Kettering Cancer Center, New York, New York, USA (S.H.O., J.L.B.); Departments of Neurology and Preventive Medicine, Keck School of Medicine, University of Southern California, Los Angeles, California, USA (R.K.L.); Division of Cancer Epidemiology and Genetics, National Cancer Institute, Bethesda, Maryland, USA (S.C., P.R.); Danish Cancer Society Research Center, Survivorship, Danish Cancer Society, Copenhagen, Denmark (C.J.); Oncology Clinic, Finsen Centre, Rigshospitalet, University of Copenhagen, Copenhagen, Denmark (C.J.); Department of Laboratory Medicine and Pathology, Mayo Clinic Comprehensive Cancer Center, Mayo Clinic, Rochester, Minnesota, USA (R.B.J.); Department of Radiation Sciences, Umeå University, Umeå, Sweden (B.S.M.); Department of Neurological Surgery, School of Medicine, University of California San Francisco (UCSF), San Francisco, California, USA (M.R.W.); Institute of Human Genetics, University of California San Francisco, San Francisco, California, USA (M.R.W.); Sorbonne University, National Center for Scientific Research, National Institute of Health and Medical Research (INSERM), Brain and Spinal Cord Institute, Paris, France (M.S.); Department of Neurology Mazarin 2, Pitié-Salpêtrière Hospital Group, Paris, France (M.S.); Division of Molecular Pathology, The Institute of Cancer Research, London, UK (R.S.H.)
Corresponding Author: Charlie N. Saunders, Division of Genetics and Epidemiology, The Institute of Cancer Research, London, UK
(Charlie.Saunders@icr.ac.uk).
Abstract
Background. The etiological basis of glioma is poorly understood. We have used genetic markers in a Mendelian
randomization (MR) framework to examine if lifestyle, cardiometabolic, and inflammatory factors influence the risk of glioma. This methodology reduces bias from confounding and is not affected by reverse causation.
Methods. We identified genetic instruments for 37 potentially modifiable risk factors and evaluated their
asso-ciation with glioma risk using data from a genome-wide assoasso-ciation study of 12 488 glioma patients and 18 169 controls. We used the estimated odds ratio of glioma associated with each of the genetically defined traits to infer evidence for a causal relationship with the following exposures: Lifestyle and dietary factors—height, plasma insulin-like growth factor 1, blood carnitine, blood methionine, blood selenium, blood zinc, circulating adiponectin, circulating carotenoids, iron status, serum calcium, vitamins (A1, B12, B6, E, and 25-hydroxyvitamin D), fatty acid levels (monounsaturated, omega-3, and omega-6) and circulating fetuin-A; Cardiometabolic factors—birth weight, high density lipoprotein cholesterol, low density lipoprotein cholesterol, total cholesterol, total triglycerides, basal metabolic rate, body fat percentage, body mass index, fasting glucose, fasting proinsulin, glycated hemoglobin levels, diastolic and systolic blood pressure, waist circumference, waist-to-hip ratio; and Inflammatory factors— C-reactive protein, plasma interleukin-6 receptor subunit alpha and serum immunoglobulin E.
This is an Open Access article distributed under the terms of the Creative Commons Attribution License (http://creativecommons. org/licenses/by/4.0/), which permits unrestricted reuse, distribution, and reproduction in any medium, provided the original work is properly cited.
208
Saunders et al.
Lack of association between modifiable exposures and glioma risk
Results. After correction for the testing of multiple potential risk factors and excluding associations driven
by one single nucleotide polymorphism, no significant association with glioma risk was observed (ie,
PCorrected > 0.05).
Conclusions. This study did not provide evidence supporting any of the 37 factors examined as having a
significant influence on glioma risk.
Gliomas account for around 80% of malignant primary brain tumors in adults.1 Gliomas are heterogeneous, and different
tumor subtypes can be broadly classified into glioblastoma (GBM) and lower-grade glioma (non-GBM). Gliomas are typi-cally associated with a poor prognosis, irrespective of clinical care, with the most common glioma subtype (GBM) being as-sociated with a median overall survival of only 12 months.2
While glioma subtypes have distinct molecular profiles presumably resulting from different etiological pathways, no environmental exposures have consistently been linked to risk, except for ionizing radiation, which accounts for only a very small number of cases.2,3 However, the near
threefold higher incidence in northern Europe (6.59 cases per 100 000) than in prosperous Southeast Asia (2.55 cases per 100 000) raises the possibility that lifestyle factors in-fluence glioma risk.2,4 Over the last 30 years, observational
epidemiological studies have sought to establish asso-ciations between a variety of lifestyle factors and risk of developing glioma. Most studies have focused on factors previously shown to influence risk of other cancers, such as diet. Results from these observational epidemiolog-ical studies have so far either been inconsistent, null, or not independently validated; for example, the conflicting evidence for possible associations with dietary factors and obesity.5–11 In contrast to other cancer types,
pub-lished studies have shown an inverse relationship with both diabetes and hyperglycemia for glioma.12 Studies of
a possible relationship between metabolic syndrome traits (triglyceride [TG] and cholesterol levels, body fat and blood pressure) have produced similarly mixed results.8,13,14
Associations seen in conventional observational studies may not be causal, instead arising as a consequence of meth-odological biases inherent in the study design. Biases in-clude selection bias in controls, recall bias, reverse causation, or confounding from unmeasured effects.15 Furthermore,
the high frequency of exposure ascertainment by proxy in studies of glioma represents an additional source of bias.16
Mendelian randomization (MR) is an analytical approach, whereby germline genetic variants are used as proxies, or instrumental variables (IVs), for putative risk factors.17
Since genetic variants are randomly assigned at concep-tion, they are not influenced by reverse causation. In the absence of pleiotropy (ie, genetic variants being associ-ated with the disease through alternative pathways) and population stratification, they can provide unconfounded estimates of disease risk (Fig. 1).17 MR can therefore
miti-gate many of the limitations of conventional observational studies and is increasingly being used to estimate the im-pact of an intervention on disease risk.
We have recently used MR to examine possible links be-tween glioma with 25-hydroxyvitamin D levels, a common proxy for vitamin D levels, obesity, and atopy-related traits.18–20 Here we have extended our analysis to examine
the relationship of 37 potentially modifiable factors with glioma risk, using a two-sample MR framework. Genetic vari-ants associated with these 37 factors were identified from the largest genome-wide association study (GWAS) conducted to date or meta-analysis of each trait. We then evaluated the association of these variants with glioma in a large GWAS comprising 12 488 glioma cases and 18 169 control subjects.21
Importance of the Study
In this study we attempt to elucidate modifiable risk
fac-tors of glioma, the etiological basis of which is poorly
un-derstood. We used genetic markers in an MR framework
to examine whether the risk of glioma is influenced by one
of 37 lifestyle, cardiometabolic, and inflammatory factors.
The MR methodology reduces bias from confounding and
is not affected by reverse causation, an improvement over
the traditional observational studies that have previously
been conducted. Additionally, we leverage the largest
glioma genome-wide association study dataset published
to date, giving our analysis more power compared with
other studies of its type. This improved, unbiased, and
well-powered assessment of potential glioma risk factors
provides invaluable information to the field.
Key Points
1. Environmental modifiable risk factors effecting glioma risk are poorly understood. 2. Our Mendelian randomization study investigated 37 potential modifiable risk factors. 3. None of the 37 factors were observed to significantly influence glioma risk.
Methods
Two-sample MR was conducted using data from a GWAS of glioma published by Melin et al.21 Ethical approval was
not sought because these data came from summary statis-tics and no individual-level data were used.
Potentially Modifiable Risk Factors
The aim of our study was to provide an insight into pos-sible associations between modifiable factors which might influence the risk of glioma development. These factors were chosen on the basis of having been the subject of a previous investigation or having a role in development of a common cancer (Supplementary Table 1). Specifically, we considered 19 lifestyle and dietary factors—height, plasma insulin-like growth factor 1 (IGF-1), blood carnitine, blood methionine, blood selenium, blood zinc, circulating adiponectin, circulating carotenoids, iron status, serum calcium, vitamins (A1, B12, B6, E, and 25-hydroxyvitamin D), fatty acid levels (mono-unsaturated, omega-3, and omega-6) and circulating fetuin-A. Additionally, 15 cardiometabolic factors were considered—birth weight, high density lipoprotein (HDL) cholesterol, low density lip-oprotein (LDL) cholesterol, total cholesterol, total TG, basal metabolic rate, body fat percentage, body mass index, di-astolic blood pressure, fasting glucose, fasting proinsulin, glycated hemoglobin (HbA1C) levels, systolic blood pres-sure, waist circumference, waist-to-hip ratio. Lastly, 3 in-flammatory factors—C-reactive protein (CRP), interleukin (IL)-6, and serum immunoglobulin (Ig)E—were used as general markers of systemic inflammation and were in-cluded in the hypothesis driven analysis (Supplementary Table 2).
Genetic Instruments for Putative Risk Factors
The genetic instruments (ie, single nucleotide polymorphisms [SNPs]) to be used as IVs were identified from recent meta-analyses or the largest GWAS published
to date (Supplementary Table 3). For each SNP, the chro-mosome position was recovered, the effect estimate ex-pressed in standard deviations (SDs) of the trait per allele along with the corresponding standard errors (SEs). We considered only continuous traits, as analysis of binary traits (such as disease status) with binary outcomes in 2-sample MR frameworks can result in inaccurate causal estimates.18,19 The analysis was restricted to SNPs
associ-ated at genome-wide significance (ie, P ≤ 5 × 10⁻⁸) in
indi-viduals of European ancestry, to satisfy the MR assumption that genetic variants are associated with the modifiable risk factor.22 To avoid collinearity between SNPs for each
trait, correlated SNPs were excluded using the MR-Base database (linkage disequilibrium threshold, r2 ≥ 0.01)
within each trait, with SNPs with the strongest effect size retained.23 These SNPs and their associated data are
de-tailed in Supplementary Table 3. The process to generate SNPs used as IVs is summarized in Supplementary Fig. 1.
Glioma Genotyping Data
The association of each genetic instrument with glioma risk was examined using summary effect estimates and corresponding SEs from a recent meta-analysis of 8 glioma GWAS.21 After imputation, this meta-analysis related >10
million genetic variants to glioma in 12 488 cases (6183 GBM and 5820 non-GBM) and 18 169 controls of European descent (Supplementary Table 4).
Statistical Analysis
The MR methodology assumes that genetic variants used as instruments for a risk factor are associated with only the risk factor and not with any confounders or another causal pathway (Fig. 1). Furthermore, to estimate the size of the causal effect with precision, associations must be linear and not affected by statistical interactions.24 The
causal effects for each SNP were first estimated using the Wald ratio (Supplementary Table 5). Where mul-tiple SNPs were available as instruments for the trait, causal effects were estimated using an inverse variance
Assumption 2
Assumption 1 risk factor (X)Modifiable
Glioma (Y) Assumption 3 SNPa SNPb SNPc Confounders
Fig. 1 Principles of Mendelian randomization (MR) and the assumptions required to obtain an unbiased causal effect estimate. The three as-sumptions are: (1) genetic variants used as instrumental variables are only associated with the modifiable risk factor (X); (2) genetic variants only influence the risk of developing glioma (Y) through the modifiable risk factor (X); (3) genetic variants are not associated with any measured or unmeasured confounders.
210
Saunders et al.
Lack of association between modifiable exposures and glioma risk
weighted fixed-effects (IVW-FE), maximum likelihood estimation (MLE), weighted median estimator (WME), and weighted mode-based estimator (WMBE) method-ologies.17,25,26 We compared the calculated odds ratios
and P-values from the 4 methods to assess the stability and validity of associations. Leave-one-out analysis was used to investigate whether a particular association was driven solely by a single SNP (Supplementary Table 6).27
The MR-Egger regression approach was used to eval-uate the extent to which directional pleiotropy may af-fect the causal estimates.28 Results were reported as odds
ratios (ORSD) with 95% confidence intervals (CIs) per ge-netically predicted SD unit increase in each putative risk factor. To address multiple testing, a Bonferroni-corrected P-value of 1.35×10⁻³ (ie, 0.05/37 putative risk factors) was
considered significant, with a 1.35×10⁻³ < P-value < 0.05
being considered suggestive of an association. The power of MR to demonstrate a causal effect depends in part on the proportion of variance in the risk factor ex-plained by the genetic variants used as instruments, and we therefore estimated study power for each risk factor a priori (Supplementary Table 2). Statistical analyses were undertaken using RStudio version 3.4.029 and MR-Base.23
Figures were produced using Inkscape version 0.92.30
Results
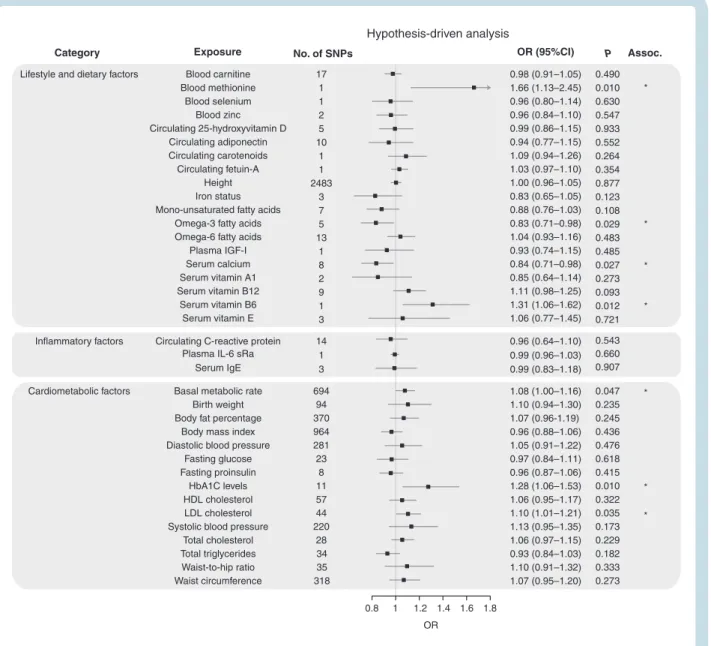
Figures 2–4 show the association between each of the 37 traits and risk of all glioma, GBM and non-GBM tumors, re-spectively, using the Wald ratio and IVW-FE methodologies.
Dietary Factors and Lifestyle
There was suggestive evidence of an association between genetically predicted higher basal metabolic rate with in-creased risk of all glioma (ORSD = 1.08, 95% CI: 1.00–1.16, P = 0.047) and GBM (ORSD = 1.13, 95% CI: 1.03–1.24,
P = 0.009). However, leave-one-out analysis showed the association was driven by the SNP rs78378222 at 17p13.3 (Supplementary Table 6), a known glioma risk SNP.31 With
exclusion of rs78378222, no association was observed in glioma (ORSD = 1.04, 95% CI: 0.96–1.12, P = 0.319) and GBM (ORSD = 1.09, 95% CI: 0.99–1.19, P = 0.072). Likewise, the apparent association between genetically predicted raised serum calcium levels and a lower risk of glioma (ORSD = 0.84, 95% CI: 0.71–0.98, P = 0.027) and GBM (ORSD = 0.76, 95% CI: 0.62–0.92, P = 0.005) was reliant on SNP rs780094 (Supplementary Table 6). With exclu-sion of rs780094 the association was non-significant with glioma (ORSD = 0.92, 95% CI: 0.69–1.23, P = 0.574) and GBM (ORSD = 0.86, 95% CI: 0.60–1.22, P = 0.391). There was sug-gestive evidence for genetically predicted higher serum vitamin B6 levels being associated with lower risk of all glioma (ORSD = 1.31, 95% CI: 1.06–1.62, P = 0.012) and non-GBM (ORSD = 1.40, 95% CI: 1.06–1.85, P = 0.017); how-ever, the observation was again reliant on a single SNP (rs4654748). Similarly, the suggestive association between genetically predicted higher blood methionine levels and risk of glioma (ORSD = 1.66, 95% CI: 1.13–2.45, P = 0.010) and
GBM (ORSD = 1.77, 95% CI: 1.10–2.85, P = 0.019) was reliant on a single SNP (rs320485).
The fatty acid (FA) metabolic pathway is complex, with SNPs influencing the metabolism of one FA often being as-sociated with circulating concentrations of multiple FAs. To limit bias introduced by vertical and horizontal pleiot-ropy, we restricted our analysis to classes of FAs, such as omega-3 and omega-6 polyunsaturated FAs (PUFAs) and monounsaturated FAs (MUFAs), rather than individual fatty acids. In this restricted analysis, there was a sug-gestive association between genetically predicted levels of MUFA with reduced risk of GBM (ORSD = 0.76, 95% CI: 0.63–0.91, P = 0.004) and between omega-3 PUFA fatty acid levels with reduced risk of glioma (ORSD = 0.83, 95% CI: 0.71–0.98, P = 0.029) and GBM (ORSD = 0.79, 95% CI: 0.65–
0.97, P = 0.022). Leave-one-out analysis, however, revealed that all associations were driven by the same glucokinase receptor protein (GCKR) SNP (rs1260326, Supplementary Table 6). With the exclusion of this SNP, no association re-mained significant.
Circulating adiponectin level was the only exposure with an observed association with non-GBM risk only (ORSD = 0.74, 95% CI: 0.57–0.96, P = 0.022). However, once again leave-one-out analysis showed this association was reliant on rs6810075; upon its removal the association did not remain significant (ORSD = 0.75, 95% CI: 0.55–1.04, P = 0.086).
Genetically predicted circulating levels of carnitine/se-lenium/zinc/25-hydroxyvitamin-D/carotenoids/fetuin-A/ plasma IGF-1/vitamins (A1, B12, and E), height, iron status, and circulating levels of monounsaturated/omega-3/ omega-6 fatty acids showed no evidence for association with risk of all glioma, GBM or non-GBM (Fig. 2–4).
Cardiometabolic and Inflammatory Factors
Genetically predicted higher levels of LDL cholesterol showed suggestive evidence of an association with in-creased risk of glioma (ORSD = 1.10, 95% CI: 1.01–1.21, P = 0.035) and non-GBM (ORSD = 1.15, 95% CI: 1.02–1.30, P = 0.021). This finding contrasts with our earlier work which found no evidence for an association; however, the previous analysis was based on fewer SNPs (26 vs 44).18
Genetically predicted plasma total TG also showed a sug-gestive association with risk of GBM (ORSD = 0.87, 95% CI: 0.76–0.99, P = 0.030). Leave-one-out analysis showed that both LDL and TG associations were unstable. The LDL as-sociation being reliant on rs2131925 (Supplementary Table 6), with exclusion of rs2131925 removing any associa-tion–glioma (ORSD = 1.09, 95% CI: 0.99–1.19, P = 0.085) and non-GBM risk (ORSD = 1.12, 95% CI: 0.98–1.27, P = 0.090). The TG association was reliant on the GCKR SNP (rs1260326,
Supplementary Table 6), with exclusion of rs1260326 also leading to the loss of association–GBM ORSD = 0.93, 95% CI: 0.81–1.08, P = 0.360).
Genetically predicted higher HbA1C levels were also associated with increased glioma risk (ORSD = 1.28, 95% CI: 1.06–1.53, P = 0.010) and non-GBM (ORSD = 1.30, 95% CI: 1.02–1.65, P = 0.036). However, this association was also reliant on a single SNP (Supplementary Table 6), with the exclusion of rs16926246 resulting in loss of
any association–glioma (ORSD = 1.16, 95% CI: 0.93–1.45, P = 0.177) and non-GBM risk (ORSD = 1.15, 95% CI: 0.86–
1.54, P = 0.346).
Genetically predicted total cholesterol was associated with non-GBM risk only (ORSD = 1.14, 95% CI: 1.01–1.28, P = 0.032). However, this association was also reliant on a single SNP (Supplementary Table 6b), with the exclusion of rs7412 resulting in loss of any association (ORSD = 1.11, 95% CI: 0.97–1.27, P = 0.116).
Waist-to-hip ratio was associated with non-GBM risk only (ORSD = 1.33, 95% CI: 1.04–1.70, P = 0.022). Leave-one-out analysis of this exposure revealed that removal of any one of 3 SNPs (rs10195252, rs1936805, or rs2820443) reduced the P-value to just above the 0.05 threshold for a suggestion of association (P = 0.059, 0.055, and 0.053,
respectively). This was less than the drastic reduction seen with the other exposures.
Genetically predicted plasma levels of IL-6 receptor sub-unit alpha (sRa)/CRP/HDL and serum IgE, birth weight, body fat percentage, body mass index, diastolic and sys-tolic blood pressure, fasting glucose and proinsulin levels, and waist circumference showed no evidence for associ-ation with risk of all glioma, GBM or non-GBM (Fig. 2–4).
Discussion
Despite much research, the etiological basis of glioma has remained elusive. To gain insight into possible causal
Blood carnitine Lifestyle and dietary factors
Category Exposure No. of SNPs OR (95%CI)
0.98 (0.91–1.05) 0.490 0.010 0.630 0.547 0.933 0.552 0.264 0.354 0.877 0.123 0.108 0.029 0.483 0.485 0.027 0.273 0.093 0.012 0.721 0.543 0.660 0.907 0.047 0.235 0.245 0.436 0.476 0.618 0.415 0.010 0.322 0.035 0.173 0.229 0.182 0.333 0.273 1.66 (1.13–2.45) 0.96 (0.80–1.14) 0.96 (0.84–1.10) 0.99 (0.86–1.15) 0.94 (0.77–1.15) 1.09 (0.94–1.26) 1.03 (0.97–1.10) 1.00 (0.96–1.05) 0.83 (0.65–1.05) 0.88 (0.76–1.03) 0.83 (0.71–0.98) 1.04 (0.93–1.16) 0.93 (0.74–1.15) 0.84 (0.71–0.98) 0.85 (0.64–1.14) 1.11 (0.98–1.25) 1.31 (1.06–1.62) 1.06 (0.77–1.45) 0.96 (0.64–1.10) 0.99 (0.96–1.03) 0.99 (0.83–1.18) 1.08 (1.00–1.16) 1.10 (0.94–1.30) 1.07 (0.96-1.19) 0.96 (0.88–1.06) 1.05 (0.91–1.22) 0.97 (0.84–1.11) 0.96 (0.87–1.06) 1.28 (1.06–1.53) 1.06 (0.95–1.17) 1.10 (1.01–1.21) 1.13 (0.95–1.35) 1.06 (0.97–1.15) 0.93 (0.84–1.03) 1.10 (0.91–1.32) 1.07 (0.95–1.20) P Assoc. * * * * * * * 17 1 1 2 5 10 1 1 2483 3 7 5 13 1 8 2 9 1 3 14 1 3 694 94 370 964 281 23 8 11 57 44 220 28 34 35 318 0.8 1 1.2 OR 1.4 1.6 1.8 Hypothesis-driven analysis Blood methionine Blood selenium Blood zinc Circulating 25-hydroxyvitamin D Circulating adiponectin Circulating carotenoids Circulating fetuin-A Height Iron status Mono-unsaturated fatty acids
Omega-3 fatty acids Omega-6 fatty acids
Plasma IGF-I Serum calcium Serum vitamin A1 Serum vitamin B12 Serum vitamin B6 Serum vitamin E Circulating C-reactive protein
Plasma IL-6 sRa Serum IgE Basal metabolic rate
Birth weight Body fat percentage
Body mass index Diastolic blood pressure
Fasting glucose Fasting proinsulin
HbA1C levels HDL cholesterol LDL cholesterol Systolic blood pressure
Total cholesterol Total triglycerides Waist-to-hip ratio Waist circumference Inflammatory factors Cardiometabolic factors
Fig. 2 Odds ratios for associations (Assoc.) between genetically predicted risk factors and glioma. Results reported as odds ratios (ORSD) and 95% confidence intervals (CIs) per genetically predicted standard deviation (SD) unit increase in the risk factor. A fixed-effects inverse variance weighted (IVW-FE) method was used to summarize Wald ratio estimates from individual SNPs. *P-values suggestive of an association (range: 0.05–1.35 × 10⁻³); **significant P-values (<1.35 × 10⁻³).
212
Saunders et al.
Lack of association between modifiable exposures and glioma risk
relationships, we have used an MR-based framework to investigate a range of potentially modifiable risk factors. Many of the factors and traits have either been the subject of previous conventional observational epidemiological studies with varying degrees of support or are established risk factors for multiple common cancers consistent with them having a generic effect on tumor development.
A major advantage of the MR approach to establish causal links is the avoidance of biases that can influence conventional observational epidemiological studies. A challenge in its implementation is exclusion of pleiot-ropy, where one SNP is seen to effect two seemingly un-related phenotypic traits, or an alternative direct causal pathway being the cause of an association.32 The IVW
meth-odology only produces estimates of causal relationship
when all genetic variants are valid instruments. To address such a shortcoming, and assess the robustness of esti-mates, as well as implementing IVW we also made use of WME and WMBE methods, which can provide unbiased causal effect estimates even when many genetic vari-ants are invalid instruments.25,26 While not a case of direct
pleiotropy, our analysis did show one example of a pleio-tropic locus influencing both GCKR SNP (rs1260326) and serum calcium (rs780094). However, both of these expos-ures were discounted after leave-one-out analysis showed them both to be reliant on these single SNPs, before the need to investigate the association using WME or WMBE methodologies.
None of the 37 potential risk factors we evaluated showed a significant association with glioma risk after adjusting for
Lifestyle and dietary factors
Inflammatory factors Cardiometabolic factors
Category Exposure No. of SNPs OR (95%CI)
Hypothesis-driven analysis P Assoc. Blood carnitine Blood methionine Blood selenium Blood zinc Circulating 25-hydroxyvitamin D Circulating adiponectin Circulating carotenoids Circulating fetuin-A Height Iron status Mono-unsaturated fatty acids
Omega-3 fatty acids Omega-6 fatty acids
Plasma IGF-I Serum calcium Serum vitamin A1 Serum vitamin B12 Serum vitamin B6 Serum vitamin E Circulating C-reactive protein
Plasma IL-6 sRa Serum IgE Basal metabolic rate
Birth weight Body fat percentage
Body mass index Diastolic blood pressure
Fasting glucose Fasting proinsulin
HbA1C levels HDL cholesterol LDL cholesterol Systolic blood pressure
Total cholesterol Total triglycerides Waist-to-hip ratio Waist circumference 17 1 1 2 5 10 1 1 2482 3 7 5 13 1 8 2 9 1 3 14 1 3 690 94 368 964 281 23 8 11 57 44 220 28 34 318 35 1.01 (0.93–1.10) 0.849 * * * * * * 0.019 0.697 0.468 0.170 0.110 0.750 0.678 0.463 0.208 0.004 0.022 0.655 0.891 0.005 0.272 0.137 0.087 0.704 0.743 0.846 0.974 0.009 0.481 0.421 0.764 0.931 0.939 0.113 0.093 0.141 0.663 0.138 0.750 0.030 0.579 0.500 1.77 (1.10–2.85) 0.96 (0.77–1.19) 0.94 (0.80–1.11) 0.88 (0.71–1.05) 1.22 (0.96–1.55) 1.03 (0.86–1.23) 1.02 (0.94–1.10) 1.02 (0.97–1.07) 0.83 (0.61–1.11) 0.76 (0.63–0.91) 0.79 (0.65–0.97) 0.97 (0.85–1.11) 0.98 (0.75–1.28) 0.76 (0.62–0.92) 0.82 (0.57–1.17) 1.12 (0.96–1.30) 1.26 (0.97–1.63) 1.08 (0.73–1.58) 1.03 (0.87–1.22) 1.00 (0.96–1.04) 1.00 (0.81–1.24) 1.13 (1.03–1.24) 1.07 (0.88–1.31) 1.06 (0.92–1.21) 0.98 (0.88–1.10) 0.99 (0.83–1.19) 0.99 (0.84–1.17) 0.90 (0.80–1.02) 1.21 (0.97–1.52) 1.10 (0.97–1.26) 1.03 (0.92–1.15) 1.18 (0.95–1.47) 0.98 (0.88–1.09) 0.87 (0.76–0.99) 1.04 (0.90–1.21) 0.92 (0.74–1.16) 0.8 0.6 1 1.2 OR 1.4 1.6 1.8
Fig. 3. Odds ratios for associations (Assoc.) between genetically predicted risk factors and GBM. Results reported as odds ratios (ORSD) and 95% CIs per genetically predicted SD unit increase in the risk factor. A fixed-effects inverse variance weighted (IVW-FE) method was used to summarize Wald ratio estimates from individual SNPs. *P-values suggestive of an association (range: 0.05–1.35 × 10⁻³); **significant P-values
(<1.35 × 10⁻³).
multiple testing (ie, P < 1.35 × 10⁻³) although 9 showed
sug-gestive evidence (ie, P < 0.05). ORSD and P-values estimated using IVW and MLE methods showed strong agreement with respect to the 9 suggestively associated factors. Only two ex-posures showed consistent effect estimates across all 4 ana-lytic methodologies (including WME and WMBE), highlighting the instability of any suggested associations identified by one method alone (Supplementary Table 5). These consistent ex-posures were HbA1C levels (GBM and non-GBM only) and serum calcium (GBM only); however, leave-one-out analysis showed that these associations were reliant on single SNPs, thereby calling into question the validity of associations.
We cannot exclude the possibility that some of our find-ings have been affected by weak instrument bias, despite
all factors having high F-statistics (>10) (Supplementary Table 2). For all glioma, we had sufficient power to dem-onstrate a causal relationship (ie, >80%) and detect ORSD of 1.33 for all but 5 risk factors. However, we only had >80% power to detect an ORSD of 1.10 for 5 traits. Moreover, our power to demonstrate subtype-specific associations was even more restricted (Supplementary Table 2a and 2b, respectively). Hence, we cannot exclude the possibility that some of the traits examined may have very modest effects on glioma risk.
Accepting these caveats, in conclusion our analysis provides no convincing evidence to support any of the 37 potentially modifiable factors we examined having a sig-nificant association with glioma risk.
Category Exposure No. of SNPs OR (95%CI)
Hypothesis-driven analysis
P Assoc.
Lifestyle and dietary factors Blood carnitine Blood methionine Blood selenium Blood zinc Circulating 25-hydroxyvitamin D Circulating adiponectin Circulating carotenoids Circulating fetuin-A Height Iron status Mono-unsaturated fatty acids
Omega-3 fatty acids Omega-6 fatty acids
Plasma IGF-I Serum calcium Serum vitamin A1 Serum vitamin B12 Serum vitamin B6 Serum vitamin E 17
Inflammatory factors Circulating C-reactive protein 14
Cardiometabolic factors Basal metabolic rate 693 Birth weight 94 Body fat percentage 370 Body mass index 964 Diastolic blood pressure 281 Fasting glucose 23 Fasting proinsulin 8
HbA1C levels 11 HDL cholesterol 57 LDL cholesterol 44 Systolic blood pressure 220 Total cholesterol 27 Total triglycerides 34 Waist circumference 318 Waist-to-hip ratio 35 Plasma IL-6 sRa 1
Serum IgE 3 0.96 (0.87–1.05) 1.54 (0.93–2.56) 1.00 (0.80–1.27) 1.01 (0.85–1.20) 1.11 (0.92–1.34) 0.74 (0.57–0.96) 1.12 (0.92–1.36) 1.04 (0.96–1.14) 0.97 (0.92–1.02) 0.81 (0.59–1.12) 1.02 (0.83–1.25) 0.87 (0.71–1.08) 1.14 (0.98–1.32) 0.82 (0.62–1.10) 0.95 (0.77–1.17) 0.90 (0.61–1.32) 1.07 (0.92–1.26) 1.40 (1.06–1.85) 0.89 (0.59–1.35) 0.93 (0.78–1.12) 0.99 (0.95–1.03) 0.95 (0.76–1.20) 1.04 (0.94–1.14) 1.17 (0.95–1.45) 1.12 (0.97–1.30) 0.98 (0.87–1.10) 1.11 (0.92–1.35) 0.91 (0.76–1.08) 1.02 (0.89–1.16) 1.30 (1.02–1.65) 1.07 (0.93–1.23) 1.15 (1.02–1.30) 1.06 (0.84–1.34) 1.14 (1.01–1.28) 0.98 (0.85–1.13) 1.11 (0.95–1.30) 1.33 (1.04–1.70) 0.6 0.8 1 1.2 OR 1.4 1.6 1.8 0.335 0.096 0.973 0.890 0.264 0.022 0.250 0.338 0.258 0.199 0.852 0.215 0.082 0.185 0.610 0.585 0.375 0.017 * * * * * * 0.595 0.440 0.535 0.670 0.457 0.149 0.128 0.682 0.280 0.275 0.781 0.036 0.364 0.021 0.611 0.032 0.812 0.188 0.022 1 1 2 5 10 1 1 2483 3 7 5 13 1 8 2 9 1 3
Fig. 4 Odds ratios for associations (Assoc.) between genetically predicted risk factors and non-GBM. Results reported as odds ratios (ORSD) and 95% CIs per genetically predicted SD unit increase in the risk factor. A fixed-effects inverse variance weighted (IVW-FE) method was used to summarize Wald ratio estimates from individual SNPs. *P-values suggestive of an association (range: 0.05–1.35 × 10⁻³); **significant P-values
(<1.35 × 10⁻³).
214
Saunders et al.
Lack of association between modifiable exposures and glioma risk
Supplementary Material
Supplementary data are available at Neuro-Oncology online.
Keywords
cancer | glioma | Mendelian randomization | risk
Funding
C.N.S. was supported by Cancer Research UK (C1298/A8362). J.L.B. was supported by P30 CA008748. M.W. was sup-ported by the National Institutes of Health (P50CA097257 and 1R01CA207360), as well as the LOGLIO Collective and the Stanley D. Lewis and Virginia S. Lewis Endowed Chair in Brain Tumor Research.
Acknowledgments
Availability of data and material: Genetic instruments can be obtained through MR-Base (http://www.mrbase.org/)23 or from
the individual reference papers. Meta-analyzed glioma GWAS data were obtained from the study by Melin et al,21 which is a
meta-analysis of 8 independent GWAS studies (UK,33 French,34
German,35 MDA,36 UCSF-SFAGS,36 GliomaScan,37 GICC,38
and UCSF/Mayo39) detailed in Supplementary Tables 4, 4a,
and 4b. Genotype data from the Glioma International Case-Control Consortium Study GWAS are available from the data-base of Genotypes and Phenotypes (dbGaP) under accession phs001319.v1.p1. Additionally, genotypes from the GliomaScan GWAS can be accessed through dbGaP accession phs000652. v1.p1. Summary statistics from the glioma GWAS meta-analysis are available from the European Genome-phenome Archive (EGA, http://www.ebi.ac.uk/ega/) under accession number EGAS00001003372.
Supplementary data tables separate SNPs and analysis data by glioma (Supplementary Table X), GBM (Supplementary Table Xa) and non-GBM (Supplementary Table Xb).
Conflict of interest statement. The authors declare that they have no competing interests
Authorship statement. CNS and AJC performed statistical analyses. CNS, AJC, BK, and RSH drafted the manuscript. All au-thors reviewed, read, and approved the final manuscript.
References
1. Shonka NA, Loeffler JS, Cahill DP, De Groot M J. Primary and meta-static brain tumors | cancer network. Cancer Netw. 2015. https://www. cancernetwork.com/cancer-management/primary-and-metastatic-brain-tumors. Accessed July 25, 2019.
2. Bondy ML, Scheurer ME, Malmer B, et al; Brain Tumor Epidemiology Consortium. Brain tumor epidemiology: consensus from the Brain Tumor Epidemiology Consortium. Cancer. 2008;113(7 Suppl):1953–1968. 3. Peter ID, Linet MS, Heineman EF. Etiology of brain tumors in adults.
Epidemiol Rev. 2017;17(2):382–414.
4. Leece R, Xu J, Ostrom QT, Chen Y, Kruchko C, Barnholtz-Sloan JS. Global incidence of malignant brain and other central nervous system tumors by histology, 2003–2007. Neuro Oncol. 2017;19(11):1553–1564.
5. Lian W, Wang R, Xing B, Yao Y. Fish intake and the risk of brain tumor: a meta-analysis with systematic review. Nutr J. 2017;16(1):1.
6. Kaplan S, Novikov I, Modan B. Nutritional factors in the etiology of brain tumors: potential role of nitrosamines, fat, and cholesterol. Am J Epidemiol. 1997;146(10):832–841.
7. Niedermaier T, Behrens G, Schmid D, Schlecht I, Fischer B, Leitzmann MF. Body mass index, physical activity, and risk of adult meningioma and glioma: a meta-analysis. Neurology. 2015;85(15):1342–1350.
8. Edlinger M, Strohmaier S, Jonsson H, et al. Blood pressure and other met-abolic syndrome factors and risk of brain tumour in the large population-based Me-Can cohort study. J Hypertens. 2012;30(2):290–296. 9. Kyritsis AP, Bondy ML, Levin VA. Modulation of glioma risk and
pro-gression by dietary nutrients and antiinflammatory agents. Nutr Cancer. 2011;63(2):174–184.
10. Qin S, Wang M, Zhang T, Zhang S. Vitamin E intake is not associated with glioma risk: evidence from a meta-analysis. Neuroepidemiology. 2014;43(3–4):253–258.
11. Kuan AS, Green J, Kitahara CM, et al. Diet and risk of glioma: combined analysis of 3 large prospective studies in the UK and USA. Neuro Oncol. 2019;21(7):944–952.
12. Seliger C, Ricci C, Meier CR, et al. Diabetes, use of antidiabetic drugs, and the risk of glioma. Neuro Oncol. 2016;18(3):340–349.
13. Ulmer H, Borena W, Rapp K, et al. Serum triglyceride concentra-tions and cancer risk in a large cohort study in Austria. Br J Cancer. 2009;101(7):1202–1206.
14. Liang R, Li J, Li M, et al. Clinical significance of pre-surgical serum lipid levels in patients with glioblastoma. Oncotarget. 2017;8(49):85940–85948.
15. Spiller W, Slichter D, Bowden J, Davey Smith G. Detecting and cor-recting for bias in Mendelian randomization analyses using gene-by-environment interactions. Int J Epidemiol. 2018:187849. doi: 10.1093/ ije/dyy204.
16. Johansen C, Schüz J, Andreasen AS, Dalton SO. Study designs may influence results: the problems with questionnaire-based case-control studies on the epidemiology of glioma. Br J Cancer. 2017;116(7):841–848.
17. Burgess S, Butterworth A, Thompson SG. Mendelian randomization analysis with multiple genetic variants using summarized data. Genet Epidemiol. 2013;37(7):658–665.
18. Disney-Hogg L, Sud A, Law PJ, et al. Influence of obesity-related risk factors in the aetiology of glioma. Br J Cancer. 2018;118(7):1020–1027. 19. Disney-Hogg L, Cornish AJ, Sud A, et al. Impact of atopy on risk of
glioma: a Mendelian randomisation study. BMC Med. 2018;16(1):42.
20. Takahashi H, Cornish AJ, Sud A, et al. Mendelian randomisation study of the relationship between vitamin D and risk of glioma. Sci Rep-UK. 2018;8(1):2339.
21. Melin BS, Barnholtz-Sloan JS, Wrensch MR, et al; GliomaScan Consortium. Genome-wide association study of glioma subtypes iden-tifies specific differences in genetic susceptibility to glioblastoma and non-glioblastoma tumors. Nat Genet. 2017;49(5):789–794.
22. Davies NM, Holmes MV, Davey Smith G. Reading Mendelian random-isation studies: a guide, glossary, and checklist for clinicians. BMJ. 2018;362:k601.
23. Hemani G, Zheng J, Elsworth B, et al. The MR-Base platform sup-ports systematic causal inference across the human phenome. Elife. 2018;7:1–29.
24. Lawlor DA, Harbord RM, Sterne JAC, Timpson N, Smith GD. Mendelian randomization: using genes as instruments for making causal inferences in epidemiology. Stat Med. 2008;27(8):1133–1163.
25. Hartwig FP, Davey Smith G, Bowden J. Robust inference in summary data Mendelian randomization via the zero modal pleiotropy assump-tion. Int J Epidemiol. 2017;46(6):1985–1998.
26. Bowden J, Davey Smith G, Haycock PC, Burgess S. Consistent estima-tion in Mendelian randomizaestima-tion with some invalid instruments using a weighted median estimator. Genet Epidemiol. 2016;40(4):304–314. 27. Burgess S, Bowden J, Fall T, Ingelsson E, Thompson SG. Sensitivity
analyses for robust causal inference from mendelian random-ization analyses with multiple genetic variants. Epidemiology. 2017;28(1):30–42.
28. Bowden J, Davey Smith G, Burgess S. Mendelian randomization with invalid instruments: effect estimation and bias detection through Egger regression. Int J Epidemiol. 2015;44(2):512–525.
29. RStudio Team. RStudio: integrated development environment for R. 2018. http://www.rstudio.com/. Accessed June 1, 2019.
30. Harrington B. INKSCAPE. 2019. https://www.inkscape.org. Accessed June 1, 2019.
31. Stacey SN, Sulem P, Jonasdottir A, et al; Swedish Low-risk Colorectal Cancer Study Group. A germline variant in the TP53 polyadenylation signal confers cancer susceptibility. Nat Genet. 2011;43(11):1098–1103. 32. Hemani G, Bowden J, Davey Smith G. Evaluating the potential role
of pleiotropy in Mendelian randomization studies. Hum Mol Genet. 2018;27(R2):R195–R208.
33. Cardis E, Richardson L, Deltour I, et al. The INTERPHONE study: design, epidemiological methods, and description of the study population. Eur J Epidemiol. 2007;22(9):647–664.
34. Sanson M, Hosking FJ, Shete S, et al. Chromosome 7p11.2 (EGFR) varia-tion influences glioma risk. Hum Mol Genet. 2011;20(14):2897–2904. 35. Kinnersley B, Labussière M, Holroyd A, et al. Genome-wide association
study identifies multiple susceptibility loci for glioma. Nat Commun. 2015;6:8559.
36. Shete S, Hosking FJ, Robertson LB, et al. Genome-wide associa-tion study identifies five susceptibility loci for glioma. Nat Genet. 2009;41(8):899–904.
37. Rajaraman P, Melin BS, Wang Z, et al. Genome-wide association study of glioma and meta-analysis. Hum Genet. 2012;131(12):1877–1888. 38. Amirian ES, Armstrong GN, Zhou R, et al. The glioma international
case-control study: a report from the genetic Epidemiology of Glioma International Consortium. Am J Epidemiol. 2016;183(2):85–91. 39. Wrensch M, Jenkins RB, Chang JS, et al. Variants in the CDKN2B and
RTEL1 regions are associated with high-grade glioma susceptibility. Nat Genet. 2009;41(8):905–908.