HAL Id: hal-00303142
https://hal.archives-ouvertes.fr/hal-00303142
Submitted on 16 Oct 2007HAL is a multi-disciplinary open access
archive for the deposit and dissemination of sci-entific research documents, whether they are pub-lished or not. The documents may come from teaching and research institutions in France or abroad, or from public or private research centers.
L’archive ouverte pluridisciplinaire HAL, est destinée au dépôt et à la diffusion de documents scientifiques de niveau recherche, publiés ou non, émanant des établissements d’enseignement et de recherche français ou étrangers, des laboratoires publics ou privés.
Influence of Giant CCN on warm rain processes in the
ECHAM5 GCM
R. Posselt, U. Lohmann
To cite this version:
R. Posselt, U. Lohmann. Influence of Giant CCN on warm rain processes in the ECHAM5 GCM. Atmospheric Chemistry and Physics Discussions, European Geosciences Union, 2007, 7 (5), pp.14767-14811. �hal-00303142�
ACPD
7, 14767–14811, 2007 Influence of Giant CCN on warm rain processes R. Posselt and U. Lohmann Title Page Abstract Introduction Conclusions References Tables Figures ◭ ◮ ◭ ◮ Back Close Full Screen / EscPrinter-friendly Version Interactive Discussion Atmos. Chem. Phys. Discuss., 7, 14767–14811, 2007
www.atmos-chem-phys-discuss.net/7/14767/2007/ © Author(s) 2007. This work is licensed
under a Creative Commons License.
Atmospheric Chemistry and Physics Discussions
Influence of Giant CCN on warm rain
processes in the ECHAM5 GCM
R. Posselt and U. Lohmann
Institute for Atmospheric and Climate Science, ETH Zurich, Universitaetsstrasse 16, 8092 Zurich, Switzerland
Received: 25 September 2007 – Accepted: 9 October 2007 – Published: 16 October 2007 Correspondence to: R. Posselt ([email protected])
ACPD
7, 14767–14811, 2007 Influence of Giant CCN on warm rain processes R. Posselt and U. Lohmann Title Page Abstract Introduction Conclusions References Tables Figures ◭ ◮ ◭ ◮ Back Close Full Screen / EscPrinter-friendly Version Interactive Discussion
Abstract
Increased Cloud Condensation Nuclei (CCN) load due to anthropogenic activity might lead to non-precipitating clouds because the cloud drops become smaller (for a con-stant liquid water content) and, therefore, less efficient in rain formation (aerosol indirect effect). Adding giant CCN (GCCN) into such a cloud can initiate precipitation (namely,
5
drizzle) and, therefore, might counteract the aerosol indirect effect.
The effect of GCCN on global climate, especially on clouds and precipitation, within a General Circulation Model (GCM) is investigated. GCCN are aerosol particles larger than 5–10µm in radius that can act as cloud condensation nuclei. One prominent GCCN species is sea salt. Sea salt concentrations depend mainly on wind speed but
10
also on relative humidity, stability and precipitation history. Natural variability is much larger than the simulated one because sea salt emissions within ECHAM5 are a func-tion of wind speed only. Giant sea salt concentrafunc-tions in ECHAM5 are determined by using the tail of the coarse mode aerosol distribution with cutoff radii of 5 µm or 10µm. It is assumed that activated GCCN particles directly form rain drops (of 25 µm
15
size). Thereby, the added rain water mass and number stems from the redistribution of the condensed water into cloud and rain water according to the number of activated GCCN. As the formed precipitation is most likely drizzle with rather small drops a prog-nostic rain scheme is applied to account for the lower fall speeds and, therefore, slower sedimentation of the drizzle drops.
20
The ECHAM5 simulations with incorporated GCCN show that precipitation is affected only locally. Cloud properties like liquid water and cloud drop number show a larger sensitivity to GCCN. On the one hand, the increased rain water mass causes an in-crease in the accretion rate and, therefore, in the rain production. On the other hand, very high GCCN concentrations can lead to an artificially exaggerated transfer of cloud
25
water to the rain class which then results in a strong decrease of the conversion rate and the rain production.
The introduction of the GCCN reduces the anthropogenic increase of liquid water 14768
ACPD
7, 14767–14811, 2007 Influence of Giant CCN on warm rain processes R. Posselt and U. Lohmann Title Page Abstract Introduction Conclusions References Tables Figures ◭ ◮ ◭ ◮ Back Close Full Screen / EscPrinter-friendly Version Interactive Discussion in the atmosphere from pre-industrial to present day because clouds are precipitating
faster in the presence of the GCCN. Hence, the accumulation of liquid water in the at-mosphere is reduced. According to those changes in the cloud properties, the radiative budget is also changing. The GCCN cause a reduction of the anthropogenic aerosol indirect effect of about 0.1–0.25 W m−2which corresponds to 5–10% of the total effect.
5
Thus, the GCCN in ECHAM5 partly offset the anthropogenic aerosol indirect effect.
1 Introduction
Clouds play an important role in the energy budget of the earth. Anthropogenic influ-ences change the radiative properties of clouds. Aerosol particles and their precursors emitted from the earth’s surface, in particular, are thought to change the physical and
10
optical properties of clouds. The first indirect effect refers to decreasing cloud droplet sizes as the concentration of (anthropogenic) aerosols increases. For a constant liquid water content, the higher number of smaller cloud droplets leads to an increase in the cloud albedo and therefore, in the planetary albedo. Furthermore, it is more unlikely that the cloud droplets will grow to precipitation sized drops. This presumably results
15
in a prolonged lifetime of clouds within the atmosphere. This second aerosol indirect effect also causes an increase in the planetary albedo. However, the size of both of these effects is still very uncertain. In contrast to most of the (small) aerosols that act as Cloud Condensation Nuclei (CCN), giant CCN (GCCN, e.g., sea salt) are sug-gested to have an enhancing effect on the formation of precipitation (i.e., drizzle) (e.g.,
20
Rosenfeld et al.,2002;Johnson,1982;Feingold et al.,1999;Zhang et al.,2006).
1.1 Sea salt measurements and parameterizations
Sea salt is the dominant aerosol species over the ocean. The direct effect of sea salt on climate is a cooling due to the scattering of incoming solar radiation of −1.51 to −5.03 W m−2 at top of the atmosphere (TOA) (Schulz et al.,2004). Sea salt acts as a
25
ACPD
7, 14767–14811, 2007 Influence of Giant CCN on warm rain processes R. Posselt and U. Lohmann Title Page Abstract Introduction Conclusions References Tables Figures ◭ ◮ ◭ ◮ Back Close Full Screen / EscPrinter-friendly Version Interactive Discussion very good CCN and, therefore, also has an indirect effect on climate via cloud
forma-tion. The emission of sea salt is mainly driven by wind speed. Turbulent and convec-tive mixing and gravitational settling contribute to the sea salt distribution in the marine boundary layer as well (Fitzgerald,1991). Sea salt aerosols of different sizes form by various mechanisms (Andreas et al., 1995). At lower wind speeds (u10>3−5 m s−1)
5
sea salt is emitted by bubble breaking of the whitecaps of the ocean. Thereby, air is getting entrained in the oceanic surface layer which depends mainly on the wind stress. The generated film droplets produce a few hundred sea salt particles (per bubble) with radii lower than 3 µm. Furthermore, jet drops are formed which result in a few (1 to 6) sea salt particles with sizes ofr=3−20 µm. Stronger winds (u10>7−11 m s−1) cause a
10
mechanical tearing of the wave crest. Spume drops are generated by tearing of drops by the wind and splash drops are the spillings of the breaking wave. Both mechanisms result in sea salt particles larger than 20 µm.
Measurements of sea salt are usually taken in the surface layer at a height of about 10−20 m. Some observations also include towers at the shore (40 m, O’Dowd et al.,
15
1997) and flights (Reid et al., 2001). The total particle concentration over the ocean
is 100−300 cm−3 (Fitzgerald,1991). Thereby, the smaller particles (r<3 µm) make up 90−95% of the total number concentration and about 5% of total mass. These par-ticles consist mainly of non-sea-salt sulphate. The larger the parpar-ticles become the higher is the sea salt fraction, i.e., the ratio of sea salt to total aerosol. Particles larger
20
than 0.5 µm (coarse mode aerosol) consist mainly of sea salt (∼60−100%) (Lewis and Schwartz,2004;Fitzgerald,1991). If dust is present, then sea salt and dust are equally distributed (Fitzgerald, 1991). Coarse mode particles are found at concentrations of 5−30 cm−3 (Fitzgerald, 1991). Giant sea salt (r>5 µm) is much less abundant. Con-centrations of 10−4
−10−2cm−3were found byFeingold et al.(1999).Smith et al.(1989)
25
reports values of 10−4
−10−2cm−3 for calm conditions up to 0.1−1 cm−3 with strong winds (u10∼30 m s−1).
Sea salt aerosols smaller than 10−25 µm are assumed to be well mixed in the marine boundary layer because they experience a rapid mixing and little influence of the gravity
ACPD
7, 14767–14811, 2007 Influence of Giant CCN on warm rain processes R. Posselt and U. Lohmann Title Page Abstract Introduction Conclusions References Tables Figures ◭ ◮ ◭ ◮ Back Close Full Screen / EscPrinter-friendly Version Interactive Discussion (Lewis and Schwartz, 2004; Reid et al., 2001). Particles larger than 25 µm are well
mixed throughout the surface layer (few meters above the sea surface) (Lewis and Schwartz, 2004) but they are highly affected by gravitational settling. In an unstable boundary layer the mixing is enhanced by turbulence and convection, whereas in a stable atmosphere mixing and, thus, sea salt concentrations are diminished above the
5
surface layer.
The incorporation of sea salt emissions in General Circulation Models (GCM), such as the ECHAM5, is done by a sea salt generation or source function. Usually, it is a wind dependent flux (per size) of sea salt from the ocean surface (Schulz et al.,2004). Some source functions assume steady state conditions where the surface production
10
balances the removal by dry deposition (Schulz et al.,2004). However, this assump-tion is only true for relatively small sea salt particles. The larger the particles and/or the higher the wind speeds become the longer it takes them to reach steady state (Reid et al.,2001). The derivation of the sea salt generation functions is based on field ob-servations (e.g., Smith and Harrison,1998) and (additional) laboratory measurements
15
(e.g., Monahan et al., 1986). A limitation for these relationships is the size range covered by the instruments. Combinations of existing generation functions are used to obtain sea salt generation functions that cover larger size ranges, a variety of wind speed conditions and fit available observations (Guelle et al.,2001;Andreas,1998). 1.2 Clouds, precipitation and Giant CCN
20
The impact of GCCN on the formation of precipitation is the subject of various studies.
Johnson (1982) combined a condensation model with two collection models (parcel
and trajectory model). Cloud water was formed on an aerosol distribution (including ultra-giant CCN:r>10 µm) by condensation. Giant and ultra-giant CCN produce a tail of large droplets within the cloud droplet distribution. The resulting cloud droplets take
25
part in collision/coalescence processes. Very large drops (∼60−100 µm) contribute most to the precipitation formation because they have a high collection efficiency. It was also found that continental clouds are inefficient in producing precipitation if no giant
ACPD
7, 14767–14811, 2007 Influence of Giant CCN on warm rain processes R. Posselt and U. Lohmann Title Page Abstract Introduction Conclusions References Tables Figures ◭ ◮ ◭ ◮ Back Close Full Screen / EscPrinter-friendly Version Interactive Discussion or ultra-giant CCN are available, whereas, maritime clouds depend less on GCCN for
precipitation formation. Sedimentation of droplets is considered in the trajectory model. Thus, very large drops become less important because they fall out of the cloud before taking part in the collection processes. Therefore, the drop sizes important for rain production are shifted to lower sizes (∼20−50 µm) but they are still due to GCCN.
5
Similar studies with a wide range of models – a collection box model, a trajectory model, a 2 dimensional eddy-resolving model and a 3 dimensional large eddy simula-tion (LES) model – were conducted byFeingold et al. (1999). Measured GCCN con-centrations of 10−4
−10−2cm−3 (within the lowermost 30 m) and background aerosol concentrations of 50−250 cm−3were used in the model simulations. It was again found
10
that the more GCCN were present the more drizzle was produced. Thereby, the relative effect of the GCCN is increased with increasing background aerosol concentration (i.e., with increasing pollution). Nevertheless, the polluted cloud (high CCN concentrations) did not produce the same amount of drizzle as the clean cloud (low CCN concentra-tion). Furthermore, it was found that a cloud in the presence of GCCN has a lower
15
optical thickness and, therefore, a lower albedo. Hence, the GCCN might be able to moderate the effects of anthropogenic CCN on clouds and climate.
Partly contradictory results to previous studies were presented by Zhang et al. (2006). They investigated the effect of CCN concentration on precipitation in low level, warm stratiform marine and continental clouds with a one dimensional model including
20
size-resolved cloud microphysics. Seeding a polluted, non-precipitating (“continen-tal”) cloud with GCCN initiates precipitation. The GCCN lower the supersaturation in the cloud as they are preferentially activated. Small aerosol particles, originating from small, evaporated droplets, do not become reactivated. Thus, the total number of droplets decreases, whereas the size increases which results in an enhanced rain
25
production. If, on the other hand, GCCN are already present during cloud formation, then the GCCN decelerate precipitation and have only little impact on the precipitation intensity. The activated aerosol particles cannot grow to larger sizes by condensation as the GCCN take up high amounts of the available water vapor and lower the
ACPD
7, 14767–14811, 2007 Influence of Giant CCN on warm rain processes R. Posselt and U. Lohmann Title Page Abstract Introduction Conclusions References Tables Figures ◭ ◮ ◭ ◮ Back Close Full Screen / EscPrinter-friendly Version Interactive Discussion saturation. This inhibits the broadening of drop spectra which is auxiliary in initiating
rain.
Rosenfeld et al. (2002) investigated the effect of GCCN on clouds by evaluating
satellite measurements. This study concentrates on deep convective clouds in the outflow region of the Indian subcontinent. The clouds disappeared the longer they were
5
over the ocean and the further they were away from the continent. Sea salt aerosols from the ocean get mixed into the cloud which forms relatively large drops that collect the smaller drops more efficiently and the cloud starts to precipitate. The wet deposition of aerosols by rain leads to a cleaner environment which causes subsequently formed clouds to precipitate more readily. This positive feedback results in further cleansing of
10
the atmosphere.
All these studies show that the GCCN might have a non-negligible effect on the cloud and precipitation formation over the ocean. Decreasing drop number with a concurrent increase in drop size will lower the cloud albedo and, thus, result in a reduction of the cloud albedo effect. The acceleration in precipitation initiation would additionally
15
lead to a reduction of the cloud lifetime effect. However, the effect of GCCN is not yet incorporated in recent GCMs. Thus, the estimates of the aerosol indirect effect might be too high.
In this paper, ECHAM5 simulations are used to determine the effect of giant sea salt aerosol on cloud processes and, therefore, on precipitation formation as well as on
20
the global radiative budget. Firstly, sensitivity studies with the ECHAM5 Single Column Model (SCM) are conducted using prescribed CCN and GCCN concentrations. Global simulation of present day climate are compared to pre-industrial simulations both with and without incorporated GCCN.
ACPD
7, 14767–14811, 2007 Influence of Giant CCN on warm rain processes R. Posselt and U. Lohmann Title Page Abstract Introduction Conclusions References Tables Figures ◭ ◮ ◭ ◮ Back Close Full Screen / EscPrinter-friendly Version Interactive Discussion
2 Model description and setup
2.1 The general circulation model ECHAM5
The ECHAM5-GCM is based on the ECMWF model and has been further developed at the Max-Planck-Institute for Meteorology in Hamburg. Within ECHAM5 the prognos-tic equations for temperature, surface pressure, divergence and vorprognos-ticity are solved on
5
a spectral grid with a triangular truncation (Roeckner et al.,2003). Prognostic equa-tions for cloud water and cloud drop number concentration, for cloud ice and the ice crystal number concentration as well as detailed cloud microphysics are used accord-ing to Lohmann et al. (2007). In order to incorporate the GCCN and their effect on precipitation properly, prognostic equations for rain water mass mixing ratio and rain
10
drop number concentration were introduced into the ECHAM5 (Posselt and Lohmann, 20071, simulation ECHAM5-RAIN). Considered processes include autoconversion of cloud droplets to rain and accretion of cloud droplets by rain (Khairoutdinov and
Ko-gan,2000), self-collection of rain drops (Seifert and Beheng,2001), evaporation of rain
(Rotstayn,1997) and melting of snow (Lohmann and Roeckner,1996). The
sedimenta-15
tion of the rain drops is treated as a vertical one dimensional advection with an explicit fall speed. The fall speed is a function of rain water mass and number and is limited by the grid velocity (layer height/model time step). Furthermore, all processes involved in rain formation are evaluated repeatedly on smaller sub-time steps within one model time step. Single Column Model (SCM) simulations by Posselt and Lohmann (2007)1
20
showed that the prognostic rain scheme has little influence on the precipitation amount itself but it shifts the emphasis from autoconversion to accretion in better agreement with observations (Wood,2005).
1
Posselt, R. and Lohmann, U.: Introduction of prognostic rain in ECHAM5: Design and Single Column Model simulations, Atmos. Chem. Phys. Discuss., submitted, 2007.
ACPD
7, 14767–14811, 2007 Influence of Giant CCN on warm rain processes R. Posselt and U. Lohmann Title Page Abstract Introduction Conclusions References Tables Figures ◭ ◮ ◭ ◮ Back Close Full Screen / EscPrinter-friendly Version Interactive Discussion 2.2 Coupling GCCN and Prognostic Rain
Atmospheric aerosol distributions are represented by a double moment scheme con-sisting of a superposition of 7 lognormal distributions of different size ranges, solubil-ities, and chemical constituents within the aerosol module HAM (Stier et al., 2005). GCCN are not explicitly included in the HAM thus soluble coarse mode particles with
5
r>10 µm (ECHAM5-GCCN10) orr>5 µm (ECHAM5-GCCN5) are regarded as GCCN in this study. It is further assumed that over the ocean the coarse mode aerosol consists only of sea salt. The GCCN get activated together with the rest of the aerosol particles by the activation scheme ofLin and Leaitch (1997). This is an empirical scheme that only depends on aerosol number and vertical velocity. Thus, the competition effect of
10
GCCN and CCN and the lowering of the supersaturation by the GCCN is not included. The activation of the aerosol particles and the following condensation of water vapor onto the particles assuming saturation adjustment (Roeckner et al.,2003) is done for the whole aerosol spectra. GCCN are not treated separately. Afterwards, the total condensed liquid water is redistributed between the rain water mixing ratio which
cor-15
responds to the water uptake by the GCCN and the cloud water mixing ratio which is due to the activation of the CCN. The redistribution is based on the number of acti-vated GCCN. The number of rain drops formed by the activation of GCCN is equal to the number of activated GCCN. The rain water formed by the activation of GCCN is given by the mass of the newly formed rain drop times the number of activated GCCN
20
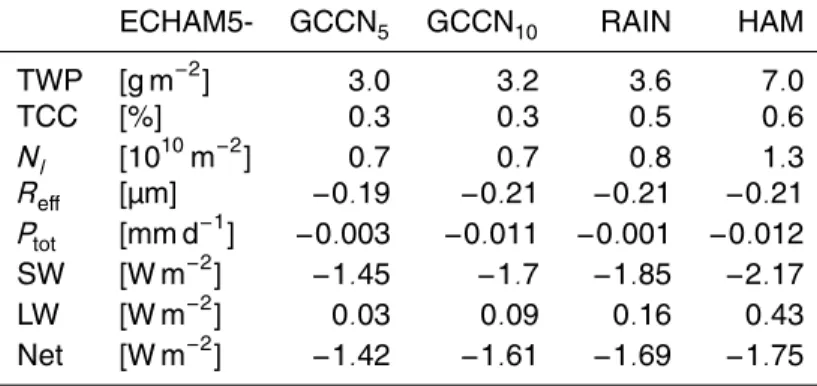
and is limited by the total amount of condensed water. The radius of the rain drops originating from GCCN is assumed to be 25 µm. This radius is chosen analogous to the rain drop distinction radius used byKhairoutdinov and Kogan(2000) in their cloud microphysics parameterization. As shown in Fig.1, the smallest GCCN (5 µm) grows to more than 25 µm in less than 15 min, i.e., within less than one model time step.
25
The schematic in Fig. 2 summarizes the changes within the large-scale cloud mi-crophysics scheme due to the GCCN. Thereby, changes or additions are marked in blue. This includes the retrieval of the GCCN number concentration from the HAM
ACPD
7, 14767–14811, 2007 Influence of Giant CCN on warm rain processes R. Posselt and U. Lohmann Title Page Abstract Introduction Conclusions References Tables Figures ◭ ◮ ◭ ◮ Back Close Full Screen / EscPrinter-friendly Version Interactive Discussion aerosols and their subsequent activation to rain drops with a radius of 25 µm within the
prognostic rain scheme. 2.3 Model setup
The SCM simulations are conducted at a T63 horizontal resolution (corresponds to 1.875◦
×1.875◦). In the vertical, 31 model levels are used with the uppermost layer
5
at 10 hPa. A simulation time step of 15 min is applied. Meteorological conditions are forced using data from the EPIC (Eastern Pacific Investigation of Climate Processes) campaign (Bretherton et al.,2004) which took place in September and October 2001 in the eastern Pacific off the coast of Ecuador and Peru (see also Posselt and Lohmann, 20071).
10
For the global simulations, a T42 horizontal resolution (corresponds to 2.8125◦
×2.8125◦) with 19 vertical model levels (uppermost layer at 10 hPa) and a time step of 30 min is used. The simulations are integrated for 10 years after a 3 month spin-up using climatological sea-surface temperatures and sea-ice extend. For the simulations in this study the relative humidity based cloud cover scheme ofSundqvist
15
et al. (1989) is used. The global simulations are done for the standard ECHAM5 as described in Lohmann et al. (2007) (ECHAM5-HAM), for the ECHAM5 with the prognostic equations for rain (ECHAM5-RAIN) and for ECHAM5-RAIN with GCCN in-cluded (ECHAM5-GCCN10,5for the different cutoff radii, respectively). ECHAM5-RAIN and ECHAM5-GCCN employ 10 sub-time steps within the prognostic rain scheme.
20
The aerosol indirect effect (AIE) is estimated by comparing present day (PD) to pre-industrial (PI) simulations. For the PI simulation, aerosol emission representative of the year 1750 are used (Dentener et al.,2006).
ACPD
7, 14767–14811, 2007 Influence of Giant CCN on warm rain processes R. Posselt and U. Lohmann Title Page Abstract Introduction Conclusions References Tables Figures ◭ ◮ ◭ ◮ Back Close Full Screen / EscPrinter-friendly Version Interactive Discussion
3 Results and discussion
3.1 SCM sensitivity study
The sensitivity study is conducted with the single column version of ECHAM5. The set up is similar toFeingold et al. (1999) but with different parameters. The number of GCCN is prescribed with 10−4, 10−3, 10−2, 10−1 and 1 cm−3. The number of
back-5
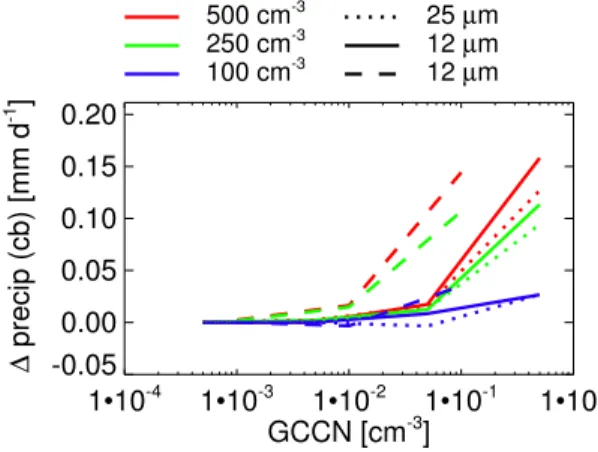
ground CCN is prescribed with 50, 250 and 500 cm−3. For this sensitivity study, the size of the activated GCCN rain drops is varied between 12, 25 or 55 µm.
These values are chosen so that volume and mass of the GCCN induced rain drops experiences a tenfold increase from the smaller to the larger size. The larger the generated rain drops the more condensed water is transfered into rain water and the
10
less water is available for the cloud droplets.
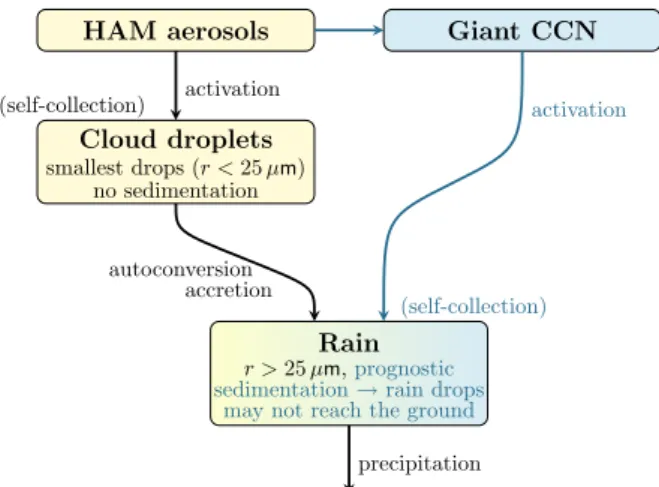
The results shown in Fig.3are averages over the whole simulation period of 6 days. The effect of the GCCN is only visible at quite high GCCN and CCN concentrations. The precipitation at cloud base (Fig. 3, upper left panel) decreases with increasing CCN concentrations. This is known as the second aerosol indirect effect where more
15
but smaller cloud droplets are less efficient is rain production and, thus, lead to reduced precipitation and a longer cloud lifetime. An increase in GCCN results in a concurrent increase in precipitation. The incorporation of the GCCN cannot, however, completely compensate the effect of the increased CCN concentrations. In case of high GCCN concentration and a large initial rain drop size (55 µm) the precipitation increase is
de-20
celerated or even reversed (for low CCN). This is due to the large fraction of condensed liquid water that is transferred to rain water by the activation of GCCN so that only little cloud water is left. This inhibits autoconversion and accretion so that no additional rain formation takes place. Furthermore, the rain drops are so large that they fall out quite fast and, therefore, are not available for the accretion process. This can also be seen
25
in the differences of the precipitation at cloud base for the various simulations shown in Fig.4. The precipitation formation is more efficient with smaller activated rain drops at higher GCCN concentration because sufficient cloud water is left for an efficient
ACPD
7, 14767–14811, 2007 Influence of Giant CCN on warm rain processes R. Posselt and U. Lohmann Title Page Abstract Introduction Conclusions References Tables Figures ◭ ◮ ◭ ◮ Back Close Full Screen / EscPrinter-friendly Version Interactive Discussion conversion process. Moreover, the rain drops sediment slow enough to take part in the
accretion. The differences are based on the same rain mass formed by the activation of the GCCN. I.e., a 25 µm drop at 10−2cm−3forms about the same amount of rain water mass as a 12 µm drop at 10−1cm−3or a 55 µm drop at 10−3cm−3when calculating the difference between “more GCCN, smaller drops” and “less GCCN, larger drops”.
5
The total water path is the sum of liquid water path and the rain water path (TWP = LWP + RWP). The TWP is larger for a higher number of CCN but is decreasing as the number of GCCN is increasing (see Fig.4, upper right panel). This corresponds to the changes in the precipitation. The changes in TWP are mainly due to changes in the LWP. The more GCCN are used and the larger the initial rain drop size the larger is the
10
initial RWP and, therefore, the LWP is decreasing. This causes the described reduction of the autoconversion and accretion rates. The equilibrium RWP is quite constant with regard to the GCCN concentrations because any additional rain water is falling out as precipitation. Similar to the precipitation, RWP is lower for higher CCN concentrations. The total cloud cover shown in Fig.3(lower panel) only shows a slight sensitivity to
15
the CCN and GCCN concentration. Increasing GCCN concentrations result in slightly lower cloud cover. The strong decrease in cloud cover for the 55 µm rain drop size is connected to the strong reduction in total water.
3.2 Global simulations 3.2.1 Model validation
20
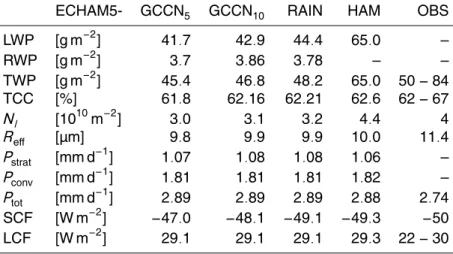
The results of the global simulations are summarized in Fig.5and Table1. The conclu-sions of the model evaluation with observations mainly followsLohmann et al.(2007) as observational uncertainties are quite large and/or changes in the model variables for the different simulations are rather small. However, some variables show differ-ences, either in annual global mean (see Table1) or in the annual zonal means (see
25
Fig.5). The annual global means are shown for the ECHAM5-HAM, ECHAM5-RAIN
and ECHAM5-GCCN simulations for the present day (PD) setup. 14778
ACPD
7, 14767–14811, 2007 Influence of Giant CCN on warm rain processes R. Posselt and U. Lohmann Title Page Abstract Introduction Conclusions References Tables Figures ◭ ◮ ◭ ◮ Back Close Full Screen / EscPrinter-friendly Version Interactive Discussion The Global Precipitation Climatology Project (GPCP) dataset provides monthly
av-eraged precipitation fields from satellite and surface rain gauge measurements on a 2.5◦
×2.5◦ grid for a period from 1979 up to now (Huffman et al., 1997; Adler et al., 2003). Compared to this dataset, ECHAM5 generally produces too much precipitation. The zonal mean (Fig.5) reveals that the precipitation in the tropics is overestimated
5
by ECHAM5 which points to deficiencies in the convective cloud scheme. Neverthe-less, the overall agreement in the zonal distribution is satisfactory. The incorporation of the GCCN hardly affects the precipitation amount zonally and globally. Compared to ECHAM5-HAM (Table1), the total precipitation amount is hardly affected by the in-troduction of the prognostic rain scheme and the incorporation of the GCCN. A slight
10
increase is given for the stratiform precipitation due to the slowing down of the rain and thus increasing the rain production by accretion in the stratiform cloud microphysics scheme. Feedbacks to the convection results in a slight decrease of convective precip-itation.
The International Satellite Cloud Climatology Project (ISCCP, Rossow and
Schif-15
fer,1999) provides total cloud amount on a grid size of 280 km (ISCCP D2 dataset).
Surface observations collected byHahn et al.(1994) cover mainly the northern hemi-sphere, only limited coverage is given for the southern hemisphere. The annual global mean of total simulated cloud cover (Table1) is at the lower end of the observations for all simulations. For the zonal mean, the agreement is best in the tropics and in
20
the midlatitudes but in the subtropics the cloud cover is largely underestimated due to an underrepresentation of stratocumulus cloud decks off the west coasts of North and South America and Africa. In higher latitudes, differences are due to the uncertain-ties in the measurements. The global mean cloud cover is slightly decreasing for the ECHAM5-GCCN simulation but that can not be seen for the zonal distributions.
25
The satellite (SSM/I) retrievals of the LWP (Greenwald et al.,1993;Weng and Grody,
1994;Wentz,1997) are only available over the oceans. They show a high variability for
the annual global mean and also for the zonal mean. The observed LWP is compared to the TWP of the simulations because the model artificially distinguishes between the
ACPD
7, 14767–14811, 2007 Influence of Giant CCN on warm rain processes R. Posselt and U. Lohmann Title Page Abstract Introduction Conclusions References Tables Figures ◭ ◮ ◭ ◮ Back Close Full Screen / EscPrinter-friendly Version Interactive Discussion smaller cloud drops and the larger rain drops that the satellites do not make. The TWP
produced by the ECHAM5-HAM simulation falls within the range given by the obser-vations. The introduction of the prognostic rain scheme results in a redistribution of the total water and changes in the cloud microphysics compared to the ECHAM5-HAM which results in an underestimation of the TWP in comparison to the observations. This
5
can also be seen in the zonal distribution of the TWP in Fig.5. The main decrease due to the introduction of the prognostic rain appears in the midlatitudes where the pre-cipitation formation is mainly done via the large-scale cloud scheme. The introduction of GCCN results in an additional slight decrease in the TWP as discussed further in Sect. 3.2.3. In the tropics, the differences between HAM and
ECHAM5-10
RAIN/GCCN are small.
Observations of vertically integrated cloud drop numberNl and effective radius Reff at cloud top for warm clouds (T>0◦C) are retrieved from the ISCCP dataset by Han et al. (1994,1998) for an area between −50◦ and 50◦ based on four months of 1987. Similar to the TWP, the annual global means show that the ECHAM5-HAM simulation of
15
Nl agree well with the observations whereas the ECHAM5-RAIN and ECHAM5-GCCN simulations underestimate Nl. This results in a quite constant Reff for all simulations but compared to the observationsReffis underestimated. The zonal mean ofNl shows an underestimation in the midlatitudes especially on the northern hemisphere for the ECHAM5-RAIN/GCCN simulations.
20
Obviously, the agreement of TWP and Nl gets worse due to the implementation of the prognostic rain scheme. But one has to bear in mind that the prognostic rain changes the hydrological cycle and therefore also feeds back to the radiative budget. Thus, the ECHAM5-RAIN/GCCN simulations are no longer in radiative balance at top of the atmosphere (TOA). ECHAM5-RAIN/GCCN would need retuning within the
large-25
scale cloud scheme to achieve radiative balance at TOA, which additionally would affect TWP and Nl and presumably improve the agreement with the observations. However, this study focus on the relative changes due to the incorporation of the GCCN, which should be independent on the tuning state of the model. Thus, no retuning was applied
ACPD
7, 14767–14811, 2007 Influence of Giant CCN on warm rain processes R. Posselt and U. Lohmann Title Page Abstract Introduction Conclusions References Tables Figures ◭ ◮ ◭ ◮ Back Close Full Screen / EscPrinter-friendly Version Interactive Discussion for this study.
The zonal mean of short-wave and long-wave cloud forcing (SCF and LCF) as ob-tained from the Earth radiation budget experiment (ERBE, Kiehl et al., 1994) are in good agreement with the ECHAM5 simulations except in higher latitudes for the SCF and in the tropics for the LCF. For the LCF, additional data from the TOVS-B satellite
5
(Susskind et al.,1997) is shown which give better agreement with the ECHAM5 data in the tropics but is lower in the mid-latitudes. The differences in the different measure-ments illustrate the uncertainties of the observations. The short-wave cloud forcing is slightly decreasing with the prognostic rain scheme due to lower TWP. The long-wave cloud forcing is not affected by the prognostic rain scheme and the GCCN.
10
3.2.2 Validation of GCCN concentrations
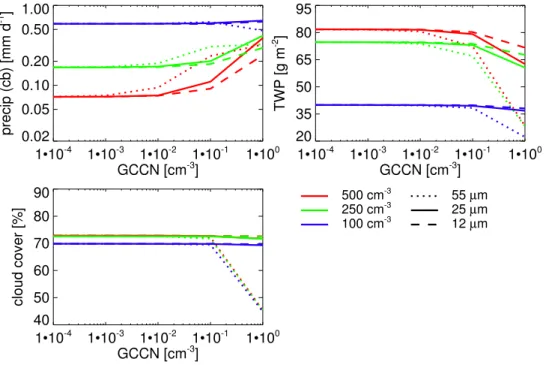
The column integrated GCCN burden obtained by ECHAM5-GCCN10,5for the different cutoff radii are shown in Fig.6. The GCCN burden is about 4 to 5 orders of magnitude lower than the total aerosol burden. The highest GCCN loads are present in the storm tracks of the southern ocean and the north Atlantic and Pacific where high wind speeds
15
are predominant. Relatively low GCCN burdens are found in the tropics and off the west coasts of the continents, which results from rather low wind speeds in these areas. The cutoff radius has a strong impact on the GCCN load of the atmosphere. Doubling the cutoff radius from 5 µm to 10 µm causes a decrease in GCCN burden by an order of magnitude.
20
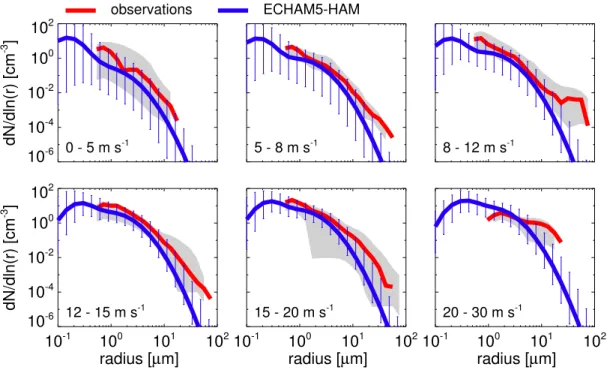
Figure 7shows sea salt number distributions for different wind speed classes from observations and from ECHAM5-HAM. The observed size distribution were taken from
Lewis and Schwartz(2004). They compiled measurements from various authors,
con-verted the distributions to number distributions (d n/d ln(r)) and arranged them ac-cording to the reported wind speed. The observations were taken over the northern
25
Atlantic, at measuring sites along the eastern and western U.S., during ship cruises in the East-China Sea, the Indian Ocean and within the southern storm track. The pre-sented measurements were taken at heights of 5 to 20 m above sea level. Within the
ACPD
7, 14767–14811, 2007 Influence of Giant CCN on warm rain processes R. Posselt and U. Lohmann Title Page Abstract Introduction Conclusions References Tables Figures ◭ ◮ ◭ ◮ Back Close Full Screen / EscPrinter-friendly Version Interactive Discussion well mixed marine boundary layer the concentrations should not vary much with height.
Measuring techniques include impaction sampling on filters or glass slides with subse-quent investigation by electron microscopy, optical detection of aerosol particles and thermal volatility measurements. In their compilationLewis and Schwartz (2004) ex-cluded measurements of continental air masses (at maritime sites) and measurements
5
from surf zones. The simulated size distributions are represented by the superposition of the soluble accumulation and coarse mode distribution of the aerosol module HAM limited to the oceans. As a measure of variability of the size distribution the minimum-maximum range of the observations and the 5% and 95% percentiles of the simulation are shown as well.
10
It can be seen that the simulated sea salt size distribution reproduces the obser-vations quite well. However, the simulation shows a tendency to slightly underesti-mate the observed size distributions. The simulated number of giant sea salt particles shows a larger underestimation especially for higher wind speeds but the concentra-tions within this size range are rather low. However, one has also to bear in mind that
15
the observations are limited to a certain area and cover only some days of measure-ments. Considering these limitations, the assumption of using the tail of the coarse mode distribution to obtain the GCCN concentration is appropriate.
The validation of the giant sea salt concentration is done by a point-to-point com-parison of observed and simulated concentrations. Therefore, the number distributions
20
reported byLewis and Schwartz(2004) are integrated with respect to the chosen cutoff radius of 5 or 10 µm. The obtained concentrations are then compared to the simulated GCCN concentration at the same location in the lowest model level. The results are presented in Fig.8. First of all it can be seen that the natural variability of the GCCN concentration is much larger than the simulated one because the modeled
concentra-25
tion depends mainly on the wind speed whereas the observed concentration are also influenced by various other factors. Lewis and Schwartz (2004) stated that the vari-ability of the measured sea salt concentration is rather large even if measured at the same location and with the same instrument. They argued that the sea salt
ACPD
7, 14767–14811, 2007 Influence of Giant CCN on warm rain processes R. Posselt and U. Lohmann Title Page Abstract Introduction Conclusions References Tables Figures ◭ ◮ ◭ ◮ Back Close Full Screen / EscPrinter-friendly Version Interactive Discussion tration depends not only on the wind speed but also on the ambient relative humidity,
the stability of the atmosphere, the mixing layer height, the time since the last rain and the history of all of these factors within the measured air mass. The comparison for the 5 µm cutoff (Fig.8, lower panel) shows that the ECHAM5-GCCN underestimates the GCCN concentrations. A large portion of the data points are more than a factor
5
of 10 smaller than the observed values. Using a cutoff radius of 10 µm (Fig.8, upper panel) improves the agreement between simulated and observed GCCN concentra-tions. Most model data fall within a factor of 10 of the observaconcentra-tions. Furthermore, the obtained GCCN concentrations for the 10 µm cutoff agree much better with the GCCN concentrations of 10−2
−10−4cm−3reported byFeingold et al.(1999).
10
3.2.3 Incorporation of GCCN
The changes in the model results due to the additional incorporation of GCCN are summarized in Figs.5(annual zonal means) and9(global distribution) and in Table1. Thereby, the differences between the ECHAM5-GCCN and the ECHAM5-RAIN simu-lations are considered. For precipitation and total cloud cover the differences are rather
15
small. In the zonal means (Fig.5) hardly any change is visible.
Nevertheless, the difference plots in Fig.9reveal that there are slight changes in the precipitation patterns. Whether there is a reduction or an enhancement of precipitation depends on how much water is transfered to the rain class and how strong autoconver-sion, accretion and evaporation are influenced by that. The changes in the stratiform
20
precipitation (Fig.9, left panel) are rather small. The precipitation changes for the 5 and 10 µm cutoff follow the same patterns and are of same magnitude.
Major changes are visible over the oceanic storm track regions that can be directly attributed to the presence of GCCN and their impact on the rain formation. Over the continents no GCCN are present, thus, the changes over the midlatitude and subtropic
25
continents are indirectly influenced by the GCCN due to changes in the hydrological cycle. Over the continents the changes in large-scale precipitation is directly correlated to changes in the TWP (Fig.9, right panel), i.e., more TWP leads to enhanced
ACPD
7, 14767–14811, 2007 Influence of Giant CCN on warm rain processes R. Posselt and U. Lohmann Title Page Abstract Introduction Conclusions References Tables Figures ◭ ◮ ◭ ◮ Back Close Full Screen / EscPrinter-friendly Version Interactive Discussion tation (e.g., Europe, Amazonia, north-east and south-east China) and less TWP leads
to lower precipitation rates (e.g., eastern North-America). The changes in the hydro-logical cycle also feed back to the convective precipitation (Fig.9, middle panel shows total precipitation = large-scale + convective precipitation). Changes in the precipita-tion patterns upwind of the convective regions lead to changes in the moisture field that
5
triggers convection within ECHAM5. More upwind precipitation results in a dryer atmo-sphere and therefore less convection and vice versa. The most striking changes in convective precipitation are visible over the warm pool (i.e., Indonesia) which is mainly due to enhanced precipitation upwind in the western Pacific. A similar feature appears in the Amazon region.
10
The incorporation of GCCN causes further changes to the TWP. The choice of the 5 µm cutoff leads to a stronger decrease in TWP than for the 10 µm cutoff. The GCCN concentration are higher with the 5 µm cutoff so that larger amounts of condensed wa-ter are transferred to the rain class leaving less for the cloud wawa-ter. This results in lower autoconversion and accretion rates. Therefore, the changes in the precipitation are to
15
a lesser extend due to physical changes in the microphysics but are rather caused by large amounts of rain water stemming from the artificial redistribution of the condensed water. In contrast, the simulations with the 10 µm cutoff show only slight changes (in both directions) in the TWP (Fig. 9). The zonal distribution shows hardly any differ-ence for the ECHAM5-RAIN and the ECHAM5-GCCN10 simulations. Due to the lower
20
GCCN concentrations, less condensed water is transfered to the rain class leaving a larger amount for the cloud water class. Hence, the autoconversion does not change very much. However, the slight increase in rain water is enough to enhance the accre-tion rate considerably. Therefore, the shown changes in the precipitaaccre-tion patterns are mainly due to physical changes in the cloud microphysics. Furthermore, the changes
25
in the hydrological cycle due to the GCCN might also lead to changes in the relative humidity and, thus, in the amount of condensed water which in turn effects the amount of rain and cloud water.
Considering GCCN leads to a slight reduction of the SCF in regions where the TWP 14784
ACPD
7, 14767–14811, 2007 Influence of Giant CCN on warm rain processes R. Posselt and U. Lohmann Title Page Abstract Introduction Conclusions References Tables Figures ◭ ◮ ◭ ◮ Back Close Full Screen / EscPrinter-friendly Version Interactive Discussion decreases. Globally, this leads to a lower SCF in the ECHAM5-GCCN simulations and,
thus, to less cooling due to clouds. The LCF is not influenced by the GCCN. 3.2.4 Diurnal cycles
In the following, special regions are chosen to estimate the influence of GCCN on the diurnal cycle and the amount of precipitation. According to the hypothesis that
5
GCCN are most influential in heavily polluted air, maritime regions that encounter heavy polluted plumes from continental sites and show a considerable amount of GCCN are selected, namely, the Indian ocean region close to the Indian subcontinent, the East-China Sea and the North-West Atlantic in the vicinity of the eastern US and Canada (see Fig.10).
10
The considered regions are characterized by high aerosol loads during the summer months due to either dust outbreaks from the nearby deserts (IND and CHINA), from biomass burning and from industrial emissions (Chu and Remer, 2006). During the winter months the aerosol load is reduced.
The simulated precipitation rates are compared to precipitation estimates based on
15
TRMM (Tropical Rainfall Measuring Mission) measurements. The estimates encom-pass a 3-hourly quasi-global data set from 50◦S to 50◦N on a 2.5◦
×2.5◦grid. Data are available from February 2002 to the present.
Figure11shows the diurnal cycles of precipitation as a mean over 10 years simula-tion and 6 years TRMM-based precipitasimula-tion estimates for winter and summer months.
20
The Indian ocean region is characterized by mainly convective precipitation and hardly any large-scale precipitation (dashed lines). For the CHINA and ATL regions the large-scale precipitation is dominating during the winter months (December–February), whereas, the summer months (June–August) are characterized mainly by convec-tive precipitation. The large-scale precipitation is directly influenced by the presence
25
of GCCN, whereas, the convective precipitation is only indirectly affected through changes in the hydrological cycle or in the moisture budget.
For the winter months ECHAM5 is able to reproduce the shape of the diurnal cycle 14785
ACPD
7, 14767–14811, 2007 Influence of Giant CCN on warm rain processes R. Posselt and U. Lohmann Title Page Abstract Introduction Conclusions References Tables Figures ◭ ◮ ◭ ◮ Back Close Full Screen / EscPrinter-friendly Version Interactive Discussion and the precipitation amount quite well. In the IND case the diurnal cycle of ECHAM5
simulation is shifted to earlier hours but the total precipitation amount is captured well. For the CHINA and the ATL case only a slight diurnal cycle is visible for the simulations and the observations. ECHAM5 underestimates the precipitation for CHINA and for ATL. The differences due to the GCCN are small and affect mainly the amount and not
5
the shape of the diurnal cycle. For the IND and the CHINA region, the precipitation rate in slightly increasing for the GCCN10 simulation slightly improving the agreement with the observations. Using higher GCCN concentrations in the GCCN5simulation leads to a reduction of the precipitation rate. The ATL region experiences a precipitation de-crease when GCCN are included. This behavior results from lowered autoconversion
10
and accretion rates due to an exaggerated transfer of condensed water to rain water because too many GCCN are present.
Regarding the summer months, ECHAM5 overestimates the precipitation amount. The diurnal cycle is reproduced quite well for all regions. For the IND and the ATL region the precipitation amount is overestimated but the shape and the amplitude of
15
the diurnal cycle is captured quite well. In case of CHINA, the diurnal cycle is shifted and the amplitude is exaggerated by ECHAM5. Including a small amount of GCCN leads to an increase in precipitation. But an increase in GCCN concentration can lead to a subsequent reduction in precipitation. The convection scheme is not directly influ-enced by the GCCN, hence, the changes in convective precipitation are triggered by
20
changes in the hydrological cycle due to small changes in the large-scale precipitation and changes in the upstream precipitation patterns.
3.2.5 Present day vs. pre-industrial
The difference between present day and pre-industrial simulations gives an estimate of the effect of anthropogenic aerosols on the climate. In Table 2 the differences in
25
the annual global means due to anthropogenic aerosols for the ECHAM5 simulations are summarized. Lohmann et al.(2007) discussed the results of the ECHAM5-HAM simulation (their ECHAM5-RH simulation). The introduction of the prognostic rain
ACPD
7, 14767–14811, 2007 Influence of Giant CCN on warm rain processes R. Posselt and U. Lohmann Title Page Abstract Introduction Conclusions References Tables Figures ◭ ◮ ◭ ◮ Back Close Full Screen / EscPrinter-friendly Version Interactive Discussion sults in a smaller increase of TWP due to anthropogenic aerosol effects. Note that the
differences in the TWP are obtained over ocean and land. The incorporation of GCCN further reduces the difference between present day and pre-industrial TWP. Thus, the increase in TWP due to enhanced, anthropogenic aerosol numbers is partly compen-sated by the presence of GCCN. The same effect is found for the total cloud cover and
5
the cloud drop number. The changes in cloud drop effective radius (at cloud top) is quite constant throughout the ECHAM5 simulations. The changes in global precipita-tion due to anthropogenic activity are rather faint which is due to the applicaprecipita-tion of fixed sea-surface temperatures within the simulations and, thus, fixed evaporation from the oceans.
10
Closely connected to the cloud cover and TWP is the TOA radiative budget. The short-wave (SW) radiation budget at TOA is lowest for ECHAM5-HAM. The prognostic rain scheme lowers the effect of aerosols on the short-wave radiation so that it becomes less negative with −1.85 Wm−2. The incorporation of the GCCN partly compensates for the aerosol effects on clouds and reduce the short-wave radiation difference to
15
−1.7 Wm−2 for ECHAM5-GCCN10, which comprise lower GCCN concentration, and −1.45 Wm−2 for the ECHAM5-GCCN5 simulation. Thus, the higher the GCCN con-centrations the higher the compensation for the increased CCN concon-centrations. But, as stated before, increasing the GCCN concentration too much might lead to unphys-ical rain formation processes due to the redistribution of the condensed water. The
20
long-wave (LW) radiation budget, which is closely connected to high clouds, shows much smaller differences between PI and PD. The prognostic rain scheme leads to a decrease of the LW difference from 0.43 Wm−2 to 0.16 Wm−2 due to a smaller in-crease in TWP and total cloud cover. The incorporation of the GCCN further reduces the LW difference. The difference in the net radiation between present day and
pre-25
industrial climate is referred to as the anthropogenic aerosol effect including the di-rect and indidi-rect effects. The net radiative effect of anthropogenic aerosols is most negative for ECHAM5-HAM with −1.75 Wm−2. The incorporation of GCCN reduces the anthropogenic aerosol effect from −1.7 Wm−2 (ECHAM5-RAIN) to −1.6 Wm−2 for
ACPD
7, 14767–14811, 2007 Influence of Giant CCN on warm rain processes R. Posselt and U. Lohmann Title Page Abstract Introduction Conclusions References Tables Figures ◭ ◮ ◭ ◮ Back Close Full Screen / EscPrinter-friendly Version Interactive Discussion ECHAM5-GCCN10 and −1.4 W m−2for ECHAM5-GCCN5.
In Fig. 12 the differences in the zonal means between the present day and pre-industrial simulations are shown for precipitation, total cloud cover, TWP, cloud drop number and effective radius as well as for short-wave, long-wave and net TOA radiation. The differences for the precipitation are rather noisy. Thus, the prognostic rain scheme
5
and the incorporation of GCCN does not lead to systematic changes in the precipitation difference. The total cloud cover differences does not show a clear tendency to more or less cloudiness due the GCCN either. Regions with increased cloudiness due to the GCCN alternate with regions with decreased cloudiness.
The TWP and cloud drop number differences are largest in the northern
hemi-10
sphere. Industrialization in Europe, North America and, recently, Asia result in en-hanced aerosol number that act as CCN and influence cloud and precipitation forma-tion. AsLohmann et al.(2007) stated the TWP increase is mainly due to a retardation of drizzle formation in clouds over the ocean. Hence, clouds (and cloud water) stay longer in the atmosphere. The presence of GCCN causes a reduction of the TWP
15
and cloud drop number difference. Thus, the GCCN counteract the CCN increase and therefore reduce the aerosol indirect effects.
Consistent with the decrease in the TWP difference, the differences in the short-wave radiation (TOA) are smaller in the GCCN simulations. As the cloud top effective radius differences are rather similar for all ECHAM5 simulations the changes in the short-wave
20
radiation differences are mainly due to changes in TWP and cloud cover. The long-wave radiation differences are much smaller than those for the short-long-wave radiation and are also much noisier. Nevertheless, the changes in the long-wave radiation partly compensate the changes in the short-wave radiation as can be seen from the net radiation. Overall, the anthropogenic aerosol effect is smaller in the GCCN simulation
25
than for the ECHAM5-RAIN simulation.
Figure 13 shows the zonal mean changes of the GCCN concentration from pre-industrial to present day climate. GCCN concentrations are closely linked to the 10 m wind speed. Increasing wind speeds, which are found especially in the southern and
ACPD
7, 14767–14811, 2007 Influence of Giant CCN on warm rain processes R. Posselt and U. Lohmann Title Page Abstract Introduction Conclusions References Tables Figures ◭ ◮ ◭ ◮ Back Close Full Screen / EscPrinter-friendly Version Interactive Discussion northern storm tracks, lead to an increase of GCCN in this regions (and vice versa).
The total aerosol concentration is increasing heavily especially over the northern hemi-sphere. This increase is mainly attributed to human activity and industrial development. Hence, the GCCN ratio which is defined as ratio between GCCN to total aerosol con-centration is decreasing because the total aerosol increase is much stronger than the
5
increase in GCCN concentrations. However, as shown in the SCM sensitivity studies the influence of the GCCN is larger in the present day climate than it is in the pre-industrial climate.
4 Conclusions
The effect of GCCN on the global climate, specifically on clouds and precipitation within
10
a GCM, is investigated. The GCCN concentration is obtained by the tail of the (solu-ble/mixed) coarse mode distribution within the ECHAM5-HAM aerosol module for two different cutoff radii. GCCN are assumed to activate directly into rain drops because of their size. Within the model this is achieved by redistributing the total condensed water into cloud and rain water according to the number of GCCN and by assuming a rain
15
drop size of 25 µm.
Sensitivity studies with the SCM version of ECHAM5 are carried out with different GCCN and CCN concentration as well as with different initial rain drop sizes in order to estimate the effect of the GCCN on cloud microphysical quantities. The GCCN have an impact on the precipitation formation processes in ECHAM5 and the used
20
GCCN scheme is able to reproduce the results presented by Feingold et al. (1999). Nevertheless, larger GCCN concentrations are necessary within ECHAM5 to obtain a considerable effect. Too high GCCN concentrations or too large rain drops lead to an exaggerated transfer of the condensed water to the rain class at the expense of the cloud water. This reduces autoconversion and accretion rates and results in lowered
25
precipitation rates. This effect is an artifact in the model because in nature large drops grow slower than smaller drops and, thus, the rain drops would not grow to those large
ACPD
7, 14767–14811, 2007 Influence of Giant CCN on warm rain processes R. Posselt and U. Lohmann Title Page Abstract Introduction Conclusions References Tables Figures ◭ ◮ ◭ ◮ Back Close Full Screen / EscPrinter-friendly Version Interactive Discussion sizes if water vapor is rare.
Direct observations of GCCN are rare but measurements of sea salt size distributions are available for several locations over the globe. Integration of the measured distri-butions for sizes larger than the chosen cutoff radii of 5 µm and 10 µm gives GCCN concentrations that are compared to the GCCN concentration obtained by ECHAM5.
5
The natural variability of the GCCN is not fully captured in the model because simulated sea salt emissions depend mainly on wind speed and not on other factors like relative humidity, stability, precipitation history and others. The GCCN concentration for the 10 µm cutoff agree much better with the measured concentrations. Furthermore, the concentrations are about ten times lower than for the 5 µm cutoff, which brings them
10
in better agreement with the GCCN concentrations reported byFeingold et al.(1999). Globally, the GCCN are concentrated in the windy regions, namely the storm tracks of the northern and southern hemisphere. Less GCCN are found in calm regions like the tropics and along the west coasts of the continents.
The introduction of the prognostic rain scheme leads to a strong decrease in the
15
TWP compared to ECHAM5-HAM (Lohmann et al., 2007) putting the simulations at the lower end of the observations. To achieve a better agreement with the obser-vations, ECHAM5-RAIN and ECHAM5-GCCN would require a retuning of the cloud microphysics. But relative changes due to the GCCN should be independent of the tuning state of the model, therefore, no retuning was applied in these studies.
20
The incorporation of the GCCN results in rather faint changes in the precipitation. In the global and zonal averages hardly any differences are detectable. The global patterns are zonally redistributed meaning that regions with an increasing precipita-tion rates alternate with regions with decreasing precipitaprecipita-tion rates so that the zonal average does not change. Interestingly, the rather small changes in the large-scale
25
precipitation patterns feed back to the convective precipitation scheme due to changes in the global moisture budget and distribution. The subsequent changes in the con-vective precipitation rates are larger than the changes in the large-scale precipitation rates.
ACPD
7, 14767–14811, 2007 Influence of Giant CCN on warm rain processes R. Posselt and U. Lohmann Title Page Abstract Introduction Conclusions References Tables Figures ◭ ◮ ◭ ◮ Back Close Full Screen / EscPrinter-friendly Version Interactive Discussion The analysis of the diurnal cycles showed that the GCCN change the amount but not
the timing of local precipitation, therefore, changes in the shape of the diurnal cycles are not visible. But even the changes in the amount are rather small. In case of the clean winter cases the shape and amount of the diurnal cycle fits well. The GCCN itself have just little influence but too high GCCN concentrations might result in decreasing
5
precipitation rates. The more polluted summer cases reproduce the diurnal cycle also quite well although ECHAM5 partly overestimates the precipitation rate and the ampli-tude of the diurnal cycle. The summer cases are mostly characterized by convective precipitation. The precipitation rates are, therefore, only indirectly influenced by the GCCN due to changes in the hydrological cycle.
10
Nevertheless, the GCCN change cloud properties such as TWP and Nl. This is either due to changes in the conversion rates or results from the redistribution of con-densed water to rain water. For the simulations with the 10 µm cutoff the changes are not very large but mainly due to physical changes in the conversion rates. The 5 µm cutoff simulations show decreases of TWP and Nl especially over the ocean but this
15
is partly due to the exaggerated transfer of condensed water to the rain class resulting from too high GCCN concentrations. Therefore, the 10 µm cutoff seems to be more ap-propriate to describe the effect of GCCN in the ECHAM5. The main changes between present day and pre-industrial simulations are found in the midlatitudes of the northern hemisphere where the strongest increase in anthropogenic aerosols is observed.
20
The changes in the cloud properties lead to subsequent changes in the radiative budget of the earth. The radiative effect of the GCCN is determined by evaluating the aerosol indirect effect from pre-industrial to present day conditions. GCCN are especially active in the planetary boundary layer influencing mainly the low clouds. Therefore, the impact of the GCCN is mainly visible in the net short-wave radiation
25
budget at TOA that become less negative by 0.15−0.4 W m−2 globally. The global long-wave radiation budget is much less affected but local changes counteract the decreased short-wave budget. Thus, the total net radiative effect at TOA decreases by 0.08−0.27 Wm−2 due to the GCCN meaning that the GCCN partly offset the aerosol
ACPD
7, 14767–14811, 2007 Influence of Giant CCN on warm rain processes R. Posselt and U. Lohmann Title Page Abstract Introduction Conclusions References Tables Figures ◭ ◮ ◭ ◮ Back Close Full Screen / EscPrinter-friendly Version Interactive Discussion indirect effects caused by increased anthropogenic CCN concentrations.
In summary, the incorporation of the GCCN changes the model state, especially the cloud properties like TWP andNl. The precipitation changes only locally but globally the precipitation is unaffected because it is mainly determined by the large-scale forc-ing like available moisture. Changforc-ing the cloud properties leads to a reduction of the
5
aerosol indirect effect and, hence, partly compensating for the increased anthropogenic CCN concentrations.
Further improvements of the ECHAM5-GCCN simulations will include more sophis-ticated numerical treatment of the sedimentation of rain drops in the prognostic rain scheme. The treatment of the GCCN activation should be treated separately to
ac-10
count for the preferred activation of larger CCN. Furthermore, the condensation of water vapor onto the GCCN should be done in a way that the unphysical exaggerated transfer of condensed water into rain for large GCCN concentrations is prevented.
Acknowledgements. The authors thank P. Spichtinger and D. Cziczo (ETH Zurich) for helpful comments and suggestions, P. Stier (Univ. of Oxford) and S. Ferrachat (ETH Zurich) for their
15
support with the ECHAM5-HAM and the Swiss National Supercomputing Centre (CSCS) for computation time.
References
Adler, R. F., Huffman, G. J., Chang, A., Ferraro, R., Xie, P. P., Janowiak, J., Rudolf, B., Schneider, U., Curtis, S., Bolvin, D., Gruber, A., Susskind, J., Arkin, P., and Nelkin, E.:
20
The version-2 Global Precipitation Climatology Project (GPCP) monthly precipitation analy-sis (1979-present), J. Hydrometeorol., 4, 1147–1167, 2003.14779
Andreas, E. L.: A new sea spray generation function for wind speeds up to 32m s−1, J. Phys.
Oceanogr., 28, 2175–2184, 1998.14771
Andreas, E. L., Monahan, E. C., Rouault, M. P., and Smith, S. D.: The spray contribution to
25
net evaporation from the sea - A review of recent progress, Bound.-Layer Meteor., 72, 3–52, 1995. 14770
ACPD
7, 14767–14811, 2007 Influence of Giant CCN on warm rain processes R. Posselt and U. Lohmann Title Page Abstract Introduction Conclusions References Tables Figures ◭ ◮ ◭ ◮ Back Close Full Screen / EscPrinter-friendly Version Interactive Discussion
Bretherton, C. S., Uttal, T., Fairall, C. W., Yuter, S. E., Weller, R. A., Baumgardner, D., Comstock, K., Wood, R., and Raga, G. B.: The EPIC 2001 stratocumulus study, Bull. Amer. Meteorol. Soc., 85, 967–977, 2004. 14776
Chu, D. and Remer, L.: Earth Science Satellite Remote Sensing, chap. MODIS Obser-vation of Aerosol Loading from 2000 to 2004, pp. 92–110, Springer Berlin Heidelberg,
5
doi:10.1007/978-3-540-37293-6 6, 2006.14785
Dentener, F., Kinne, S., Bond, T., Boucher, O., Cofala, J., Generoso, S., Ginoux, P., Gong, S., Hoelzemann, J. J., Ito, A., Marelli, L., Penner, J. E., Putaud, J. P., Textor, C., Schulz, M., van der Werf, G. R., and Wilson, J.: Emissions of primary aerosol and precursor gases in the years 2000 and 1750 prescribed data-sets for AeroCom, Atmos. Chem. Phys., 6, 4321–
10
4344, 2006,
http://www.atmos-chem-phys.net/6/4321/2006/. 14776
Feingold, G., Cotton, W. R., Kreidenweis, S. M., and Davis, J. T.: The impact of giant cloud condensation nuclei on drizzle formation in stratocumulus: Implications for cloud radiative properties, J. Atmos. Sci., 56, 4100–4117, 1999. 14769, 14770, 14772, 14777, 14783,
15
14789,14790
Fitzgerald, J. W.: Marine aerosols – a review, Atmos. Environ., 25, 533–545, 1991.14770
Greenwald, T. J., Stephens, G. L., Vonderhaar, T. H., and Jackson, D. L.: A physical retrieval of cloud liquid water over the global oceans using Special Sensor Microwave Imager (SSM/I) observations, J. Geophys. Res.-Atmos., 98, 18 471–18 488, 1993.14779
20
Guelle, W., Schulz, M., Balkanski, Y., and Dentener, F.: Influence of the source formulation on modeling the atmospheric global distribution of sea salt aerosol, J. Geophys. Res.-Atmos., 106, 27 509–27 524, 2001. 14771
Hahn, C. J., Warren, S. G., and London, J.: Climatological data for clouds over the globe from surface observations, 1982-1991: The total cloud edition, Tech. rep., ORNL/CDIAC-72
25
NDP-026A Oak Ridge National Laboratory, Oak Ridge Tennessee, USA, 1994. 14779
Han, Q. Y., Rossow, W. B., and Lacis, A. A.: Near-global survey of effective droplet radii in liquid water clouds using ISCCP data, J. Clim., 7, 465–497, 1994. 14780
Han, Q. Y., Rossow, W. B., Chou, J., and Welch, R. M.: Global variation of column droplet concentration in low-level clouds, Geophys. Res. Lett., 25, 1419–1422, 1998. 14780
30
Huffman, G. J., Adler, R. F., Arkin, P., Chang, A., Ferraro, R., Gruber, A., Janowiak, J., McNab, A., Rudolf, B., and Schneider, U.: The Global Precipitation Climatology Project (GPCP) Combined Precipitation Dataset, Bull. Amer. Meteorol. Soc., 78, 5–20, 1997. 14779
ACPD
7, 14767–14811, 2007 Influence of Giant CCN on warm rain processes R. Posselt and U. Lohmann Title Page Abstract Introduction Conclusions References Tables Figures ◭ ◮ ◭ ◮ Back Close Full Screen / EscPrinter-friendly Version Interactive Discussion
Johnson, D. B.: The Role of Giant and Ultragiant Aerosol Particles in Warm Rain Initiation, J. Atmos. Sci., 39, 448–460, 1982. 14769,14771
Khairoutdinov, M. and Kogan, Y.: A New Cloud Physics Parameterization in a Large-Eddy Simulation Model of Marine Stratocumulus , Mon. Weather Rev., 128, 229–243, 2000.14774,
14775
5
Kiehl, J. T., Hack, J. J., and Briegleb, B. P.: The simulated earth radiation budget of the na-tional Center for Atmospheric Research Community Climate Modell CCM2 and comparisons with the Earth Radiation Budget Experiment (ERBE), J. Geophys. Res.-Atmos., 99, 20 815– 20 827, 1994.14781
Lewis, E. R. and Schwartz, S. E.: Sea Salt Aerosol Production - Mechanisms, Methods,
Mea-10
surements, and Models, vol. 152 of Geophysical Monograph, American Geopysical Union, 2004. 14770,14771,14781,14782
Lin, H. and Leaitch, R.: Development of an In-Cloud Aerosol Activation Parameterization for Climate Modelling, in: WMO Workshop on Measurements of Cloud Properties for Forecasts of Weather and Climate, Mexico City, June 1997, 1997. 14775
15
Lohmann, U. and Roeckner, E.: Design and performance of a new cloud microphysics scheme developed for the ECHAM general circulation model, Clim. Dyn., 12, 557–572, 1996.14774
Lohmann, U., Stier, P., Hoose, C., Ferrachat, S., Kloster, S., Roeckner, E., and Zhang, J.: Cloud microphysics and aerosol indirect effects in the global climate model ECHAM5-HAM, Atmos. Chem. Phys., 7, 3425–3446, 2007,
20
http://www.atmos-chem-phys.net/7/3425/2007/.14774,14776,14778,14786,14788,14790
Monahan, E. C., Spiel, D. E., and Davidson, K. L.: Ocenaic whitecpas and their role in air-sesa exchange, chap. A model of marine aerosol generation via whitecaps and wave disruption, 167–174, D. Reidel, Norwel, Mass., 1986. 14771
O’Dowd, C. D., Smith, M. H., Consterdine, I. E., and Lowe, J. A.: Marine aerosol, sea-salt, and
25
the marine sulphur cycle: A short review, Atmos. Environ., 31, 73–80, 1997.14770
Reid, J. S., Jonsson, H. H., Smith, M. H., and Smirnov, A.: Evolution of the vertical profile and flux of large sea-salt particles in a coastal zone, J. Geophys. Res.-Atmos., 106, 12 039– 12 053, 2001.14770,14771
Roeckner, E., B ¨auml, G., Bonaventura, L., Brokopf, R., Esch, M., Giorgetta, M., Hagemann,
30
S., Kirchner, I., Kornblueh, L., Manzini, E., Rhodin, A., Schlese, U., Schulzweida, U., and Tompkins: The atmospheric general circulation modell ECHAM5, Part I: Model description, Tech. Rep. 349, Max-Planck-Institute for Meteorology, Hamburg, Germany, 2003. 14774,


![Fig. 6. Column integrated GCCN burden [10 − 6 m − 2 ] for the cuto ff radii 10 µm (upper panel) and 5 µm (lower panel)](https://thumb-eu.123doks.com/thumbv2/123doknet/14785676.598692/39.918.235.491.48.513/column-integrated-gccn-burden-radii-upper-panel-lower.webp)
![Fig. 8. Scatter plot of simulated and measured giant sea salt concentrations [cm −3 ] for a cuto ff radius of 10 µm (upper panel) and 5 µm (lower panel) for di ff erent wind speed ranges.](https://thumb-eu.123doks.com/thumbv2/123doknet/14785676.598692/41.918.207.501.82.522/scatter-simulated-measured-giant-concentrations-radius-upper-ranges.webp)
