HAL Id: tel-00773019
https://tel.archives-ouvertes.fr/tel-00773019
Submitted on 15 Jan 2013HAL is a multi-disciplinary open access archive for the deposit and dissemination of sci-entific research documents, whether they are pub-lished or not. The documents may come from teaching and research institutions in France or abroad, or from public or private research centers.
L’archive ouverte pluridisciplinaire HAL, est destinée au dépôt et à la diffusion de documents scientifiques de niveau recherche, publiés ou non, émanant des établissements d’enseignement et de recherche français ou étrangers, des laboratoires publics ou privés.
Design, modeling, and characterization of innovative
terahertz detectors
Duy Thong Nguyen
To cite this version:
Duy Thong Nguyen. Design, modeling, and characterization of innovative terahertz detectors. Elec-tromagnetism. Université de Grenoble, 2012. English. �tel-00773019�
THÈSE
Pour obtenir le grade de
DOCTEUR DE L’UNIVERSITÉ DE GRENOBLE
Spécialité : Optique et Radiofréquences
Arrêté ministériel : 7 août 2006
Présentée par
Duy Thong NGUYEN
Thèse dirigée par Jean-Louis COUTAZ et codirigée par François SIMOENS
préparée au sein du Laboratoire CEA-Léti dans l'École Doctorale EEATS
Conception, modélisation et
caractérisation de détecteurs
térahertz innovants
Thèse soutenue publiquement le 12 novembre 2012 devant le jury composé de :
Pr. Jean-Louis COUTAZ
Professeur, IMEP-LAHC, Université de Savoie, directeur de thèse
Dr. Gian Piero GALLERANO
Chef du Laboratoire des Sources de Rayonnement, ENEA, Frascati (Italie), rapporteur
Pr. Ronan SAULEAU
Professeur, IETR, Université de Rennes, rapporteur
Dr. François SIMOENS
Responsable du programme stratégique "Imageurs", CEA-LETI Grenoble, encadrant de thèse
Pr. Carlo SIRTORI
UNIVERSITY OF GRENOBLE
Number attributed by library
__________
PhD Thesis
in partial fulfillment to obtain the degree of
DOCTEUR OF PHYSICS
Doctoral Course : Optics & Radiofrequencies
Doctoral School : EEATS (Electronique, Electrotechnique, automatique,
Télécommunications, Signal)
Design, modeling, and characterization of innovative terahertz detectors
Prepared by
NGUYEN Duy Thong
under the direction of Pr. Jean-Louis COUTAZ
at CEA, Leti, Department of Optoelectronics, MINATEC Campus
To be defended on 12 November, 2012 in front of the following examining committee
JURY
Gian Piero GALLERANO PhD, ENA, Italy Referee Ronan SAULEAU Professor, IETR , France Referee Carlo SIRTORI Professor, University of Paris 7, France Examiner François SIMOENS PhD, CEA-Leti, France Supervisor Jean-Louis COUTAZ Professor, University of Grenoble PhD Supervisor
Abstract
Design, modeling, and characterization of innovative terahertz detectors
This PhD thesis aims to establish an electromagnetic modeling of the bolometer at terahertz (THz) range that can facilitate the design of the detector from the uncooled infrared bolometer technology. The envisaged application for the detectors lies in active THz imaging at room temperature. We have studied the optical coupling of a THz antenna-coupled bolometer operating in the range 1 – 5 THz. Simulations in receiving and transmitting modes have been performed to study the optical characteristics of the bolometer. The combination of these two simulation types leads to a powerful toolset to design terahertz bolometers. For the experimental aspect, measurements have been performed by using Fourier-transform technique to study experimentally the electromagnetic behavior of the bolometer. They are
measurement of reflectivity of the focal plane array’s surface and spectral response
measurement. The results of measurement were found to be in good agreement with the simulation. The understanding from the study in this PhD helps us make improvement to the actual detector. Also the design of bolometer for low frequency (850 GHz) has been proposed. This leads to a perspective of using bolometer for terahertz imaging at the frequency where many characteristic of the terahertz radiation are favorable for imaging application.
Key words: Terahertz, antenna-coupled bolometer, electromagnetic simulation,
Fourier-transform spectroscopy, spectral response, terahertz imaging.
Résumé
Conception, modélisation et caractérisation de détecteurs térahertz innovants
Le but de cette thèse est d’établir une modélisation électromagnétique du détecteur
bolométrique térahertz (THz). Ce travail aide à faciliter la conception de bolomètre THz dont la structure est basée sur celle de bolomètre infrarouge à température ambiante. Le contexte
de la thèse est l’imagerie THz active. Nous avons étudié le comportement électromagnétique d’un bolomètre à antenne de bande spectrale 1 – 5 THz. Deux modes de simulation ont été
réalisées μ l’une est en mode de réception et l’autre est d’émission. La combinaison de ces modes de simulation constitue un outil important pour concevoir le bolomètre THz. La technique de spectroscopie par transformée de Fourier a été utilisée pour caractériser expérimentalement le comportement électromagnétique du détecteur. Nous avons mesuré la réflectivité de la surface du plan focal de détecteur ainsi que la réponse spectrale du détecteur. Les deux sont confrontées avec la simulation et elles se trouvent en bon accord. Avec les connaissances obtenues des résultats théorique et mesuré, la recherche aide à améliorer des performances du détecteur actuel. Nous avons aussi proposé un design pour le bolomètre de faible fréquence (850 GHz). Ce dernier ouvre la perspective d’emmener la technologie de
bolomètre d’infrarouge vers la bande sous-térahertz où l’imagerie est beaucoup plus
favorable.
Mots clés : Térahertz, bolomètre à antenne, simulation électromagnétique, spectroscopie par transformée de Fourier, réponse spectrale, imagerie térahertz
TABLE OF CONTENTS
Abstract ... i
Acknowledgements ... iv
Chapter 1 Introduction to THz science & technologies ... 1
1.1 Terahertz domain ... 1
1.1.1 Technological development of THz components and systems ... 1
1.1.2 Features of THz domain ... 2
1.1.3 Applications of THz waves ... 5
1.2 Imaging in the THz domain ... 7
1.2.1 Common specifications of imaging systems ... 7
1.2.2 Other important features of terahertz imaging... 10
1.2.3 Passive imaging vs active imaging ... 13
1.2.4 Context of the PhD work: THz imaging with room-temperature bolometer array ... 17
1.3 Summary ... 19
References ... 20
Chapter 2 Bolometric detectors ... 23
2.1 Principle of bolometer ... 23 2.1.1 Bolometer overview ... 23 2.1.2 Electro-thermal model ... 25 2.1.3 Noise in bolometers ... 29 2.1.4 Figures of merit ... 32 2.2 Summary ... 34 References ... 35
Chapter 3 IR-THz transformation for uncooled bolometer ... 36
3.1 Cryogenic terahertz bolometer ... 36
3.1.1 Antenna-coupled bolometer ... 36
3.1.2 Distributed absorbing element bolometer ... 37
3.2 Uncooled IR Bolometer ... 39
3.2.1 Structure ... 39
3.2.2 Optical coupling ... 41
3.2.3 Thermal insulation ... 41
3.2.4 Heat capacity and thermometer volume ... 45
3.2.5 Response time ... 47
3.3 IR-THz transformation ... 48
3.3.1 Absorbing film design ... 48
3.3.2 Antenna coupled bolometer design ... 50
3.4 Summary ... 52
References ... 53
Chapter 4 Bolometer stack for THz frequency ... 55
4.1 Absorption of metallic thin film structure ... 55
4.1.1 Infinite size film ... 55
4.1.2 Finite size films ... 59
4.2 Bolometer stack for THz wavelength ... 64
4.2.1 Infrared stack ... 64
4.2.2 Optical coupling at THz frequency range ... 67
4.2.3 THz bolometer stack ... 69
4.3 Summary ... 71
References ... 72
Chapter 5 THz bolometer modeling ... 73
5.1.1 Structure ... 73
5.1.2 Figures of merit ... 75
5.2 Antenna-coupled bolometers (THEDEX design) ... 80
5.2.1 Structure ... 80
5.2.2 Figures of merit ... 82
5.2.3 Impedance matching for antenna-coupled bolometer ... 86
5.3 Improved design (Bambolo) ... 92
5.3.1 Structure ... 92
5.3.2 Optimization of optical coupling ... 94
5.3.3 Figures of merit ... 103
5.4 Perspective design for low frequency ... 106
5.4.1 Frequency selective surface ... 106
5.4.2 Implementation in bolometer structure ... 108
5.5 Summary ... 112
References ... 114
Chapter 6 Detector characterization results ... 116
6.1 Optical coupling measurement ... 116
6.1.1 Characterization with a Fourier-transform spectrometer ... 116
6.1.2 Reflectivity ... 119
6.1.3 Spectral response ... 127
6.2 Result of optical coupling measurement ... 135
6.2.1 Reflectivity ... 135
6.2.2 Spectral response ... 143
6.3 Other figures of merit ... 147
6.3.1 Thermal conductance and response time ... 147
6.3.2 Responsivity and sensitivity measurement ... 148
6.4 Examples of THz active imaging with the antenna-coupled bolometer FPA ... 150
6.4.1 Raster scanning imaging ... 150
6.4.2 Real-time imaging with 320× 240 pixel array ... 151
6.5 Summary ... 152
References ... 154
Chapter 7 General conclusion ... 155
7.1 General summary ... 155
7.2 Perspectives ... 157
Vita ... 159
Publications of the author ... 160
Acknowledgements
This work was only possible with the help of many nice people, to whom I am indebted. First and foremost, I would like to express my gratefulness to Professor Jean-Louis Coutaz for doing a great job on supervising my research. Thank you for your support throughout my thesis, from the fruitful discussions on physics at the beginning to the correction during the writing phase.
I am also grateful to Dr. François Simoens who is the co-supervisor of the thesis. Thank you for taking me aboard and providing me the opportunity to work in a very professional and innovative environment as at CEA-LETI. Thank you also for your continuing advice, encouragement and patience.
A special thanks is for Dr. Jean-Louis Ouvrier-Buffet, my colleague at LIR laboratory, for sharing his expertise on the bolometer technology. Also, I would like to take this opportunity to thank all other colleagues at DOPT department: Jérôme Meilhan, Valérie Goudon, Claire Vialle, Lasfargues Gilles, Hamelin Antoine, Lalanne-Dera Jérémy, Gravrand
Olivier…, for their support during three years of thesis.
Last but not least, I would like to express my appreciation to those people outside the academic environment, especially to my family, my friends who supported and encouraged me all throughout these years.
Chapter 1
Introduction to THz science & technologies
The aim of this chapter is to introduce step by step the context of this PhD work. We start by presenting the background of the THz domain: its historical development, its features and the related applications. Then we go into imaging, which is one important sector of the applications of the THz waves. We present the principles of imaging as well as some specific characteristics related to the THz range. Some THz imaging systems in literature, both passive and active, are mentioned in order to demonstrate the perspective of THz imaging in real-life. Finally, we present the concrete context of this PhD thesis, which is the development of detectors for THz active imaging.
1.1 Terahertz domain
The study of electromagnetic waves constitutes a key science in the 20th century. From the radio waves to gamma rays, the whole spectrum has been explored and is nowadays employed for a multitude of applications in everyday life. However, there still exists a spectral range that is poorly explored, that is the terahertz (THz) band. It lies between the infrared and microwave domains. This section presents briefly a history of this science, its characteristic features and perspectives.
Fig. 1.1: Terahertz region is between infrared and microwave domains
1.1.1 Technological development of THz components and systems
The term “TeraHertz” first appeared in the early 1λ70s with the description of “whisker” diodes [1] and of Michelson interferometer [2]. One can see (Fig. 1.1) that this
term is used to describe the upper limit of the radiofrequency (RF) domain or the lower limit of the optical domain.
Technological developments have been hindered because of this intermediate position between the electronic and optical ranges, and still now no devices meet the requirements of mass volume applications.
Since 1970, for decades, the sole niche for THz technology has been high-resolution spectroscopy and remote sensing areas where heterodyne and Fourier transform techniques have allowed astronomers, chemists, Earth, planetary, and space scientists to measure, catalogue, and map thermal emission lines for a wide variety of lightweight molecules [3]. Half of the radiance in our universe is at THz frequencies, and the astronomy science is based on the observation of electromagnetic radiation emitted by the stars, galaxies. Hence observation at THz frequencies plays an important role in astronomy physics and drives the development of detectors whose performances can approach the quantum limit. These include
Schottky barrier diodes, hot electron bolometers (HEBs), superconductor-insulator-superconductor bolometer, etc. Most of them operate at cryogenic temperature.
At the end of the 1980s, THz time domain spectroscopy (THz – TDS) emerged thanks to the availability of femtosecond lasers. The possibility of recording THz images with this system open the way to the so-called T-ray imaging. Many general public applications using T-ray imaging technique, such as medical imaging or especially security screening, bring THz science from the academic and laboratory level period to the public for the first time.
The THz spectrum is seen not as a new domain that brings fundamental physics law or phenomenon, but rather an unexploited region whose characteristic features may constitute interesting applications. Therefore, one of the tendencies of THz technologies is low cost, less bulky and complicated, more application oriented. For the source side, some components that have many (but not all) of these assets are the THz quantum cascade laser (QCL) or solid-state frequency multipliers driven by conventional microwave sources. For detectors side, some uncooled detectors such as Schottky diode, field effect transistor (FET) or uncooled bolometer are being developed. Of course, depending on applications, other components are also developed to fulfil the diversifying needs in the emerging domain.
Today, though few THz (or strictly speaking sub-THz) technologies are being commercialized for applications as screening remote inspection at airport checkpoints, the domain is far from being mastered. On the source side, the lack of high power, compact, low cost sources is still present. Concerning detectors, besides the cryogenic detectors for astronomy that ensure truly high performances but also are very costly and complex, the THz community is still searching low-cost technologies suitable for general public applications. The story of THz does still continue.
1.1.2 Features of THz domain
1.1.2.1 Spectrum
THz technologies have been independently developed by researchers from several different disciplines. In fact, “THz gap” became a common term to describe the gap between microwave and far-infrared spectrum. Still now, THz band does not have any industrial standard definition. In this thesis, we consider the universal definition suggested by [4] in which THz band spans from 0.1 THz to 10 THz. One can see that this band overlaps neighboring spectral regions such as millimeter-wave, the submillimeter-wave, and the far-infrared (FIR) listed in table 1.1. These bands can also be distinguished with respect to technologies. Millimeter wave emitters and sensors are derived from microwave solid-state devices whereas, traditionally, far-IR applications rely on optical and thermal devices.
Frequency Band Frequency Wavelength
Millimeter wave 30 – 300 GHz 1 – 10 mm Sub-millimeter wave 0.3 – 3 THz 0.1 – 1 mm Far-infrared ≈ 1.2 – ≈ 10 THz 35 – 300 m
Terahertz 0.1 – 10 THz 30 m – 3 mm
Table 1.1: Frequency band definitions of terahertz domain. Let us take the frequency of 1 THz to see its conversions:
Frequencyμ = 1 THz = 1000 GHz, Periodμ = 1/ = 1 ps,
Wavelengthμ = c/ = 0.3 mm = 300 m, Wavenumber: k = 1/ = 33.3 cm-1
,
Photon energy: h = 4.14 meV, Temperature: T = h /kB = 48 K,
where c is the speed of light in vacuum, h is Plank’s constant, and kB is Boltzmann’s constant.
1.1.2.2 Properties of terahertz radiation
The most fabulous characteristic of THz radiation is the capability of THz wave to go through non-polar and non-metallic materials such as paper, plastic, cloth, dry wood and ceramics that are usually opaque at optical wavelengths. This property comes from specific interactions between THz radiation and matter. The THz photon energy is low and as a consequence, the THz radiation can only excite low energy resonances in matter. Typically, THz resonances in matter are related to roto-vibrational modes of gas molecules, to collective oscillations (phonons), to alignment of dipole in polar molecule liquid, or to the excitation of free charge in metal and doped semiconductor. Phonon resonances in dielectrics are generally above a few THz, thus most of dielectrics do not exhibit these resonance modes in the lower part of the THz range; therefore dielectrics do not absorb much THz radiation.
For metals, the THz wave behaves just like any electromagnetic waves below the plasma frequency of the metal. They can excite free electrons and thus create a high-frequency current, since THz radiation, though higher in high-frequency than microwave, is still so small as compared to the plasma frequency (which is at the range of UV-ray). More concretely, wavelength that corresponds to the plasma frequency is in the range 100 ~ 300 nm when compared to the typical wavelength of 300 m of THz band. The skin depth in a good metal, like copper, is about 90 nm at 1 THz. Therefore common metals such as copper, aluminum, iron, behave as perfect conductors for THz radiation, thus THz radiation is reflected almost completely on metal.
One should also point out that since the water molecules are polar, water absorbs strongly THz radiation. As a consequence, since atmosphere contains water vapor, its transmission shows strong absorption lines and consequently atmosphere is poorly transparent in the upper part of the THz range when compared to infrared or visible light [5]. On the other hand, the only advantage of THz wave related to free-space propagation is that the THz wave is less scattered by dust or fog (because the THz wavelength is much larger than infrared or visible wavelength).
A last critical feature of THz radiation stands in its low level of photon energy that makes them non-ionizing. Until today, there is no harm reported by using THz on biological molecules or cells. However, still some additional studies are being led to verify the inoffensive effects of THz radiation on human cells.
1.1.2.3 Terahertz gap and devices
The THz region is the last exploited spectrum and exhibits a gap of technology between microwave and optical domains. For microwave and also radio frequency – RF –regions, the devices are basically electronic devices. Their operation is based on the generation, transmission and processing of a high-frequency current. The electronic devices have started
with low frequency, in the range of MHz (RF domain), and have extended to higher frequency, in the range of GHz (microwave). At higher frequency, i.e. in the THz range, the performance of these devices degrades dramatically, thus very little devices are able to function at these frequencies. One of the reasons is that the attenuation of the signal is very high at THz range due to the propagation loss of propagation of the signal. Another reason originates in the effect of parasitic elements such as capacitance or inductance, which increases strongly at THz range. Thus we can say that the THz range is beyond the upper limits of today microwave and RF industry.
For optical or optronic devices such as lasers or photodiodes, the THz frequency range stands at the lower spectral boundary. The corresponding photon energy of THz wave is very low, of the order of meVs. This energy level is small when compared to the band gap energy of semiconductor materials, which takes a value ~ 100 – 1000 times bigger (~ eV). This makes the interband photon-electron interaction in semi-conductor less efficient or even impossible. Besides, the thermal excitation at room-temperature has the same level of energy as the photon energy, and hence it dominates the photo-conduction processes; this phenomenon implies that the thermal noise in optical devices in the THz regime is a big issue. The devices need to be cooled to low (even cryogenic) temperatures.
These limitations explain the origin of this so-called THz gap. Recently, on both electronic and optical sides, technologies are emerging and this gap is being progressively fulfilled. Though there are still big technical challenges, some interesting applications in THz domain are beginning to be demonstrated. Some available techniques and devices for the generation and detection of the terahertz wave are presented as following.
Sources
Thermal source (blackbody): the radiation is large band and incoherent, and the power
in terahertz range is very weak. The typical power range is pW at 0.1 THz and W at 10 THz.
Narrow band and coherent source: multiplier frequency source such as Schottky diode
or laser such as quantum cascade laser (QCL). Today, many Schottky-diode based multiplier sources work in the range of 0.2–1.9 THz that produce a THz power of
about 50 mW at 200 GHz and still 10 W at 1.λ THz [6]. Above 2 THz, the QCL
source is very promising since it delivers a high power, in the range of mW [7]. The cooling requirement and the weak tenability of this source are the main drawback.
Other kinds of source: some photoconductive switching techniques can generate
terahertz pulse that is used broadly in time domain spectroscopy (TDS) system.
BWO, molecular lasers, optical rectification…
Detector
Bolometers: The superconducting bolometer such as
superconductor-insulator-superconductor (SIS) or hot-electron bolometer (HEB) can perform both direct and heterodyne detection. These detectors are extremely sensitive. However they require cryogenic operation and are very costly.
Schottky diode, HEMT transistor: these devices can operate at room temperature and
perform heterodyne detection thus highly sensitive. The electronics equipped with these detectors require expensive low noise amplification. These devices bandwidth is limited to the sub-THz region.
Field effect transistor (FET) and uncooled bolometer: they operate at room
temperature with direct detection. The sensitivity is less than Schottky diode or HEMT transistor, however they are relatively cheap.
Electro-optics, pyroelectrics, photoconduction…
1.1.3 Applications of THz waves
The applications in terahertz domain are quite various: they began from the astronomy and earth science and today they spread to the general public applications. Some prospective sectors include medical imaging, wireless communication, security screening and non-destructive testing.
Astronomy and earth science
In astronomy, terahertz spectroscopy is used to study the structure and forming as well as the nature of universe. Results from the NASA Cosmic Background Explorer (COBE) Diffuse Infrared Background Experiment (DIRBE) and examination of the spectral energy distributions in observable galaxies, indicate that approximately one-half of the total luminosity and 98% of the photons emitted since the Big Bang fall into the submillimeter and far-IR. Thus submillimeter (and therefore teraherz) detectors are true probes into the early universe [3].
THz technology is also now important in the environmental monitoring of Earth. The major objectives are to obtain information about the upper atmosphere (stratosphere,
ionosphere, troposphere…) physico-chemistry to better understand global warming, to
quantify aspects of how the atmospheric composition affects climate and to study aspects of pollution in the upper troposphere [8]. For example, THz technology may help at detecting and mapping ozone in the atmosphere.
Medical Imaging
Due to their low photon energies and non-ionizing character, THz waves are promising candidate for applications in the medical field. They are not expected to damage DNA or tissue molecules as X-rays can do. Even though THz waves cannot penetrate the entire body, many applications are possible. For instance, the detection of skin cancers (in-vivo), breast cancer (ex-vivo), skin burns, or osteoarthritis in knee joints has been demonstrated with reflection imaging techniques [9], [10]. THz time-domain spectroscopy (THz-TDS) could ultimately be used for in-vivo DNA analysis due to rotational and vibrational resonances of this molecule.
Communication
As a rule of thumb, due to the demand for ever increasing data rates, the wireless communication tends to operate at higher frequency. The wireless communications above 100 GHz are under development and therefore, in a mid-term future, THz communications would be in use, especially as HEMT transistors and other ultrafast electronics components are now able to operate at up to 500 GHz or beyond.
Two constraints that can cause limitations to terahertz wireless communication are atmospheric attenuation and propagation characteristics of terahertz wave. The first one restricts terahertz communication to short distance or inter-satellite communication while the propagation of terahertz wave, especially the scattering property leads to the line-of-sight communication. The line-of-sight problem is more serious when operating at higher frequency. Communication at infrared or visible range also exhibits line-of-sight concern. However, since these technologies do not suffer atmospheric attenuation, they may be more attractive than terahertz. In the near future, perhaps communication at 110 – 120 GHz, i.e. the low frequency part of terahertz band is commercialized. A wireless link of a few hundred meters at 120 GHz of 10 Gb/s data transmission is already reported in [11].
Two constraints that can cause limitations to THz wireless communication are atmospheric attenuation and propagation characteristics of THz wave. The first one restricts THz communication to short distance (in-building) or inter-satellite communication while the propagation of THz wave, especially the scattering property leads to the line-of-sight communication. The line-of-sight problem is more serious when operating at higher frequency. Communication at infrared or visible range also exhibits line-of-sight concern. However, since these technologies do not suffer atmospheric attenuation, they may be more attractive than THz. However, commercial 100-GHz wireless links are expected soon and researches are performed at 300-GHz carrier frequency [12].
Security screening
Security screening is one prominent application of the THz domain. The high transmission of THz wave in fabric material helps, through THz imaging, detecting metallic weapons concealed under clothes [13]. The active THz imaging has an advantage over X-ray technique (backscatter X-ray system) in the sense that THz wave, unlike X-ray, is not a ionizing radiation. The passive THz imaging is completely safe. Although some THz cameras for security screening are available on the market (Thruvision, Qinetiq), the research is still carried on in laboratories to find a cost-effective imaging system to bring the technology not only to airport but also in another high transportation places, such as train and metro stations.
Spectroscopy to detect drugs or explosives can also be used in combination with imaging in a security screening system. Some common explosives (RDX, TNT, HMX…) show strong absorption peaks in THz range that can be used as fingerprints to identify the material. Originally, TDS or Fourier-transform infrared (FT-IR) spectroscopy are used to characterize the materials in transmission mode [14]. Since then, many efforts are devoted to bring this explosive identification technique to a simpler and more realistic level. In [15], the specular reflection scheme is used in a FTIR spectroscopic system to identify the explosive and also to image the explosive. Diffuse reflection spectroscopy of explosives is also studied and has a potential for standoff detection and identification of explosives concealed in packages or under clothing [16]. A very good review of THz spectroscopy and imaging for defense and security applications can be found in [17].
Non-destructive testing
The identification of defects in the Columbia space shuttle foam insulation led to understand why this shuttle was destroyed during re-entry in the Earth atmosphere and thus constitutes a prominent example of using THz technology for non-destructive testing. It is difficult to locate defects in low-density, low-absorption medium using other nondestructive inspection techniques such as X-rays or ultrasound. In this case, the THz technique can be useful because THz time-of-flight tomography is sensitive in detecting small changes in optical properties of media such as the refractive index and absorption coefficient [18]. In addition, THz analysis can be employed for low molecular weight materials, which is not the case of X-ray techniques.
Non-destructive testing may find applications in pharmacy or semiconductor industry as a technique for quality control. Reference [19] gives an example in which THz imaging is used to detect damaged MOSFETs transistors, showing potential applications for fault analysis in large-scale-integration (LSI) circuit. Moreover, historical artwork or fine art analysis is also a promising application for THz non-destructive testing. THz tomographic imaging helps analyzing the structure of sealed pottery [20]. Also, historical paintings reveal a lot of information by using THz imaging and spectroscopy [21], [22].
1.2 Imaging in the THz domain
Imaging is a prominent application of the THz domain thanks to the unique characteristics of THz radiation, in particular the transparency through clothing and plastic packaging. In this PhD work, we study THz uncooled bolometers for active imaging, thus we are only interested on the detector side. Nevertheless some characteristics of the detector are related strongly to the specification of the imaging system. Thus we present here the principle of (geometrical) imaging that determines some specifications of detector, such as the elementary detector size or the size of an array of detectors. Also other characteristics related to the THz range are presented. They also may affect the detector specifications, mostly its working frequency.
1.2.1 Common specifications of imaging systems
Fig. 1.2: Simple scheme of imaging system
Common imaging systems consist of an optical system (lens, mirror, etc.) and an imager, usually an array of detectors, set at the focal plane. The optical system has a diameter D and a focal length foptics. The scene is at a distance L far from the optics. The optics forms the image ab at the image plane of an object AB in the scene. If L is large enough when compared to foptics, the image plane is very close to the focal plane, i.e. l foptics.
1.2.1.1 Resolution
We desire to distinguish 2 points A and B of the object, separated by AB. As A and B
are far from the optical system, the difference of incoming angle, for rays emitted respectively by A and B, is
L AB
. (1.1)
The Rayleigh's criterion states that there exists a minimum angle beyond which the image is hardly resolved due to the diffraction that occurs at the entrance of the optics. This minimum angle is angular resolution of the imaging system, which is related to the wavelength and parameter of optics by:
D
min 1.22 . (1.2)
At the detector, assuming the scene is far from the optics, the size of the image is
optics
f
ab . Thus the minimum distance between two resolved image points a and b is:
optics
f D
abmin 1.22 . (1.3)
This spatial resolution has some impacts on detector pitch and detector size. Detector pitch is the distance between two pixels in an array of detectors. One can see that this distance should be at least equal to the spatial resolution because even if it is smaller, the resolution of the image obtained by the detector is not better than this limit. The detector size should be at least equal to the spatial resolution because it can receive more incoming flux. The diameter and focal length of the optical system is related to its f-number (F ) by the expression: no
D f
Fno optics. (1.4)
Thus the spatial resolution can be rewritten as:
no
F
abmin 1.22 . (1.5)
The typical minimum value, limited by technology, of f-number is 1; below this value some other phenomena such as aberration will degrade the quality of the image. Thus one can see that, in the best case (Fno=1) the typical spatial resolution is 122 m at 3 THz ( = 100 m),
366 m at 1 THz ( = 300 m), and becomes 1.220 mm at 300 GHz ( = 1 mm).
At the scene side, the angular resolution also sets a limit for the spatial resolution of the scene. This limit is:
L D L
ABmin min 1.22 . (1.6)
In visible or infrared imaging, the scene resolution is high enough so that the image is easy to be understood (interpreted). In millimeter-wave or terahertz imaging, since the wavelength is much longer, the scene resolution is very important to the capability of precise interpretation of the image. From the equation 2.6, one can see that the desired scene resolution imposes a constraint to the diameter of the optics of the imaging system:
min 22 . 1 AB L D . (1.7)
We give an simple example in which the imaging range (the distance L ) is 2 m, the desired scene resolution is 1 cm. From the above equation, we can deduce easily that the diameter of the optical system must be at least 2.44 cm if the imaging system operates at 3 THz. The value becomes to 7.32 cm if the frequency is 1 THz and 24.4 cm if the system works at 300 GHz. If the scene is at 10 m, all these values must be multiplied by 5. Thus at 300 GHz, we end up with a large and heavy optics of about 75 cm of diameter.
1.2.1.2 Angle of view and field of view
The angle of view is also a very important parameter of the imaging system. It describes the angular extent of a given scene that is imaged by the array of detector. In Fig. 1.3, we see that when the array of detector is located at the image plane, the part of the image that is outside of the area of the detector is not detected. Thus the size of array of detectors ldetector
imposes a maximum angle of view, which is
optics detector f l 2 arctan 2 max . (1.8)
Fig. 1.3: Angle of view is determined by optics and size of array of detectors
The field of view (FOV) is the size of the scene whose image has the size of the detector array. For moderate values of max, the FOV obeys the simple following expression:
optics detector f l L L
FOV tanmax . (1.9)
In the THz domain, there are not many detectors whose total size is so large. We will take the size of the array of detectors studied in this PhD work as an example. The detector has a length of 16 mm and will operate at 3 THz. We consider the case f-number = 1 so that the image quality is not degraded much by aberration. If the desired resolution of the scene is 1 cm at 2 m range, the diameter of optics is 2.44 cm as calculated previously. Since f-number = 1, we deduce that the focal length is also equal to 2.44 cm. The angle of view in this case is 36o and the FOV, at 2 m, is 1.33 m. The same reasoning leads to 12o if the same detector operates at 1 THz, and thus FOV = 44 cm only.
1.2.1.3 Incident angle
The incident angle of the rays reaching the array of detectors is not the same for the pixels at the center or at the border of the array. Let us consider rays coming from the center of the scene, located on the optical axis. On the optical axis, the incident angle is zero, but it increases to its maximum value at the edge position, which is equal to half of the angle of view.
max max _ 2 1 incident . (1.10)
Due to the effect of the incident angle, the detected signal of the pixel at center is in general higher than at the edge. However, this effect can be corrected by image processing to
obtain the “homogeneous” image, as long as the signal to noise ratio is good enough.
1.2.2 Other important features of terahertz imaging
1.2.2.1 Atmospheric transmission
The atmospheric transmission is one of the biggest concerns for THz imaging. We can see clearly in Fig. 1.4 that the atmospheric attenuation of THz domain is much more severe than in the other spectral regions, such as millimeter, infrared, and visible regions. This imposes that THz imaging must be short-range when compared to imaging in the other domains. In the visible range, light is still strong enough to be detected without difficulty after propagating 70~80 km. Thus infrared imaging can attain a range of several tens of kilometers. Imaging in the range of kilometer is very challenging, if not impossible at THz range.
Fig. 1.4: Atmospheric attenuation from millimeter to visible range [5]
The attenuation of THz radiation depends strongly on the density of the vapor in atmosphere. Thus the humidity has a high impact on the atmospheric transmission. The measurement in humid condition weather (summer) shows a large difference when compared to dry weather (winter).
We should examine more concretely the problem to find out which transmission windows should be used in THz imaging. Fig. 1.5 depicts the atmospheric attenuation (dB/km) from 10 GHz to 10 THz, taken from [23]. The curve above exhibits sharp peaks (mostly water vapor absorption lines) and valleys between these peaks. These valleys define the transmission windows of the atmosphere, which should be used in imaging system to mitigate the loss due to propagation of THz wave. The attenuation increases by two orders of magnitude from 100 GHz to 1 THz. From 1 to 10 THz, the attenuation continues to increase with roughly one order of magnitude. Thus, the THz imaging is more favorable at low frequency than at high frequency in respect to the loss of signal due to the atmospheric attenuation.
Fig. 1.5: Atmospheric attenuation (dB/km) from 10 GHz to 10 THz
Several transmission windows can be defined in the range 0.2 – 1 THz. Reference [24] suggests 6 transmission windows within this range. It should be noted that the value of atmospheric attenuation given here is related to the experimental condition during measurement. The experiment has been performed in laboratory, with a reported humidity of 51 %. At other weather condition, the absolute value may change but the tendency of atmospheric attenuation for different frequency still remains.
Window #1 #2 #3 #4 #5 #6
Frequency (THz) 0.21 0.35 0.41 0.68 0.85 0.93 Power attenuation (dB/km) 7 21 28 72 92 148
Table 1.2: Transmission window in the range 0.2 – 1 THz as suggested by [24].
Fig. 1.6: Atmospheric attenuation (dB/km) at different weather conditions from 0.1 to 1 THz
Thermal detectors as pyro-electric or Golay cells can access the whole THz range. In principle, the bolometer is also able to detect the whole THz range. However, the performance of each type of bolometers varies strongly with the spectral range. Other kinds of detectors, such as monolithic microwave integrated circuit (MMIC) detector, Schottky diode or field effect transistor (FET), have a much more limited bandwidth. MMIC detectors operate at 35
and 94 GHz, thus almost outside the THz band. FET can operate below 1 THz. Their performance degrades dramatically at higher frequencies.
1.2.2.2 Transmission through clothing
Transmission through clothing is a critical feature of THz imaging. Reference [25] gives the transmission in the THz range for several common cloth materials, such as wool, linen, leather, silk, nylon, etc. All samples are transparent at millimeter-wave frequencies (up to 300 GHz) based on a 3 dB criterion, but became progressively opaque at higher frequencies in a highly sample-dependent manner. In general, the transmission of thin sheet of cloth in THz range is quite high, which allows imaging through clothing to detect concealed weapons.
Fig. 1.7: Transmission through some common clothing materials [25].
The attenuation when propagating through clothing depends on the cloth materials, but also on the geometry of the textile. Thus the attenuation varies strongly with each type of clothing, making the phenomenon difficult to be generalized. However, in general, we can say that the attenuation through clothing such as nylon, silk, cotton is less than other materials, such as linen, leather, and denim. The table below presents the detailed properties of the clothing materials, which is reproduced from the data in [25].
Material Thickness (mm) Density (kg/m3) -3dB frequency (THz) Attenuation at 1 THz (dB) Wool 2.2 214 0.35 11.0 Linen 1.1 509 0.35 8.0 Leather 0.75 813 0.40 10.0 Denim 0.96 490 0.50 6.5 Naugahyde 0.65 800 0.70 5.5 Silk 0.36 256 1.0 3.0 Nylon 0.19 379 1.0 3.0
Rayon 0.15 733 >1 2.5 Table 1.3: Properties of some common clothing materials
The attenuation due to the propagation through the clothing exhibits a roughly similar tendency as the atmospheric attenuation in a sense that it increases with frequency. Propagation through the clothing is the most important attenuation mechanism in the close-remote THz imaging system. In terms of power budget, the THz imaging is more favorable at low frequency than at high frequency.
1.2.3 Passive imaging vs active imaging
THz imaging exists in both passive and active types. Each type exhibits advantages as well as disadvantages, which depends strongly on the desired application. Although some THz systems (both passive and active) have been commercialized, the research in the field is still extending to find a more attractive trade-off between cost and performance.
1.2.3.1 Passive imaging
In passive imaging, detector receives the optical flux that is radiated naturally from the scene. The natural radiation of the scene is the thermal radiation and shares many
characteristics with the radiation of a blackbody whose radiance is described by the Planck’s
law: 3 , ) 1 ( 2 ) , ( c e hc T L T k h bb B . (1.11)
where is the optical frequency, k the Boltzmann constant, c the light velocity in vacuum B and T the temperature of the blackbody. At room temperature and in the THz range, the above expression tends towards the Rayleigh-Jeans law:
2 , ( , ) 2 c T k T Lbb B . (1.12)
Thus in the THz range the luminance varies linearly with temperature. We employ a simple calculation to evaluate the power of optical flux in this range.
Supposing that the optics of the THz imaging system is characterized by a f-number
no
F . The detector operate at central frequency center (wavelength: center) and has a bandwidth
BW. In the diffraction-limited case, the detector has the size of the Airy-disk whose radius follows the Rayleigh's criterion:
no center optics center Airy f F D r 1.22 0.61 2 1 . (1.13)
Thus, the area of the detector is:
2 2 2 2 61 . 0 center no Airy detector r F A . (1.14)
The expression for optical power absorbed within the detector with area Adetector and absorption rate due to a distant blackbody target with radiance L can be found in some bb textbook, such as [26]:
BW v bb no detector L d F A Q 2 () , 4 1 . (1.15) The quantity
BW v bb d L ( ) , represents the radiance absorbed by detector, which depends on
the performance of source and detector. For a narrow band system, this quantity can be approximated as: BW L d L bb center BW v bb ( ) ) ( , ,
. (1.16)By replacing (1.12) into (1.16), we obtain:
BW c T k d L center B BW v bb 2 , 2 ) (
. (1.17)Thus, the optical power in (1.15) becomes:
BW c T k F A Q center B no detector 2 2 2 4 1 . (1.18)
Finally, be replacing Adetector by (1.14) in the above equation, we have:
BW c T k F F Q center B no no center 2 2 2 2 2 2 4 1 61 . 0 . (1.19)
Since the wavelength center and the frequency center is related by the equation:
center center
c
. (1.20)
The expression in (1.19) can be reduced to
BW T k F F Q B no no 2 4 1 61 . 0 2 2 2 2 . (1.21)
In the best practical case, f-number of optics is equal to 1. Supposing also that the detector assures a high absorption rate 80 %, the numerical calculation of the above expression gives:
BW T k BW T k Q 21. B B . (1.22)
We can see the order of magnitude of the absorbed power at THz range at room temperature is kBTBW. For a 100 GHz bandwidth detection system watching an object at room temperature, the power absorbed by a pixel is ~ 400 pW. However, the image is formed by the power difference between pixels (contrast of the scene), not by the absolute power. The power difference between an object at T and another one at TT is:
BW T k Q B
. (1.23)
This power contrast for an object at 300 K and another one at 300 K + 0.1 K is ~ 0.14 pW. This range of power is the biggest challenge of THz imaging because it requires a highly sensitive detector. To detect this level of power, in general heterodyne detection is employed. In the case of direct detection, the detector usually operates at a low temperature. However, for such system, complexity or high-cost are the inherent disadvantages.
Fig. 1.8: Passive imaging at 94 GHz from QinetiQ [13]
Some prominent examples of terahertz passive imaging can be mentioned. The image in Fig. 1.8 is from the company QinetiQ and shows a man hiding a knife in a newspaper [13]. QinetiQ does not disclose details of the used imaging system, but it is likely that Schottky diode based detectors operating at microwave frequencies (f = 94 GHz) have been applied.
Fig. 1.9: Passive imaging with superconducting bolometer at NIST & VTT
Passive imaging can also be performed with superconducting bolometer that operates at cryogenic temperature. Fig. 1.9 is a raw passive image of a person carrying concealed weapons (ceramic knife on the chest and handgun on bottom) taken by raster-scanning a module of 8 pixels. Grossman (NIST, USA) and Luukanen (VTT, Finland) have dedicated a lot of works to bring the superconducting bolometer technology to the general public
application, which is, in this case, security screening [27], [28]. The detector in use is a superconducting bolometer that has spectral range of 0.1 – 1.2 THz and operates at ~ 4 K. A recent improvement includes the development of a linear array of 64 pixels [29].
This result seems prospective for security screening high-end application: the scene scenario is realistic and the image quality is good enough to detect the concealed weapon. The drawback of the system is in the cryogenic requirement.
Institute Ipht-Jena (Germany) also develops a passive THz imaging system based on superconducting bolometer [30]. The system uses an array of 20 superconducting transition-edge sensors operated at a temperature of 450 to 650 mK, and a closed-cycle cryorefrigerator. The main figures of the system include: a frequency band of 350±40 GHz, an object distance of 7 to 10 m, a circular field of view of 1.05 m diameter, and a spatial resolution in the image center of 2 cm at 8.5 m distance, a noise equivalent temperature difference of 0.1 to 0.4 K, and a maximum frame rate of 10 Hz. Like imaging system at NIST & VTT, this system requires cryogenic operation. The closed-cycle cryorefrigerator seems the most favorable cooling system for such case thanks to its compactness.
1.2.3.2 Active imaging
Active imaging refers to the technique of illuminating the target with a source of radiation, and then measuring the reflected (scattered) or transmitted radiation. The technique has both advantages and disadvantages when compared to the passive imaging.
In an active imaging scenario, strong scene illumination can overcome the low power contrast of passive detection. Also, the frequency of the radiation can be chosen to match with the system requirements. For example, high frequency should be used where spatial resolution is the main requirement. Therefore, the imaging system is more flexible.
Penetration through thick clothing can be also accomplished by increasing the transmitting power. Unlike passive detectors, active transceivers will confront no fundamental detection sensitivity limit determined by a scene thermal background radiation; a very high signal-to-noise ratio (SNR) can be achieved given a strong enough illumination source. In reality, compact solid-state sources can typically only generate about ~1 mW up to ~1 THz giving an upper limit to the radiation penetrating ability.
Fig. 1.10: 2D image and 3D image obtained by heterodyne detection at JPL [31]
One of the biggest disadvantages of the active imaging is that the obtained image has large signal clutter and speckle caused by a scene with a diversity of angles of incidence, surface roughness, and layers of concealing clothing. This is particularly true for active THz through-clothes imagers that rely on coherent illumination and detection [32]. We can say the
image is less “natural” than with the passive imaging. Some techniques such as frequency
Laboratory, NASA) can solve the issue. However, this approach also increases the complexity of the imaging system.
Another problem for active imaging is perhaps the health concern related to illumination. As mentioned earlier, until now, there is no harm reported by using THz on biological molecules or cells. However, this problem should be studied more deeply before the use of active imaging in large-scale.
A prominent example of active imaging is high performance heterodyne detection system using Schottky diode as mixer developed at the JPL [31]. The system allows 3D imaging with sub-centimeter resolution at a stand-off distance of 4 to 25 m with the acquisition time of a few minutes. In Fig. 1.10, we can see that the 3D image is easier to interpret than the usual 2D image.
Fig. 1.11: a): Threat need to be detected; b) and c): Detection by terahertz active imaging
A recent development includes the second-generation 0.67 THz imaging radar capable of imaging a person torso (50×50 cm) in 5 seconds, with 1 cm-scale resolution, at a standoff range of 25 m [32]. This represents an improvement in imaging speed and standoff range by factors of about 30 and 6, respectively.
This system is certainly suited for high-end applications where stand-off detection is needed. It is however also very complex and expensive. Adding a few pixels is complicated and multiplies the system costs.
1.2.4 Context of the PhD work: THz imaging with room-temperature
bolometer array
Bolometer is one type of thermal sensors that detect electromagnetic radiation through a photo-induced variation of the device temperature. In a bolometer, the temperature variation is sensed by a thermo-resistor, i.e. the resistance value changes in function of temperature.
The bolometer studied in this work derives from the uncooled infrared bolometer, which is employed in passive imaging at mid-infrared range [8 – 14 m]. Although the spectral response of the detector is optimized for mid-infrared range, the detector can detect terahertz wave, provided that the radiation intensity is high enough.
The sub-pW power range involved passive imaging is well beyond the sensitivity of the present state-of-the-art uncooled bolometer. For example, reference [33] reported that the commercial uncooled infrared bolometer requires a minimum power of 320 pW at 4.3 THz. The prototype of uncooled terahertz bolometer [34], [35] requires the minimum power in the range ~ 50 pW. Thus the passive imaging with uncooled bolometer is not realistic.
Fig. 1.12: Demonstration of terahertz imaging with uncooled bolometer [33]
The possibility of using bolometer as detector for active THz imaging was first demonstrated experimentally at MIT [36], [33]. In these works, QCL sources at 2.52 THz delivering 10 mW and at 4.3 THz (50 mW) have been employed. The detector is a commercial uncooled infrared bolometer for the mid-infrared range. The active THz imaging system can record video films at the rate of 20–60 frames/s with a signal to noise ratio in the range 13 ~ 25 dB.
The demonstration by the MIT group has encouraged many other institutes to develop uncooled THz bolometer based on the well-mastered infrared bolometer technology. These institutes include NEC from Japan [34] and CEA-Leti from France [37], [35]. The work presented in this PhD thesis is in the context of the development of uncooled THz bolometer at CEA-Leti.
The first part of the work was devoted to design, fabricate, and characterize a bolometer that has spectral response around ~3 THz. This work was performed in the framework of an active spectroscopy-imaging project named THEDEX. The project aims at two objectives:
Active imaging for security screening: detection of concealed weapons, such as
handgun or metallic knife,
Spectroscopy: detection of explosives such as TNT, RDX, PETN.
The spectral range of the THEDEX bolometer sensitivity was choosen as 2 – 5 THz. This selection derives from the following reasons:
Trade-off between imaging and spectroscopy: Although atmospheric transmission and
transmission through clothing suggest that THz imaging should be performed at low frequency (f < 1 THz), this spectral range is less favorable for spectroscopic detection of explosives. Many common explosives TND, RDX, and PETN exhibit strong absorption lines over 1 THz [38], which facilitates the explosive identification in this range.
Availability of high power source: the project makes use of QCL sources that can
deliver a power in the mW range over 1.7 THz.
Availability of detector: we have modified the design of the infrared bolometer to
optimize their spectral response around ~3 THz. Presently, this technological optimization is easier than for the sub-THz range.
High resolution: working at high frequency helps getting a good spatial resolution of
the scene, which is important for interpreting the image.
However, the range 2 – 5 THz also undergoes many attenuation due to the propagation of THz wave though atmosphere and clothing. The whole frequency selection trade-off is
really challenging to characterize precisely each aspect. The development of the bolometer in a concrete project (THEDEX) helps us to evaluate the perspective of uncooled bolometers in THz imaging.
In the second part of my work, the knowledge and experience obtained from the development of the 3-THz bolometer will help us to optimize the design of a low frequency (sub-THz) bolometer, which is more adapted to imaging.
1.3 Summary
In the first section of this introductory chapter we gave a short historical overview of THz domain. THz science and technology has started from the niche spectroscopy and remote sensing application in astronomy and extends progressively to more general public application. Then THz spectrum is defined and some prominent properties of the THz radiation have been presented. They include: high transparency through dielectric material, good reflection on metal, high absorption in water, non-ionizing radiation. With its original features, the domain is very promising for plenty of application, such as imaging and sensing, communication, etc.
The general context of this PhD is terahertz imaging, which is one of the most attractive applications of THz waves. Principle of imaging has been presented, followed by the examination of some characteristic related to the THz domain. These characteristics are atmospheric attenuation and transmission through clothing. Some THz imaging systems in literature, both passive and active, were mentioned in order to demonstrate the perspective of THz imaging in real-life. Passive imaging requires highly sensitive detector. Such detectors generally make the imaging system quite complex and high-cost. Active imaging employs a combination between source and detector in which the detector performance can be less demanding by using a powerful source. Finally, we present the concrete context of this PhD, which is the development of uncooled bolometer for THz active imaging.
References
[1] A. J. Kerecman, “The Tungsten - P Type Silicon Point Contact Diode,” in Microwave Symposium, 1973 IEEE G-MTT International, 1973, pp. 30 –34.
[2] J. W. Fleming, “High-Resolution Submillimeter-Wave Fourier-Transform Spectrometry
of Gases,” Microwave Theory and Techniques, IEEE Transactions on, vol. 22, no. 12, pp.
1023 – 1025, Dec. 1974.
[3] P. H. Siegel, “Terahertz technology,” Microwave Theory and Techniques, IEEE Transactions on, vol. 50, no. 3, pp. 910 –928, Mar. 2002.
[4] Y.-S. Lee, Principles of Terahertz Science and Technology. Springer, 2008.
[5] L. Yujiri, M. Shoucri, and P. Moffa, “Passive millimeter wave imaging,” Microwave Magazine, IEEE, vol. 4, no. 3, pp. 39 – 50, Sep. 2003.
[6] G. Chattopadhyay, “Technology, Capabilities, and Performance of Low Power Terahertz
Sources,” Terahertz Science and Technology, IEEE Transactions on, vol. 1, no. 1, pp. 33 –53, Sep. 2011.
[7] J. R. Gao, J. N. Hovenier, Z. Q. Yang, J. J. A. Baselmans, A. Baryshev, M. Hajenius, T. M. Klapwijk, A. J. L. Adam, T. O. Klaassen, B. S. Williams, S. Kumar, Q. Hu, and J. L.
Reno, “Terahertz heterodyne receiver based on a quantum cascade laser and a superconducting bolometer,” Applied Physics Letters, vol. 86, no. 24, pp. 244104–
244104–3, Jun. 2005.
[8] M. Tonouchi, “Cutting-edge terahertz technology,” Nature Photonics, vol. 1, no. 2, pp. 97–105, Feb. 2007.
[9] W.-C. Kan, W.-S. Lee, W.-H. Cheung, V. P. Wallace, and E. Pickwell-MacPherson,
“Terahertz pulsed imaging of knee cartilage,” Biomed. Opt. Express, vol. 1, no. 3, pp.
967–974, Oct. 2010.
[10] Z. D. Taylor, R. S. Singh, M. O. Culjat, J. Y. Suen, W. S. Grundfest, H. Lee, and E.
R. Brown, “Reflective terahertz imaging of porcine skin burns,” Opt. Lett., vol. 33, no.
11, pp. 1258–1260, Jun. 2008.
[11] A. Hirata, T. Kosugi, H. Takahashi, R. Yamaguchi, F. Nakajima, T. Furuta, H. Ito, H. Sugahara, Y. Sato, and T. Nagatsuma, “120-GHz-band millimeter-wave photonic wireless link for 10-Gb/s data transmission,” Microwave Theory and Techniques, IEEE Transactions on, vol. 54, no. 5, pp. 1937 – 1944, May 2006.
[12] H.-J. Song, K. Ajito, Y. Muramoto, A. Wakatsuki, T. Nagatsuma, and N. Kukutsu,
“24 Gbit/s data transmission in 300 GHz band for future terahertz communications,”
Electronics Letters, vol. 48, no. 15, pp. 953 –954, 2012.
[13] R. Appleby and H. B. Wallace, “Standoff Detection of Weapons and Contraband in
the 100 GHz to 1 THz Region,” Antennas and Propagation, IEEE Transactions on, vol.
55, no. 11, pp. 2944 –2956, Nov. 2007.
[14] F. Huang, B. Schulkin, H. Altan, J. F. Federici, D. Gary, R. Barat, D. Zimdars, M.
Chen, and D. B. Tanner, “Terahertz study of 1,3,5-trinitro-s-triazine by time-domain and Fourier transform infrared spectroscopy,” Applied Physics Letters, vol. 85, no. 23, pp.
[15] Y. C. Shen, T. Lo, P. F. Taday, B. E. Cole, W. R. Tribe, and M. C. Kemp, “Detection
and identification of explosives using terahertz pulsed spectroscopic imaging,” Applied
Physics Letters, vol. 86, no. 24, pp. 241116–241116–3, Jun. 2005.
[16] H.-B. Liu, Y. Chen, G. J. Bastiaans, and X.-C. Zhang, “Detection and identification of explosive RDX by THz diffuse reflection spectroscopy,” Opt. Express, vol. 14, no. 1, pp. 415–423, Jan. 2006.
[17] H.-B. Liu, H. Zhong, N. Karpowicz, Y. Chen, and X.-C. Zhang, “Terahertz
Spectroscopy and Imaging for Defense and Security Applications,” Proceedings of the
IEEE, vol. 95, no. 8, pp. 1514 –1527, Aug. 2007.
[18] H. Zhong, J. Xu, X. Xie, T. Yuan, R. Reightler, E. Madaras, and X.-C. Zhang,
“Nondestructive defect identification with terahertz time-of-flight tomography,” Sensors
Journal, IEEE, vol. 5, no. 2, pp. 203 – 208, Apr. 2005.
[19] M. Yamashita, C. Otani, T. Matsumoto, Y. Midoh, K. Miura, K. Nakamae, K.
Nikawa, S. Kim, H. Murakami, and M. Tonouchi, “THz emission characteristics from p/n
junctions with metal lines under non-bias conditions for LSI failure analysis,” Opt. Express, vol. 19, no. 11, pp. 10864–10873, May 2011.
[20] J.-P. Caumes, A. Younus, S. Salort, B. Chassagne, B. Recur, A. Zi gl , A. Dautant,
and E. Abraham, “Terahertz tomographic imaging of XVIIIth Dynasty Egyptian sealed pottery,” Appl. Opt., vol. 50, no. 20, pp. 3604–3608, Jul. 2011.
[21] I. Hosako, N. Sekine, M. Patrashin, S. Saito, K. Fukunaga, Y. Kasai, P. Baron, T. Seta, J. Mendrok, S. Ochiai, and H. Yasuda, “At the Dawn of a New Era in Terahertz
Technology,” Proceedings of the IEEE, vol. 95, no. 8, pp. 1611 –1623, Aug. 2007.
[22] K. Fukunaga, I. Hosako, Y. Ogawa, and S. Hayashi, “THz spectroscopy for art conservation science,” in Infrared and Millimeter Waves, 2007 and the 2007 15th International Conference on Terahertz Electronics. IRMMW-THz. Joint 32nd International Conference on, 2007, pp. 678 –679.
[23] Committee on Assessment of Security Technologies for Transportation, National Research Council, Assessment of Millimeter-Wave and Terahertz Technology for Detection and Identification of Concealed Explosives and Weapons. Washington, D.C.: The National Academies Press, 2007.
[24] Y. Yang, A. Shutler, and D. Grischkowsky, “Measurement of the transmission of the
atmosphere from 0.2 to 2 THz,” Opt Express, vol. 19, no. 9, pp. 8830–8838, Apr. 2011.
[25] J. E. Bjarnason, T. L. J. Chan, A. W. M. Lee, M. A. Celis, and E. R. Brown,
“Millimeter-wave, terahertz, and mid-infrared transmission through common clothing,”
Applied Physics Letters, vol. 85, no. 4, pp. 519–521, Jul. 2004.
[26] P. W. Kruse, Uncooled Infrared Imaging Arrays and Systems. Academic Press, 1997. [27] E. N. Grossman, C. R. Dietlein, M. Leivo, A. Rautiainen, and A. Luukanen,
“Multispectral terahertz camera,” in Electromagnetics in Advanced Applications, 2009.
ICEAA ’09. International Conference on, 2009, pp. 1002 –1005.
[28] A. Luukanen, M. Gronholm, P. Lappalainen, M. Leivo, A. Rautiainen, A. Tamminen, J. Ala-Laurinaho, A. Raisanen, C. R. Dietlein, and E. N. Grossman, “Passive real-time submillimetre-wave imaging system utilizing antenna-coupled microbolometers for
stand-off security screening applications,” in Antenna Technology (iWAT), 2010 International
[29] E. N. Grossman, C. R. Dietlein, M. Leivo, A. Rautiainen, and A. Luukanen, “A passive, real-time, terahertz camera for security screening, using superconducting
microbolometers,” in Microwave Symposium Digest, 2009. MTT ’09. IEEE MTT-S
International, 2009, pp. 1453 –1456.
[30] E. Heinz, T. May, D. Born, G. Zieger, G. Thorwirth, S. Anders, V. Zakosarenko, T. Krause, A. Krüger, M. Schulz, H.-G. Meyer, M. Schubert, and M. Starkloff, “Toward high-sensitivity and high-resolution submillimeter-wave video imaging,” Opt. Eng, vol. 50, no. 11, pp. 113204–113204, Nov. 2011.
[31] K. B. Cooper, R. J. Dengler, N. Llombart, T. Bryllert, G. Chattopadhyay, E. Schlecht,
J. Gill, C. Lee, A. Skalare, I. Mehdi, and P. H. Siegel, “Penetrating 3-D Imaging at 4- and
25-m Range Using a Submillimeter-Wave Radar,” Microwave Theory and Techniques, IEEE Transactions on, vol. 56, no. 12, pp. 2771 –2778, Dec. 2008.
[32] K. B. Cooper, R. J. Dengler, N. Llombart, A. Talukder, A. V. Panangadan, C. S. Peay,
I. Mehdi, and P. H. Siegel, “Fast high-resolution terahertz radar imaging at 25 meters,”
2010, p. 76710Y–76710Y–8.
[33] A. Lee, S. Kumar, B. S. Williams, Q. Hu, and J. L. Reno, “Real-time imaging using a 4.3-THz quantum cascade laser and a 240x320 element focal-plane array,” in Lasers and Electro-Optics, 2006 and 2006 Quantum Electronics and Laser Science Conference. CLEO/QELS 2006. Conference on, 2006, pp. 1 –2.
[34] N. Oda, “Uncooled bolometer-type Terahertz focal plane array and camera for real-time imaging,” Comptes Rendus Physique, vol. 11, no. 7–8, pp. 496–509, Aug. 2010. [35] J. Meilhan, B. Dupont, V. Goudon, G. Lasfargues, J. Lalanne Dera, D. T. Nguyen, J.
L. Ouvrier-Buffet, S. Pocas, T. Maillou, O. Cathabard, S. Barbieri, and F. Simoens,
“Active THz imaging and explosive detection with uncooled antenna-coupled microbolometer arrays,” Proceedings of SPIE, vol. 8023, no. 1, p. 80230E–80230E–13,
May 2011.
[36] A. W. Lee and Q. Hu, “Real-time, continuous-wave terahertz imaging by use of a microbolometer focal-plane array,” Opt. Lett., vol. 30, no. 19, pp. 2563–2565, Oct. 2005. [37] F. Simoens, T. Durand, J. Meilhan, P. Gellie, W. Maineult, C. Sirtori, S. Barbieri, H.
Beere, and D. Ritchie, “Terahertz imaging with a quantum cascade laser and amorphous-silicon microbolometer array,” 200λ, p. 74850M–74850M–10.
[38] M. Leahy-Hoppa, M. Fitch, and R. Osiander, “Terahertz spectroscopy techniques for
explosives detection,” Analytical and Bioanalytical Chemistry, vol. 395, no. 2, pp. 247–

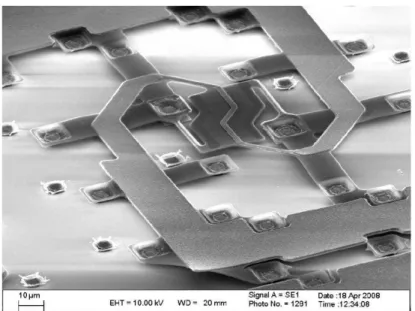
![Fig. 3.8: SEM image of 17- m pitch bolometer shows contact and thermal leg [10].](https://thumb-eu.123doks.com/thumbv2/123doknet/12889798.370571/49.892.314.624.178.509/fig-sem-image-pitch-bolometer-shows-contact-thermal.webp)