HAL Id: hal-02313567
https://hal.sorbonne-universite.fr/hal-02313567
Submitted on 11 Oct 2019HAL is a multi-disciplinary open access archive for the deposit and dissemination of sci-entific research documents, whether they are pub-lished or not. The documents may come from teaching and research institutions in France or abroad, or from public or private research centers.
L’archive ouverte pluridisciplinaire HAL, est destinée au dépôt et à la diffusion de documents scientifiques de niveau recherche, publiés ou non, émanant des établissements d’enseignement et de recherche français ou étrangers, des laboratoires publics ou privés.
An EGF-responsive neural circuit couples insulin
secretion with nutrition in Drosophila
Eleonora Meschi, Pierre Léopold, Rénald Delanoue
To cite this version:
Eleonora Meschi, Pierre Léopold, Rénald Delanoue. An EGF-responsive neural circuit couples in-sulin secretion with nutrition in Drosophila. Developmental Cell, Elsevier, 2019, 48 (1), pp.76-86.e5. �10.1016/j.devcel.2018.11.029�. �hal-02313567�
An EGF-responsive neural circuit couples insulin secretion with nutrition in Drosophila Eleonora Meschi1, Pierre Léopold1,2* and Renald Delanoue1
1Université Côte d’Azur, CNRS, Inserm, Institute of Biology Valrose, Parc Valrose, 06108 Nice, France. 2present address: Institut Curie, PSL Research University, CNRS UMR3215, INSERM U934, UPMC Paris-Sorbonne, 26 Rue d'Ulm, 75005, Paris, France.
* corresponding author and lead contact: leopold@unice.fr
Running title: EGFR-driven neural circuitry controls insulin release in Drosophila
Summary (150 words max.)
Developing organisms use fine-tuning mechanisms to adjust body growth to ever-changing nutritional conditions. In Drosophila, the secretory activity of insulin-Producing Cells (IPCs) is central to couple systemic growth with amino acids availability. Here, we identify a subpopulation of inhibitory neurons contacting the IPCs (IPCs-connecting neurons, or ICNs) that play key role in this coupling. We show that ICNs respond to Growth Blocking Peptides (GBPs), a family of fat body-derived signals produced upon availability of dietary amino acids. We demonstrate that GBPs are atypical ligands for the fly EGF receptor (EGFR). Upon activation of EGFR by adipose GBPs, ICN-mediated inhibition of IPC function is relieved, allowing insulin secretion. Our study reveals an unexpected role for EGF-like metabolic hormones and EGFR signaling as critical modulators of neural activity, coupling insulin secretion to the nutritional status.
Key words
Introduction
Developing organisms must evaluate their nutritional status, adapt growth and maintain energy homeostasis. In vertebrates, variations in the circulating levels of insulin and insulin-like growth factor 1 (IGF-I) trigger nutrient storage and release, and control systemic growth. Therefore, the release of insulin-like peptides by their producing cells is tightly regulated by nutrients. Alterations in this coupling is associated with major metabolic diseases and growth defect (Donadon et al., 2009).
Insulin-like peptides act on an evolutionary conserved pathway and serve the same physiological role in coupling nutrition and growth in all developing multicellular organisms. In Drosophila, eight Insulin-like peptides (Dilp1-8) have been identified. With the exception of Dilp8, which has distinct functions (Colombani et al., 2012), all the other Dilps carry out both the metabolic functions of the vertebrate insulin and the growth-promoting functions of IGFs, through a unique receptor (InR) and a conserved intracellular insulin/IGF signaling pathway (IIS) (Garofalo, 2002; Ikeya et al., 2002). In flies, the insulin-producing cells (IPCs), which are functionally related to the pancreatic beta cells, are found in the brain (Rulifson et al., 2002). The IPCs are peptidergic neurons, located in the median neurosecretory cluster (mNSC), producing at least four of the Dilps (Brogiolo et al., 2001; Ikeya et al., 2002; Liu et al., 2016). IPCs processes present at the surface of the heart tube release Insulin-like peptides into the hemolymph, inducing organ growth and controlling carbohydrate homeostasis (Rulifson et al., 2002). During the growth period, IPC secretory activity is indirectly coupled to the nutrient status through an inter-organ communication involving the fat body (FB), a functional equivalent of vertebrate liver and white adipose tissue that acts as a nutrient sensor. This function relies on the amino acid sensor Target Of Rapamycine Complex 1 (TORC1) in the FB, controlling the production of fat body-derived signals (FBS) that remotely adjust Dilps secretion from the IPCs (Colombani et al., 2003; Géminard et al., 2009). Both growth-promoting and –inhibiting FBSs, produced in response to various nutritional cues, participate in this tight control. The cytokine Unpaired 2 (Upd2) and the small peptide CCHamide-2 (CCHa2) stimulate IPCs activity after sugar and/or lipid intakes (Rajan and Perrimon, 2012; Sano et al., 2015). In response to dietary amino acids, adipose cells release the Stunted (Sun)
peptide), which remotely activate brain Dilp secretion (Delanoue et al., 2016). The Growth Blocking Peptides 1 and 2 (GBP1, 2) were initially described as growth inhibitors, or activators depending on their concentration after injection in lepidopteran (Hayakawa, 1991; Hayakawa and Ohnishi, 1998). More recently, they were shown to work as bona fide growth factors produced by fat body cells in response to an amino acid signal and to stimulate Dilp secretion (Koyama and Mirth, 2016). Conversely, chronic exposure to a low protein diet induces the release of Tumor Necrosis Factor (TNF)-α from fat cells, which in turn represses brain dilp2 expression (Agrawal et al., 2016).
These FBSs do not share a common mode of action. They act directly through their receptors on the IPCs, such as the CCHa2 receptor, the Sun receptor Methuselah or the TNF receptor Grindelwald (Agrawal et al., 2016; Delanoue et al., 2016; Sano, 2015). Alternatively, like in the case of Upd2, a neuronal relay is used (Rajan and Perrimon, 2012). In the case of the GBPs, the mechanism of action remains unknown (Koyama and Mirth, 2016).
Here, we report the identification of a short neural circuit required to adjust Dilp secretion in response to dietary amino acids, consisting in one pair of bilateral neurons making direct synaptic connections with the IPCs. Under low protein diet, these IPC-connecting neurons (ICNs) inhibit Dilp2 secretion. In fed larvae, ICNs activity is blocked, allowing Dilp release and animal growth. We further show that ICNs activity is controlled by fat-derived GBPs, which act as long-range hormonal agonists of EGFR signaling. In fed conditions, GBPs activate EGFR signaling in the ICNs, relieving their inhibitory effect on the IPCs and resulting in Dilp secretion. Altogether, our study reveals an unexpected role for EGF-like metabolic hormones and EGFR signaling as critical modulators of neural activity, coupling insulin secretion to the nutritional status.
Results
Identification of a pair of neurons contacting the IPCs
The IPCs are at the center of an elaborated network integrating various nutritional cues delivered in part by peripheral sensor tissues. In order to better characterize this intricate network, we first sought
to image the neuronal architecture of the IPCs. Using the IPC driver dilp2-Gal4, we expressed DenMark to visualize post-synaptic vesicles (Nicolai et al., 2010) and a Synaptotagmine::GFP (SyteGFP) fusion used as a presynaptic marker (Zhang et al., 2002). As previously described, we observed IPCs axons projecting towards the Corpora cardiaca (CC). More surprisingly, we could also observe a dense dendritic compartment surrounding the soma with branching running caudally along the midline through the subesophageal ganglion (SEG) (Figure 1A). This suggested that the IPCs receive inputs from afferent neurons connecting through their dendritic arborisations.
We then screened the Janelia neuronal GAL4 collection to identify driver lines expressing in neurons projecting towards the IPCs dendrites. We focused our attention on the R22H11 line marking one pair of neurons located in the Pars Intercerebralis (PI) of the optic lobes, and one pair of CAPA-positive neurons in the posterior, ventral part of the medial subesophageal ganglion (CC-MS 2, Corpora Cardiaca-innervating neurosecretory neuron of the Medial Subesophageal ganglion 2) (Siegmund and Korge, 2001) (Figure S1). Interestingly, the R22H11 PI neurons project their neurites towards the IPC dendrites (Figure 1B). By using the dvGlut::GFP fusion that marks presynaptic compartments (Riemensperger et al., 2013), we found that presynaptic vesicles of the R22H11 PI neurons co-localize with the IPCs (Figure 1C). This suggests that R22H11 neurons project axons towards the IPCs. Using the GFP reconstitution across synaptic partners (GRASP) (Feinberg et al., 2008) we could confirm direct contact between the two neuronal populations (Figure 1D). These findings therefore suggest that the
R22H11 PI neurons could directly contact the IPCs, and were named thereafter IPCs Connecting
Neurons (ICNs).
The ICNs are inhibitory afferent neurons controlling IPC function.
To test whether the ICNs could functionally interfere with IPC secretory activity, we ablated the ICNs by expressing the pro-apoptotic gene hid with the R22H11 driver (hereafter named ICN-Gal4). ICNs ablation induces pupal overgrowth (+15,6%) (Figure 2A and S2A) associated with a decrease in Dilp2 and Dilp5 staining in the IPCs (Figure 2C and S2G). We confirmed by Dilp2 ELISA (Park et al., 2014) that
reduced Dilp2 staining in the IPCs was the consequence of increased Dilp2 release in the hemolymph (Figure 2D). In line with this, pupal overgrowth is due to augmented growth rate (Figure 2E) with no effect on developmental timing (Figure S2C) or food intake (Figure S2D). Interestingly, when fed a low protein diet (0,3x), ICN>hid larvae reach a body size nearly similar to control individuals (ICN>w) raised on rich protein diet (2x) (figure 2B), suggesting that animals with ablated ICNs are less responsive to amino acids in the diet. Both hyperpolarization of the ICNs using the potassic channel Kir2.1, or impaired secretion using tetanus toxin (TetX) led to pupal overgrowth, associated with reduced accumulation of Dilp2 and Dilp5 in the IPCs, and increased circulating Dilp2 levels (Figure 2A,C,D and Fig S2G). Converse experiments using the bacterial sodium channel NaChBac to induce chronic depolarization of the ICNs led to a strong reduction of circulating Dilp2 associated with accumulation of Dilp2 and Dilp5 in the IPCs (Figure 2C-D and S2G). However, in our experimental conditions, this was not sufficient to modify pupal volume (Figure 2A). In the same conditions, Dilp3 release was not modified (Figure S2H), consistent with the fact that Dilp3 levels are controlled by circulating sugars (Kim and Neufeld, 2015).
Importantly, no phenotype was observed using a CAPA-Gal4 line expressed in the CAPA-positive subset of the R22H11-positive neurons (Figure S2B). This demonstrates that the ICNs located in the PI are sole responsible for the observed growth regulations. Since mRNA levels of dilp2 or dilp5 remain unchanged after manipulating ICNs activity (Figure S2E and F), we conclude that the ICNs are part of an inhibitory neural relay specifically acting on Dilp2 and Dilp5 secretion by the IPCs.
ICNs and IPCs present opposite responses to nutrition.
Our previous findings that IPCs modulate Dilp secretion according to nutritional cues (Geminard et al. 2009) and that ICN-ablated animals do not respond to low nutrient (Figure 2B) suggested that ICNs mediates the response to nutrition. The CaLexA reporter allows cumulative tracing of neuronal activity (Masuyama et al., 2012). Using this reporter, IPCs show a robust neuronal activity in fed conditions, which is abolished under amino acids starvation (Figure 3A). By contrast, ICNs exhibit basal activity in
fed conditions, which dramatically increases after acute amino acids starvation (Figure 3B). In addition, IPCs showed decreased activity at late wandering stage (a physiological state of cessation of feeding) compared to younger feeding larvae (Figure 3C), while ICNs activity strongly increases during this stage (Figure 3D). Therefore, IPCs and ICNs show opposite responses to nutrition, in line with the inhibitory action of ICNs on IPCs.
Ectopic expression of GBPs in the ICNs promotes body growth
We next tested whether ICNs could constitute a neuronal relay between the fat body and the IPCs in the nutritional response. To evaluate this possibility, we expressed various fat body-derived factors (FBS) in the ICNs and tested their possible autocrine action on ICNs function and animal growth. While Stunted or Unpaired 2 expression in the ICNs (icn>sun, icn>upd2) had no effect on pupal volume (Figure 4A, S3A-B), expression of GBP1 and GBP2 (icn>gbp1, icn>gbp2) led to pupal overgrowth similar to what obtained after GBP overexpression in the fat body (lpp>gbp1, lpp>gbp2) (Figure S3C). Like in the case of ICNs activity manipulation, this pupal overgrowth was coupled with increased Dilp2 secretion from the IPCs (Figure 4B). This autocrine response is specific for the ICNs since ectopic expression of GBPs in a neighboring neuronal population (eh>gbp1, eh>gbp2), or in the CAPA neurons targeted by the R22H11 driver do not induce body growth increase (Figure S3D, S3E). These results indicate that ICNs respond to variations in GBPs levels to control Dilp release from the IPCs and systemic growth.
GBPs activate the EGFR signaling pathway
GBPs share 3-dimensional structure in their core region with EGF ligands (Aizawa et al., 2002) and bind to EGF receptor (EGFR) in human keratinocytes (Ohnishi et al., 2001). To better understand the mode of action of GBPs on ICNs, we first tested whether GBPs activate Drosophila EGFR signaling in insect cells. After activation by its ligands, EGFR dimerizes and undergoes auto-phosphorylation in trans on tyrosine. We therefore tested whether GBPs induce EGFR phosphorylation in co-cultured S2R+ cells
expressing EGFR::V5 and GBP1::HA as previously described (Lahusen et al., 2007) Anti-phosphotyrosine immunoprecipitation followed by anti-V5 western blotting indicates an increase of Tyr-phosphorylated EGFR::V5 in the presence of GBP1-HA (Figure 4C). This is accompanied by increased ERK phosphorylation (Figure 4D), as previously described (Tsuzuki et al., 2014). In vivo, ectopic expression of GBP1 in the posterior compartment of the wing imaginal disc (hh>gbp1) or in the wing pouch (nub>gbp1) increases phosphor-ERK levels in an autonomous manner (Figure 4E and 4F). This effect is abolished upon EGFR silencing (nub>egfrRi, gbp1) showing that GBP1 requires EGFR to activate ERK signaling in vivo. EGFR signaling controls wing vein patterning and, when in excess, leads to the formation of ectopic veins in the adult wing (Butchar et al., 2012). Ectopic expression of GBP1 or GBP2 in the wing pouch induces an extra vein phenotype (Figure 4G), confirming that both GBPs are potent activators of EGFR signaling in vivo. The wing vein phenotype is not detected when GBPs are produced from the adipose tissue (lpp>GBP1). This overall indicates that GBPs are potent activators of EGFR signaling both in vitro and in vivo. Moreover, fat-derived GBPs are able to mediate long range effects but do not interfere with EGFR signaling in imaginal tissues (Figure S3F).
EGFR signaling in the ICNs induces Dilps secretion and systemic growth
We next wondered whether GBPs action in the ICNs requires EGFR. For this, we first modified EGFR signaling in the ICNs and observed systemic growth effects. Inhibition of EGFR signaling in the ICNs (icn>egfr-ri, icn>dsor-ri) reduces pupal size (-8%) (Figure 5A and S4A), and Dilp2 release from the IPCs (Figure 5B). Conversely, increased EGFR signaling (icn>egfrA887T) induces overgrowth (Figure 5A and S4A) and Dilp2 release (Figure 5B), while dilp2 gene expression is unchanged (Figure S4B). Notably, no growth phenotype is observed when the CAPA-GAL4 line is used to drive expression of the modified forms of EGFR (Figure S4C). Remarkably, overexpression of an activated form of Spitz (icn>sspitz) or its membrane tethered version (icn>nrt::sspitz) in the ICNs phenocopy GBP-induced growth (Figure S4D), but not overexpression of a non-processed form of Spitz (icn>mspitz, Figure S4D). This overall indicates that activation of EGFR in the ICNs is sufficient to promote systemic growth via Dilp release.
Although EGFR signaling could potentially impact cell proliferation, differentiation and migration (Shilo, 2003), we did not observe alteration in the number or the macroscopic organization of the ICNs in any of these conditions. In addition, ICNs with modified EGFR signaling still produce Tachykinin (dTK) (Figure S4E) and Myo-Inhibitory Peptide (MIP) (Figure S4E’), suggesting that their neuronal identity is not changed.
We further established that growth inhibition produced by reducing EGFR signaling in the ICNs (icn>egfr-ri or icn>dsor-ri) is epistatic to GBP1 overexpression (icn>egfr ri; gbp1 or icn>dsor ri; gbp1) (Figure 5C,D, Figure S4F). This indicates that the GBPs exert their effect on the ICNs through activation of EGFR signaling. Altogether, these results indicate that GBPs produced by fat body cells in response to nutrients act remotely on the ICNs via EGFR signaling to promote systemic growth.
GBPs produced by fat cells repress ICNs activity through EGFR signaling.
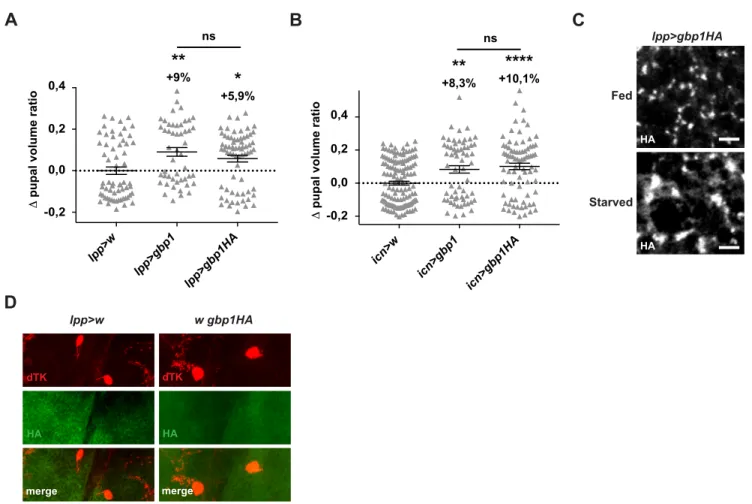
We next tested whether GBP1 release from fat cells relies on dietary amino acids. For this, we generated a functional HA-tagged GBP1 allele. Its overexpression either in the fat body (lpp>gbp1HA) (Figure S5A) or in the ICNs (icn>gbp1HA) (Figure S5B) induces an overgrowth similar to that observed with unmodified GBP1. Upon acute amino acids starvation, we did not detect changes in GBP1::HA protein levels in adipose cells (lpp>gbp1HA), while hemolymph levels severely dropped (Figure 6A). Noticeably, in these conditions, fat body GBP1::HA-containing vesicles were enlarged compared to fed controls (Figure S5C). Importantly, using anti-HA antibody, we could detect fat-derived GBP1::HA decorating the ICNs of fed larvae (Figure 6F and S5D). These results indicate that the secretion of GBPs from fat cells is tightly controlled by nutrition, and that GBP1 molecules secreted by fat cells travel to the brain ICNs.
Since fat body derived-GBP1 has insulinotropic properties (Koyama and Mirth, 2016), we next assessed whether this effect is achieved via a relay using EGFR signaling in the ICNs. For this, hemolymph from control larvae (lpp>w) or larvae overexpressing gbp1 in the fat body (lpp>gbp1) was collected to perform ex vivo brain culture experiments. When incubated with dissected control brains
(icn>w), hemolymph from lpp>gbp1 larvae efficiently triggered Dilp2 secretion, confirming the insulinotropic function of GBPs. This effect was abolished upon EGFR silencing in the ICNs (icn>egfr-ri) brains (Figure 6B), indicating that fat body derived-GBP1 requires EGFR in the ICNs to stimulate Dilp2 secretion.
To better understand the function of GBP/EGFR signaling in ICNs, icn>calexa brains of wandering larvae were incubated with hemolymph collected from control larvae (lpp>w), larvae overexpressing
gbp1 in the fat body (lpp>gbp1) or larvae bearing a deletion of both gbp1 and gbp2 genes (ex67-/-). While hemolymph from both control and gbp1-overexpressing larvae induced a decrease in ICNs neuronal activity, hemolymph from ex67-/- mutant larvae had no effect (Figure 6C), demonstrating that circulating GBP1 represses ICNs neuronal activity. Similarly, overexpressing a constitutively activated form of EGFR in the ICNs (calexa; icn>egfrA887T) efficiently repressed ICNs in wandering larvae (Figure 6D), while silencing EGFR (calexa; icn>egfr-ri) activated them in L3 larvae (Figure 6E). Hence, we conclude from these data that activation of EGFR signaling by circulating GBPs inhibits ICNs neuronal activity, therefore releasing ICNs-mediated inhibition of the IPCs.
Discussion
EGFR signaling exerts a central control on cell growth and differentiation, and as such is essential in multiple developmental processes. Our study proposes a new paradigm for EGFR signaling by establishing that EGF receptor and its atypical GBP ligands play a pivotal role in controlling neuronal activity and, as a consequence, adapt the rate of tissue growth according to nutritional cues.
GBPs act as long-distance EGFR ligands.
RMN analysis suggests that the core region of GBPs has structural similarity with the C-terminal domain of EGF (Aizawa et al., 1999, 2002). Several experimental approaches provided conclusive evidence of direct binding of GBPs to EGFR in keratinocytes, other results suggested that unidentified receptor and co-receptor or adaptor protein might exist in insect cells (Aizawa et al., 2002; Oda et al.,
2010; Ohnishi et al., 2001). More recently, GBPs were proposed to interact with the GPCR Mthl10, but there is no direct evidence that this interaction has functional significance for the control of IPCs function (Sung et al., 2017).
Our study establishes that gbp1 overexpression can efficiently stimulate EGFR-dependent signaling, both in cultured cells and in developing organs. We also provide genetic evidence that the function of fat body derived-GBPs in controlling Dilp secretion entirely relies on the presence of EGFR in the ICNs.
In both mammals and flies, several ligands activate EGFR signaling to fulfill a variety of biological responses (Ceresa and Peterson, 2014). The main ligand for EGFR, Spitz, is palmitoylated, which reduces its secretion and its range of action (Miura et al., 2006). By contrast, we show that GBPs produced by the fat body can travel over long distances and bind to the brain ICNs, therefore providing a signal for inter-organ communication (see Figure 6F and S5D). We do not know how GBPs are processed, secreted by adipose tissue and transported in the hemolymph. It is possible that fat body-derived GBPs acquire distinct features, such as post-translational modifications, association with co-partners, packaging, required to signal over long distance. These specific features, or the localization of EGFR at the surface of imaginal epithelia could explain why adipose GBP does not activate EGFR in imaginal tissues. Similarly, Hedgehog (Hh) produced by the larval gut circulates in the hemolymph associated with lipoprotein particles and modifies animal growth rate and developmental timing, with no effect on imaginal Hh signaling (Rodenfels et al., 2014). Recent data suggest that mammalian EGF-like ligands with endocrine function could be packed into signaling competent exosomes (Singh et al., 2016).
The mechanisms of GBP released into the hemolymph is uncharacterized. However, we show that GBP secretion is highly dependent on the nutritional status, since HA-tagged GBP1, although highly produced in fat cells under an ectopic Gal4 system, is undetectable in the hemolymph when larvae are subjected to amino acids starvation. TORC1 signaling controls gbp gene transcription (Koyama and
Mirth, 2016). It will be interesting to know whether GBP secretion is also controlled by TORC1 activity or by alternative pathways.
EGFR function in the ICNs
In the CNS, EGFR and its various ligands promote differentiation, maturation and survival of a variety of neurons (Wong and Guillaud, 2004). In the present work, we observed that EGFR signaling in the ICNs is not needed for their architecture or their neuronal identity. Surprisingly, activation of EGFR reduces intracellular calcium and represses ICNs activity. Other pathways than MAPK signaling could be activated downstream of EGFR, such as PI3K/AKT or phospholipase-C γ (PLC-γ), which could promote intracellular calcium release. These branches of EGFR signaling control cell migration and invasion (Wee and Wang, 2017). However, in the context of ICNs, activation of EGFR leads to calcium decrease, and we found that dSOR, one downstream component of the MAPK pathway, is involved in this process. Interestingly, components of MAPK signaling are present in distal neural structures such as dendrites and synapses, suggesting that this pathway is not limited to the regulation of gene expression and can control local synaptic activity in a more acute manner. Indeed, several synaptic proteins have been identified as ERK/MAPK substrates such as scaffolding PSD proteins, Kv4.2 potassium channels or group I metabotropic glutamate receptors (Schrader et al., 2006). Phosphorylation of these components by ERK/MAPK modifies their trafficking and synaptic delivery and thus determines the strength and the efficacy of excitatory synapses (Mao and Wang, 2016). These would be interesting targets for a role of EGFR in ICNs to evaluate in future studies.
A general mechanism for Insulin-like peptide secretion.
Interestingly, non-autonomous control of ILP secretion by EGF/EGFR signaling has recently been described in the fly developing brain. Here, an EGF-like ligand produced by the photoreceptors stimulates the production of the Insulin-like peptide Dilp6 in adjacent glial cells, and this process is required for lamina neuronal differentiation (Fernandes et al., 2017). In mammals, amino acids have
insulinotropic effects and deficiencies in dietary proteins are associated with impaired insulin secretion (Newsholme et al., 2007; Zhang and Li, 2013). One possible mechanism for this regulation could involve a central relay through direct innervation of the pancreatic islets (Horiuchi et al., 2017; Rosario et al., 2016). In addition, EGF ligands can stimulate insulin release from pancreatic islets (Lee et al., 2008). However, it is not clear what tissue could be producing the EGF signal in such regulation. Therefore, the present work gives a prospect for further studies identifying key circuitries required for insulin/IGF secretion.
Acknowledgements
We thank Alessandra Mauri, Gisèle Jarretou and Thomas Phil for technical assistance. We thank all members of the laboratory for insightful discussions and comments on the manuscript. We thank the Vienna Drosophila RNAi Center, the Drosophila Genetics Resource Center (NIH grant: 2P40OD010949), the Bloomington stock Center for providing Drosophila lines. This work was supported by the CNRS, INSERM, European Research Council (Advanced grant no. 268813 to P.L.), ARC (grant n° PGA120150202355 to P.L.), the Labex Signalife program (grant ANR-11-LABX-0028-01 to P.L.), the French government (PhD fellowship to E.M.) and the Fondation pour la Recherche Médicale (FDT20170437244 PhD fellowship to E.M.).
Authors Contributions
Conceptualization: RD and PL, Methodology: RD and PL, Formal analysis: EM, Investigation: EM and RD, Writing original draft: RD, EM and PL, Writing review & editing: RD, EM and PL, Visualization: EM, Supervision: RD and PL, Project Administration: RD and PL, Funding acquisition: PL.
Declaration of Interests
References
Agrawal, N., Delanoue, R., Mauri, A., Basco, D., Pasco, M., Thorens, B., and Léopold, P. (2016). The Drosophila TNF Eiger Is an Adipokine that Acts on Insulin-Producing Cells to Mediate Nutrient Response. Cell Metab. 23, 675–684.
Aizawa, T., Fujitani, N., Hayakawa, Y., Ohnishi, A., Ohkubo, T., Kumaki, Y., Kawano, K., Hikichi, K., and Nitta, K. (1999). Solution structure of an insect growth factor, growth-blocking peptide. J. Biol. Chem. 274, 1887–1890. Aizawa, T., Hayakawa, Y., Nitta, K., and Kawano, K. (2002). Structure and activity of insect cytokine GBP which stimulates the EGF receptor. Mol. Cells 14, 1–8.
Azpiazu, N., and Morata, G. (2000). Function and regulation of homothorax in the wing imaginal disc of Drosophila. Development 127, 2685 LP-2693.
Brankatschk, M., and Eaton, S. (2010). Lipoprotein Particles Cross the Blood–Brain Barrier in Drosophila; J. Neurosci. 30, 10441 LP-10447.
Brankatschk, M., Dunst, S., Nemetschke, L., and Eaton, S. (2014). Delivery of circulating lipoproteins to specific neurons in the Drosophila brain regulates systemic insulin signaling. Elife 3, e02862.
Brogiolo, W., Stocker, H., Ikeya, T., Rintelen, F., Fernandez, R., and Hafen, E. (2001). An evolutionarily conserved function of the Drosophila insulin receptor and insulin-like peptides in growth control. Curr. Biol. 11, 213–221. Burke, R., Nellen, D., Bellotto, M., Hafen, E., Senti, K.-A., Dickson, B.J., and Basler, K. (1999). Dispatched, a Novel Sterol-Sensing Domain Protein Dedicated to the Release of Cholesterol-Modified Hedgehog from Signaling Cells. Cell 99, 803–815.
Butchar, J.P., Cain, D., Manivannan, S.N., McCue, A.D., Bonanno, L., Halula, S., Truesdell, S., Austin, C.L., Jacobsen, T.L., and Simcox, A. (2012). New negative feedback regulators of Egfr signaling in Drosophila. Genetics 191, 1213–1226.
Ceresa, B.P., and Peterson, J.L. (2014). Cell and Molecular Biology of Epidermal Growth Factor Receptor (Elsevier Inc.).
Colombani, J., Raisin, S., Pantalacci, S., Radimerski, T., Montagne, J., and Léopold, P. (2003). A nutrient sensor mechanism controls Drosophila growth. Cell 114, 739–749.
Colombani, J., Andersen, D.S., and Léopold, P. (2012). Secreted peptide Dilp8 coordinates Drosophila tissue growth with developmental timing. Science 336, 582–585.
Delanoue, R., Meschi, E., Agrawal, N., Mauri, A., Tsatskis, Y., McNeill, H., Leopold, P., and Léopold, P. (2016). Drosophila insulin release is triggered by adipose Stunted ligand to brain Methuselah receptor. Science (80-. ).
353, 1553–1556.
Delanoue, R.R., Slaidina, M., and Léopold, P. (2010). The steroid hormone ecdysone controls systemic growth by repressing dMyc function in drosophila fat cells. Dev. Cell 18, 1012–1021.
Donadon, V., Balbi, M., and Zanette, G. (2009). Hyperinsulinemia and risk for hepatocellular carcinoma in patients with chronic liver diseases and Type 2 diabetes mellitus. Expert Rev. Gastroenterol. Hepatol. 3, 465– 467.
Feinberg, E.H., VanHoven, M.K., Bendesky, A., Wang, G., Fetter, R.D., Shen, K., and Bargmann, C.I. (2008). GFP Reconstitution Across Synaptic Partners (GRASP) Defines Cell Contacts and Synapses in Living Nervous Systems. Neuron 57, 353–363.
Fernandes, V.M., Chen, Z., Rossi, A.M., Zipfel, J., and Desplan, C. (2017). Glia relay differentiation cues to coordinate neuronal development in <em>Drosophila</em> Science (80-. ). 357, 886 LP-891. Garofalo, R.S. (2002). Genetic analysis of insulin signaling in Drosophila. Trends Endocrinol. Metab. 13, 156– 162.
Géminard, C., Rulifson, E.J., and Léopold, P. (2009). Remote control of insulin secretion by fat cells in Drosophila. Cell Metab. 10, 199–207.
Hayakawa, Y. (1991). Structure of a growth-blocking peptide present in parasitized insect hemolymph. J. Biol. Chem. 266, 7982–7984.
Hayakawa, Y., and Ohnishi, A. (1998). Cell Growth Activity of Growth-Blocking Peptide. Biochem. Biophys. Res. Commun. 250, 194–199.
Hombría, J.C.-G., Brown, S., Häder, S., and Zeidler, M.P. (2005). Characterisation of Upd2, a Drosophila JAK/STAT pathway ligand. Dev. Biol. 288, 420–433.
Horiuchi, M., Takeda, T., Takanashi, H., Ozaki-Masuzawa, Y., Taguchi, Y., Toyoshima, Y., Otani, L., Kato, H., Sone-Yonezawa, M., Hakuno, F., et al. (2017). Branched-chain amino acid supplementation restores reduced
insulinotropic activity of a low-protein diet through the vagus nerve in rats. Nutr. Metab. 14, 1–12.
Ikeya, T., Galic, M., Belawat, P., Nairz, K., and Hafen, E. (2002). Nutrient-dependent expression of insulin-like peptides from neuroendocrine cells in the CNS contributes to growth regulation in Drosophila. Curr. Biol. 12,
1293–1300.
Kean, L., Cazenave, W., Costes, L., Broderick, K.E., Graham, S., Pollock, V.P., Davies, S.A., Veenstra, J.A., and Dow, J.A.T. (2002). Two nitridergic peptides are encoded by the gene capability in Drosophila melanogaster. Am. J. Physiol. Integr. Comp. Physiol. 282, R1297–R1307.
Kim, J., and Neufeld, T.P. (2015). Dietary sugar promotes systemic TOR activation in Drosophila through AKH-dependent selective secretion of Dilp3. Nat. Commun. 6, 6846.
Koyama, T., and Mirth, C.K. (2016). Growth-Blocking Peptides As Nutrition-Sensitive Signals for Insulin Secretion and Body Size Regulation. PLOS Biol. 14, e1002392.
Lahusen, T., Fereshteh, M., Oh, A., Wellstein, A., and Riegel, A.T. (2007). Epidermal Growth Factor Receptor Tyrosine Phosphorylation and Signaling Controlled by a Nuclear Receptor Coactivator, Amplified in Breast Cancer 1. Cancer Res. 67, 7256–7265.
Lee, H.Y., Yea, K., Kim, J., Lee, B.D., Chae, Y.C., Kim, H.S., Lee, D.W., Kim, S.H., Cho, J.H., Jin, C.J., et al. (2008). Epidermal growth factor increases insulin secretion and lowers blood glucose in diabetic mice. J. Cell. Mol. Med. 12, 1593–1604.
Liu, Y., Liao, S., Veenstra, J.A., and Nässel, D.R. (2016). Drosophila insulin-like peptide 1 (DILP1) is transiently expressed during non-feeding stages and reproductive dormancy. Sci. Rep. 6, 1–15.
Mao, L.-M., and Wang, J.Q. (2016). Regulation of Group I Metabotropic Glutamate Receptors by MAPK/ERK in Neurons. J. Nat. Sci. 2, 1–8.
Masuyama, K., Zhang, Y., Rao, Y., and Wang, J.W. (2012). Mapping Neural Circuits with Activity-Dependent Nuclear Import of a Transcription Factor. J. Neurogenet. 26, 89–102.
McNabb, S.L., Baker, J.D., Agapite, J., Steller, H., Riddiford, L.M., and Truman, J.W. (1997). Disruption of a Behavioral Sequence by Targeted Death of Peptidergic Neurons in Drosophila. Neuron 19, 813–823.
Miura, G.I., Buglino, J., Alvarado, D., Lemmon, M. a, Resh, M.D., and Treisman, J.E. (2006). Palmitoylation of the EGFR ligand Spitz by Rasp increases Spitz activity by restricting its diffusion. Dev. Cell 10, 167–176.
Newsholme, P., Bender, K., Kiely, A., and Brennan, L. (2007). Amino acid metabolism, insulin secretion and diabetes. Biochem. Soc. Trans. 35, 1180–1186.
Nicolai, L.J.J., Ramaekers, A., Raemaekers, T., Drozdzecki, A., Mauss, A.S., Yan, J., Landgraf, M., Annaert, W., and Hassan, B.A. (2010). Genetically encoded dendritic marker sheds light on neuronal connectivity in Drosophila. Proc. Natl. Acad. Sci. 107, 20553–20558.
Oda, Y., Matsumoto, H., Kurakake, M., Ochiai, M., Ohnishi, A., and Hayakawa, Y. (2010). Adaptor protein is essential for insect cytokine signaling in hemocytes. Proc. Natl. Acad. Sci. U. S. A. 107, 15862–15867. Ohnishi, A., Oda, Y., and Hayakawa, Y. (2001). Characterization of Receptors of Insect Cytokine, Growth-blocking Peptide, in Human Keratinocyte and Insect Sf9 Cells. J. Biol. Chem. 276, 37974–37979.
Park, S., Alfa, R.W., Topper, S.M., Kim, G.E.S., Kockel, L., and Kim, S.K. (2014). A genetic strategy to measure circulating Drosophila insulin reveals genes regulating insulin production and secretion. PLoS Genet. 10, e1004555.
Pfeiffer, B.D., Ngo, T.-T.B., Hibbard, K.L., Murphy, C., Jenett, A., Truman, J.W., and Rubin, G.M. (2010). Refinement of tools for targeted gene expression in Drosophila. Genetics 186, 735–755.
Rajan, A., and Perrimon, N. (2012). Drosophila cytokine unpaired 2 regulates physiological homeostasis by remotely controlling insulin secretion. Cell 151, 123–137.
Riemensperger, T., Issa, A.R., Pech, U., Coulom, H., Nguyễn, M.V., Cassar, M., Jacquet, M., Fiala, A., and Birman, S. (2013). A Single Dopamine Pathway Underlies Progressive Locomotor Deficits in a Drosophila Model of Parkinson Disease. Cell Rep. 5, 952–960.
Rodenfels, J., Lavrynenko, O., Ayciriex, S., Sampaio, J.L., Carvalho, M., Shevchenko, A., and Eaton, S. (2014). Production of systemically circulating Hedgehog by the intestine couples nutrition to growth and development. Genes Dev. 28, 2636–2651.
Rosario, W., Singh, I., Wautlet, A., Patterson, C., Flak, J., Becker, T.C., Ali, A., Tamarina, N., Philipson, L.H., Enquist, L.W., et al. (2016). The brain-to-pancreatic islet neuronal map reveals differential glucose regulation from distinct hypothalamic regions. Diabetes 65, 2711–2723.
Rulifson, E.J., Kim, S.K., and Nusse, R. (2002). Ablation of insulin-producing neurons in flies: growth and diabetic phenotypes. Science 296, 1118–1120.
Sano, H. (2015). Coupling of growth to nutritional status: The role of novel periphery-to-brain signaling by the CCHa2 peptide in Drosophila melanogaster. Fly (Austin). 9, 183–187.
Sano, H., Nakamura, A., Texada, M.J., Truman, J.W., Ishimoto, H., Kamikouchi, A., Nibu, Y., Kume, K., Ida, T., and Kojima, M. (2015). The Nutrient-Responsive Hormone CCHamide-2 Controls Growth by Regulating Insulin-like Peptides in the Brain of Drosophila melanogaster. PLoS Genet. 11, 1–26.
regulates the Kv4.2 potassium channel by direct phosphorylation of the pore-forming subunit. Am. J. Physiol. Physiol. 290, C852–C861.
Schweitzer, R., Shaharabany, M., and Seger, R. (1995). Secreted Spitz triggers the DER signaling pathway and is a hmltmg component m embryonic ventral ectoderm determination. Genes Dev. 1518–1529.
Shilo, B. (2003). Signaling by the Drosophila epidermal growth factor receptor pathway during development. Exp. Cell Res. 284, 140–149.
Siegmund, T., and Korge, G. (2001). Innervation of the ring gland of drosophila melanogaster. J. Comp. Neurol.
431, 481–491.
Singh, B., Carpenter, G., and Coffey, R.J. (2016). EGF receptor ligands: recent advances. F1000Research 5, 2270. Slaidina, M., Delanoue, R., Gronke, S., Partridge, L., and Léopold, P. (2009). A Drosophila Insulin-like Peptide Promotes Growth during Nonfeeding States. Dev. Cell 17, 874–884.
Steinhauer, J., Liu, H.H., Miller, E., and Treisman, J.E. (2013). Trafficking of the EGFR ligand Spitz regulates its signaling activity in polarized tissues. J. Cell Sci. 126, 4469–4478.
Sung, E.J., Ryuda, M., Matsumoto, H., Uryu, O., Ochiai, M., Cook, M.E., Yi, N.Y., Wang, H., Putney, J.W., Bird, G.S., et al. (2017). Cytokine signaling through <em>Drosophila</em> Mthl10 ties lifespan to environmental stress. Proc. Natl. Acad. Sci.
Tanimoto, H., Itoh, S., ten Dijke, P., and Tabata, T. (2000). Hedgehog Creates a Gradient of DPP Activity in Drosophila Wing Imaginal Discs. Mol. Cell 5, 59–71.
Tsruya, R., Schlesinger, A., Reich, A., Gabay, L., Sapir, A., and Shilo, B.-Z. (2002). Intracellular trafficking by Star regulates cleavage of the Drosophila EGF receptor ligand Spitz. Genes Dev. 16, 222–234.
Tsuzuki, S., Matsumoto, H., Furihata, S., Ryuda, M., Tanaka, H., Jae Sung, E., Bird, G.S., Zhou, Y., Shears, S.B., and Hayakawa, Y. (2014). Switching between humoral and cellular immune responses in Drosophila is guided by the cytokine GBP. Nat. Commun. 5, 1–11.
Veenstra, J.A., Agricola, H.-J., and Sellami, A. (2008). Regulatory peptides in fruit fly midgut. Cell Tissue Res.
334, 499–516.
Wee, P., and Wang, Z. (2017). Epidermal growth factor receptor cell proliferation signaling pathways. Cancers (Basel). 9, 1–45.
Witek, G., Verhaert, P., Lorenz, M.W., and Hoffmann, K.H. (1999). Immunolocalization of two types of allatostatins in the central nervous system of the cricket Gryllus bimaculatus (Ensifera: Gryllidae). Eur. J. Entomol. 96, 279–285.
Wong, R.W.C., and Guillaud, L. (2004). The role of epidermal growth factor and its receptors in mammalian CNS. Cytokine Growth Factor Rev. 15, 147–156.
Zhang, T., and Li, C. (2013). Mechanisms of amino acid-stimulated insulin secretion in congenital hyperinsulinism. Acta Biochim. Biophys. Sin. (Shanghai). 45, 36–43.
Zhang, Y.Q., Rodesch, C.K., and Broadie, K. (2002). Living synaptic vesicle marker: Synaptotagmin-GFP. Genesis
34, 142–145. Figure Legends
Figure 1: R22H11 neurons present axonal projections making physical contacts with the IPCs
(A) UAS-DenMark; UAS-SyteGFP are driven by the IPCs driver, dilp2-GAL4. The dendritic marker DenMark is used to visualize the IPCs dendrites (red), and SyteGFP reveals their axonal architecture (green).
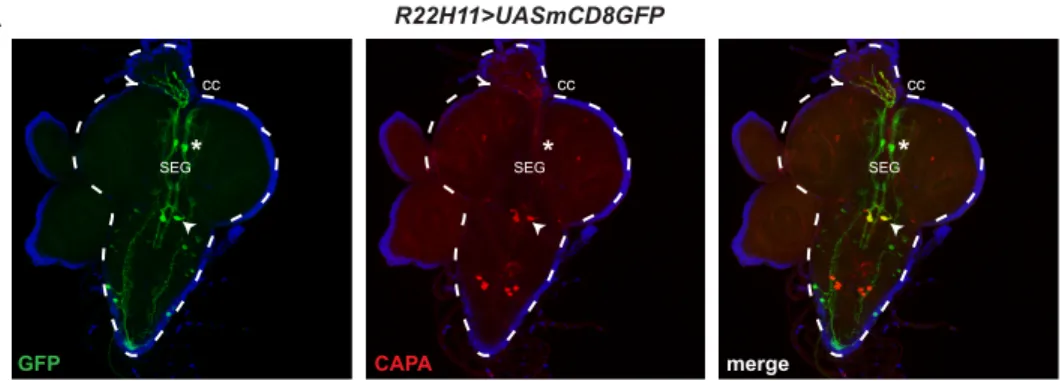
(B) The R22H11-GAL4 line drives mCD8GFP (green) in one neuron in each brain hemisphere, sending projections towards the IPCs (anti-Dilp2, red) (hereafter referred as ICNs, see text).
(C) Expression of UAS-DVglut::GFP (a vesicular transporter of glutamate) driven by R22H11-GAL4 (hereafter referred to as icn-Gal4) labels presynaptic vesicles (green). Analysis of z sections reveals that ICNs axons (green) co-localize with the IPCs (anti-Dilp2, red) along their neuronal tracts and cell bodies.
(D) GFP reconstitution across synaptic partners (GRASP) shows physical connections between IPCs and ICNs. icn-LexA and dilp2-GAL4 are used to express membrane-tethered split-GFP
LexAop-CD4::spGFP11 and UAS-CD4::spGFP1-10, respectively. IPCs are stained by the anti-Dilp2 (cyan) and
ICNs are labeled with a membrane associated RFP (dsRed, red). The GRASP signal is visualized in green.
CC: Corpora Cardiaca SEG: Subesophageal ganglion See also Figure S1.
Figure 2: ICNs inhibit body growth by blocking Dilps secretion
(A) Pupal volume measurement after ICNs ablation (icn>hid), hyperpolarization (icn>kir2.1), blockade of secretory activity (icn>tetx) or chronic depolarization (icn>nachbac). (n≥238)
(B) Pupal volume measurement after ICNs ablation (icn>hid) in high protein diet (2x) and low protein diet (0,3x). (n≥75)
(C) Dilp2 accumulation levels in the IPCs upon ICNs ablation (icn>hid), hyperpolarization (icn>kir2.1) secretion blockade (icn>tetx) or depolarization (icn>nachbac). (n≥62) Fluorescence intensity is measured as delta ratio compared to control (icn>w).
(D) ELISA test of Dilp2HF (gd2HF) circulating levels in the hemolymph upon ICNs ablation (icn>hid), hyperpolarization (icn>-kir2.1), secretion blockade (icn>tetx) or depolarization (icn>nachbac). (n≥4 for 3 independent experiments)
(E) Larval growth curve after ICNs ablation (icn>hid), compared to controls (icn>w and w hid). (n≥57). In all graphs, means are shown and errors bars represent ±SEM, ****p<0,0001, **p<0,01, *p<0,05. See also Figure S2.
Figure 3: IPCs and ICNs show antagonistic regulation by nutrition and developmental stage
A. Analysis of IPCs neuronal activity in fed and starved (1% sucrose) conditions using the calcium reporter UAS-CaLexA crossed with dilp2-Gal4. (n≥68)
B. Analysis of ICNs neuronal activity in fed and starved (1% sucrose) conditions using the calcium reporter UAS-CaLexA crossed with icn-Gal4. (n≥56)
C. Analysis of IPCs neuronal activity at 80h AEL and 120h AEL (wandering stage) using the calcium reporter UAS-CaLexA crossed with dilp2-Gal4. (n≥48)
D. Analysis of ICNs neuronal activity at 80h AEL and 120h AEL (wandering stage) using the calcium reporter UAS-CaLexA crossed with icn-Gal4. (n≥69)
Figure 4: Growth-Blocking-Peptides (GBPs) are putative EGF ligands inducing systemic body growth when expressed in the ICNs
A. Ectopic expression of gbp1 or gbp2 in the ICNs (icn>gbp1 and icn>gbp2) leads to increased pupal volume. (n≥408)
B. Dilp2 signal in IPCs decreases upon gbp1 and gbp2 ectopic expression in ICNs. (n≥34)
C. GBP1 induces tyrosine auto-phosphorylation of EGFR in S2 cells (co-culture of GBP1::HA expressing cells with EGFR::V5 expressing cells, immunoprecipitation with anti-phospho-Tyr antibodies, western blotting using anti-V5 antibody).
D. Co-culture of EGFR::V5 expressing cells with either GBP1- or GBP2-expressing cells tested for ERK phosphorylation (pERK). The EGFR ligand Spitz (cSpi::GFP) and Hedgehog-HA (Hh::HA) are used as positive and negative controls, respectively.
E. ERK phosphorylation (pERK) induction upon ectopic gbp1 expression in the Hedgehog expressing domain of the wing pouch (hh>mcherry; gbp1).
F. ERK phosphorylation (pERK) observed upon ectopic gbp1 expression in the wing pouch (nub>gbp1) requires EGFR (nub>egfrRi, gbp1).
G. Ectopic gbp1 and gbp2 expression in the wing pouch using nub-GAL4 driver (nub>gbp1 and
nub>gbp2) induce extra veins (L2) (n≥51).
In graphs, means are shown and errors bars represent ±SEM, ****p<0,0001. See also Figure S3.
Figure 5: GBP1 in the ICNs promotes body growth through EGFR signaling pathway
A. Pupal volumes after silencing egfr (icn>egfrRi) or dsor, (icn>dsorRi) or activating EGFR signaling (icn>egfrA887T) in ICNs. (n≥83)
B. IPCs-Dilp2 retention after silencing egfr (icn>egfrRi) or dsor, (icn>dsorRi) or activating EGFR signaling (icn>egfrA887T) in ICNs. (n≥58)
C. Pupal volumes after ectopic expression of gbp1 alone (icn>gbp1), or upon co-silencing EGFR (icn>egfrRi, gbp1) in the ICNs. (n≥77)
D. IPCs-Dilp2 accumulation after ectopic expression of gbp1 alone (icn>gbp1), or upon co-silencing EGFR (icn>egfrRi, gbp1) in the ICNs. (n≥57)
In graphs, means are shown and errors bars represent ±SEM, ****p<0,0001. See also Figure S4.
Figure 6: Fat body-derived GBP1 is secreted in the hemolymph and acts on ICNs neuronal activity through EGFR
A. Western blotting experiment (anti-HA) on hemolymph extracts and dissected fat bodies from
lpp>gbp1::HA larvae in either fed or acute amino acids starvation state.
B. Brain culture with hemolymph collected from control larvae or larvae overexpressing gbp1 in the fat body (lpp>gbp1) tested for IPC-Dilp2 retention. Brains were extracted from either icn>w control or
icn>egfrRi animals. (n≥48)
C. Brain culture with hemolymph collected from control larvae, larvae overexpressing gbp1 in the fat body (lpp>gbp1) or larvae deficient for gbp1 and gbp2 (ex67-/-) tested for ICNs neuronal activity using the CalexA calcium marker (icn>calexa). (n≥47)
D. The CaLexA reporter is used to test ICNs activity upon constitutive active EGFR expression (icn>calexA, egfrA887T) at late wandering stage (123h. AEL). (n≥44)
E. The CaLexA reporter is used to test ICNs activity upon silencing EGFR expression (icn>calexA, egfrRi) during L3 feeding stages (96h. AEL). (n≥33)
F. GBP1::HA (green) specifically expressed in the fat body (lpp>gbp1::HA) is detected in the ICNs, labelled with an anti-Tachykinine (dTK, red) antibody.
In graphs, means are shown and errors bars represent ±SEM, ****p<0,0001, **p<0,01. See also Figure S5.
STAR Methods
Contact for reagent and resource sharing
Further information and requests for resources and reagents should be directed to and will be fulfilled by the Lead Contact, Pierre Léopold (pierre.leopold@curie.fr).
Experimental model and Subject Details
Fly strains and maintenance
The following fly strains were used: white1118 (w), dilp2-GAL4 (Rulifson et al., 2002), hh-GAL4 (Tanimoto et al., 2000), nubbin-GAL4 (Azpiazu and Morata, 2000), lpp-GAL4 (gift from S. Eaton),
lexAop-CD8-GFP-2A-CD8-GFP; UAS-mLexA-VP16-NFAT, LexAop-rCD2-GFP (gift from Jing W. Wang), UAS-dvglut::GFP (gift from S. Birman), UAS-sun (gift from W Ja), UAS-upd2 (gift from N. Perrimon). K.
Mirth and T. Koyama kindly provided the following lines: UAS-gbp1, UAS-gbp2, ex67-/-. The UAS-mspi,
R22H11-GAL4 (RRID:BDSC 48043) (Pfeiffer et al., 2010) and R22H11-LexA (RRID:BDSC_54109) lines come from Janelia Farm (BDSC).
RNAi lines come from the Vienna Drosophila RNAi Stock Center: UAS-egfrRi (107130KK), UAS-dsorRi (107276KK).
UAS-hid; UAS-tetx; UAS-kir2.1; UAS-NaChBac; UAS-egfrA887T; EH-GAL4 (C21); mCD8-GFP;
UAS-mcherry; CAPA-GAL4; UAS-DenMark, UAS-syteGFP and rCD2-RFP; UAS-CD4-spGFP1-10, lexAop-CD4-spGFP11were provided by the Bloomington Drosophila Stock Center.
Animals were reared at 25°C on fly food containing per liter, 10g of agar, 83g corn flour, 60g white sugar, 34g dry yeast and 3,75g Moldex (diluted in ethanol). For all experiments, both males and females have been used.
In Fig1 and S1, wandering larvae were dissected. Pupae were measured at day 2 after pupariation. Dilp2 and Dilp5 stainings were done on L3 larvae (96 hours after egg laying). The CaLexA experiments were made on L3 or wandering larvae, depending on the condition (explained on each figure legend). Wings were collected at day 1 after adult emergence. Wing discs from wandering larvae were stained. Hemolymph and fat bodies for western blots were collected from L3 larvae (96 hours after egg laying). Brains of L3 larvae (96 hours after egg laying) were used for qPCR experiments. Feeding behavior assay was done on L3 larvae (96 hours after egg laying).
Cell culture
S2R+ cells were maintained in Schneider medium supplemented with 10% FBS and 1% streptomycin at 22°C. All UAS plasmids were co-transfected with actin-GAL4 using lipofectamine (ThermoFisher Scientific).
Method Details
Plasmids and generation of transgenic lines
gbp1 and gbp2 coding sequences were PCR amplified from DGRC cDNA clones IP05665 and GH14572
respectively. They were cloned into the pENTR/D-TOPO vector using the following gene-specific primers: sense primer CAC CGA ATT CAG GAT GTT GAT ACG TAT TAA TCC ATT GGT G and antisense primer CCG GAA TTC CGC CGG CTT TCT GCA TCG TTT TCC for gbp1 and sense primer CAC CGG TAC CAG GAT GTT TTT GCA ACT CTT ATC TAT A and antisense primer CCG GGT ACC GGC TTC CTT CCT GCA ACG TCC TGC for gbp2. To generate the UAS-gbp1::HA and UAS-gbp2::HA lines, coding sequences were cloned into the Gateway Destination vector (Drosophila Gateway Vector Collection) the pTWH.
UAS-gbp1::HA construct was then introduced into the germ line by injections in w1118 fly line (BestGene).
pBDP2 gdilp2-BHA-FLAGA (gift from S. K. Kim) was injected in the Bloomington stock #24484 to generate a new y1 w1118; gd2HF(attP2). J. Treisman kindly provided the mt-egfr::V5 and UAS-cSpi::GFP plasmids. UAS-hh::HA was kindly provided by K. Basler.
Fly Media
Our experiments are usually performed on a rich protein diet containing per liter, 10g of agar, 83g corn flour, 60g white sugar, 34g dry yeast and 3,75g Moldex (diluted in ethanol). The low protein diet or 0,3x media used in Figure 2B contains per liter, 10g of agar, 83g corn flour, 60g white sugar, 5g dry yeast and 3,75g Moldex (diluted in ethanol).
Amino acids starvation
72h AEL larvae are transferred for 16h on PBS 1x, 2% agar plates and supplemented with 1% sugar, but no protein source.
Feeding behavior
Blue food dye (Erioglaucine Disodium Salt, Sigma-Aldrich) was added at 1,5% in the food. Larvae were left in blue food for 3 hours at 25°C, washed, put in microtubes (8 larvae per tube), and frozen. Samples were homogenized in water and spun down for 5 min at 13000 rpm, and the amount of blue dye in the supernatant was measured by spectrophotomy (OD629 Nanovue). n represents biological replicates. For a given experiment all values are normalized to one single condition.
Pupal volume analysis
Larvae were synchronized at 24h AED and reared under controlled conditions (30 larvae/vial). Pupal volume was measured using ImageJ and calculated by using the formula
n represents pupae number. For a given experiment, all values are normalized to one control condition to give the “∆ pupal volume ratio”.
Ex vivo Organ culture
We performed ex vivo organ culture as described in (Géminard et al., 2009). Brains of staged larvae (96 hours after egg laying) were dissected in Schneider (Sigma) using sterile tools. Brains were transferred into tube containing 30µl of Schneider medium supplemented with 2,5% FBS and 1% streptomycin. 20µl of hemolymph was collected from larvae and carefully added to dissected brains. Co-cultures were incubated overnight at 18°C.
Immunofluorescence on larval tissues
Larval tissues were dissected in 1x PBS, fixed in 4% formaldehyde (Polyscience) in PBS for 30 min at room temperature and then washed several times in PBS containing 0,3% Triton X-100 (PBT). They were then blocked into PBT+10% FBS. Primary antibodies were incubated overnight at 4°C. After several washes, secondary antibodies were incubated 2h at room temperature. Dissected tissues were mounted into Vectashield (Vector). Fluorescence images were acquired using a Leica SP5 DS confocal microscope.
The following antibodies were used: rabbit anti Dsred (used to visualize mcherry) (1/200) (632496 Clontech), chicken anti GFP (1/10000) (ab13970 abcam), rat anti Dilp2 (1/400) (Géminard et al., 2009), rabbit anti Dilp5 (Géminard et al., 2009) rabbit anti pERK (1/200) (4370S Cell Signalling), rat anti HA (1/200) (3F10 Sigma). The rabbit anti lTK (Aedes locusta tachykinin used to visualize dTK) (1/500), rabbit anti CAPA precursor (1/500) (Kean et al., 2002), rabbit anti MIP (myoinhibitory peptide) (1/500) (Witek et al., 1999) and rabbit anti Dilp3 (1/1000) (Veenstra et al., 2008) were kindly gifted by J. Veenstra.
Fluorescence quantification
After acquisition of confocal z stacks of dissected tissue with a 0,5µm step and identical laser power and scan settings, images were analyzed by ImageJ. We performed the sum-intensity 3D projections to measure total fluorescent intensity across the object of interest (IPCs or ICNs) and substracted the background fluorescent intensity. For a given experiment, all values are normalized to one control condition to give the “∆ fluorescent intensity ratio” (Dilp2 or GFP accumulation). n represents the IPCs cluster or the ICNs number.
For ex-vivo organ culture presented in Fig 6E, GFP positive cells were counted instead of total fluorescent intensity. For a given experiment, all values are normalized to one control condition to give the “∆ GFP positive cell ratio”. n represents the ICNs number.
Hemolymph collection
Hemolymph was collected as described in Rodenfels et al. (2014). It was obtained by bleeding larvae in ice cold PBS 1x. To remove hemocytes, a first centrifugation at 500g for 30min is performed and then followed by a second one at 16000g for 20min at 4°C to remove cellular fragments. The supernatant is then directly used for western blotting.
Protein extraction
After dissection, 5 to 10 fat bodies were transferred in an eppendorf with 60µl of RIPA buffer containing protease (Complete – Roche) and phosphatase inhibitor cocktails (Thermo Scientific). Tissues were then manually disrupted. Samples were then rotated for 30min at 4°C and then spun down at full speed, 4°C for 10min. Proteins were precipitated from the supernatant with chloroform-methanol mix (except for S2 cells extract). Pellets were dried 5 min and then dissolved into 1,5mM Tris, 6M Urea and inhibitor cocktails. Proteins measurements were done with the Bio-Rad Protein Assay (Bradford) (BIO-RAD).
Blue 4x (NuPage, Novex) and reducing agent 10x (NuPage, Novex) were added before heating at 100°C 5min.
Cell culture and phospho-MAPK assay
For the phospho-MAPK assay, on day 3 after transfection with mt-egfr::V5, S2R+ cells were treated with 100µM of CuSO4 to induce EGFR::V5 expression. On day 4, cells transfected with GAL4-UAS plasmids were resuspended in Schneider medium and cocultured with EGFR::V5 expressing cells for 3 hours at 22°C. Cells were harvested and proteins were extracted.
Western Blotting
Proteins were resolved by SDS-PAGE 12% gels (NuPage, Novex gel, Invitrogen) using the MOPS running buffer and transferred electrophoretically to Nitrocellulose membranes (Biorad). Membranes were incubated 30 minutes in blocking buffer PBS-T (1X PBS, 0,1% Tween-20, 5% milk), and then incubated in the same buffer with primary antibodies, overnight at 4°C. After several washes, membranes were incubated 2h with PBS-T containing the secondary antibody and then washed again. Chemiluminescence was observed using the ECL Western Blotting detection system (ThermoFisher scientific). Images were taken with the Fujifilm Multi Gauge software and analyzed using imageJ.
The following antibodies were used: rabbit anti ERK (1/2000) (4695 Cell Signalling), rabbit anti pERK (1/2000) (4370S Cell Signalling), rat anti HA (1/500) (3F10 Sigma), guinea pig anti Cvd (1/2000) (gift from S. Eaton), mouse anti tubulin (1/2000) (T9026 Sigma).
Immunoprecipitation
A protein A or G-sepharose beads with CL6B beads mix was incubated with the primary antibody 3h at 4°C, after several washes in IP buffer (50mM Tris pH8, 150mM NaCl, 1mM EGTA, 10%NAF, protease (Complete – Roche) and phosphatase inhibitor cocktails (Thermo Scientific). After proteins extraction, 800µg of proteins were added to the mix and rotated at 4°C overnight. After several washes, blue 4x (NuPage, Novex) and reducing agent 10x (NuPage, Novex) were added and samples were heated at 100°C 5min.
The following antibodies were used: rabbit anti phospho-tyrosine (1/1000) (8654S Cell Signalling) and mouse anti V5 (1/2000) (R960-25 Invitrogen).
ELISA Test
Experimental procedure was adapted from Park et al. (2014). The ELISA plates were coated with anti-Flag (Sigma-Aldrich F1804) in coating buffer (0.2M sodium carbonate/bicarbonate buffer, pH9.4; BuPH Carbonate-Bicarbonate buffer Packs ThermoFisher #28382) and incubated overnight at 4°C. After several washes in PBS + 0,2% Tween 20 (PBTw0,2%), the plate was blocked in PBS + 2% BSA overnight at 4°C.
1µl or 2µl of hemolymph was transferred in 55µl of PBS, centrifuged at 1000g for 1min and 50µl of supernatant was transferred in PCR strips. As standards, the FLAG(GS)HA peptides (0-10ng/ml) are prepared in PCR strips. 5µl of diluted anti-HA-Peroxydase (High Affinity Roche 3F10, 12013819001) in PBTw0,2% (1/500) was added to samples/standards. After blockage, samples were transferred into the Nunc-Immuno modules and incubated overnight at 4°C. After several washes in PBTw0,2%, the Step Ultra TMB - ELISA Substrate (Thermo Scientific 34029) was added, incubated for 30 min at room temperature and then, 2M sulfuric acid was added to stop the reaction. Absorbance was measured at 450nm using the DLReady device (Berthold Technologies, Centro LB960).
n represents biological replicates.
Quantitative RT-PCR
qRT-PCR experimental procedure is described in (Delanoue et al., 2010). We dissected 15 brains per sample. n represents biological replicates.
Dilp2 primers: sense primer ATCTGGACGCCCTCAATCC and antisens primer TCCCAGGAAAGAGGGCACTT
Dilp5 primers: sense primer GCCTGTCCCAATGGATTCAA and antisens primer AGCTATCCAAATCCGCCAAGT
RP49 primers: sense primer CTTCATCCGCCACCAGTC and antisens primer CGACGCACTCTGTTGTCG
Wing analysis
Adult flies were collected, stored in ethanol and wings were mounted in Euparal solution. Pictures were acquired using a Leica Fluoresce StereomicroScope M205 FA with a Leica digital camera MC 190 HD. n represents the wings number.
Quantification and Statistical Analysis
P values are the result of ANOVA or Student’s t test provided by Graphpad Prism (*p<0,05; **p<0,01; ***p<0,001, ****p<0,0001). Significance of calcium activity quantification in Figure 3 and Figure 6D and 6E were calculated with Student’s t test. Statistical analyses of the other figures were performed using one-way ANOVA.
Supplemental information titles and legends
Figure S1: Complete expression pattern of the R22H11 driver. Related to Figure 1
A. The R22H11-GAL4 line drives mCD8GFP (green) in one neuron in each brain hemisphere, (hereafter referred as ICNs, see text) indicated by an asterisk*, and in one pair of CAPA positive neurons (red), shown with a white arrowhead. CC: Corpora Cardiaca SEG: Subesophageal ganglion
Figure S2: Overgrowth phenotypes are exclusively due to the ICNs effect on Dilps secretion, with no effect on developmental timing, feeding behavior nor dilp2 expression. Related to Figure 2.
A. Pupal volume measurements in all control conditions (icn>w, w UAS-). (n>94)
B. Pupal volume measurements after CAPA neurons ablation (capa>hid), hyperpolarization (capa>kir2.1), blockade of secretory activity (capa>tetx) or chronic depolarization (capa>nachbac). (n>60)
C. Developmental timing measurements after ICNs ablation (icn>hid). (n>40) D. Feeding behavior was tested after ICNs ablation (icn>hid). (n=9)
E. dilp2 mRNA levels in dissected brains were quantified upon ICNs ablation (icn>hid), hyperpolarization (icn>kir2.1), secretion blockade (icn>tetx) or depolarization (icn>nachbac). (n=3) F. dilp5 mRNA levels in dissected brains were quantified upon ICNs ablation (icn>hid), hyperpolarization (icn>kir2.1), secretion blockade (icn>tetx) or depolarization (icn>nachbac). (n=3) G. Dilp5 accumulation levels in the IPCs upon ICNs ablation (icn>hid), hyperpolarization (icn>kir2.1) secretion blockade (icn>tetx) or depolarization (icn>nachbac). (n>40) Fluorescence intensity is measured as delta ratio compared to control (icn>w).
H. Dilp3 accumulation levels in the IPCs upon ICNs ablation (icn>hid), hyperpolarization (icn>kir2.1) secretion blockade (icn>tetx) or depolarization (icn>nachbac). (n>40) Fluorescence intensity is measured as delta ratio compared to control (icn>w).
In graphs, means are shown and errors bars represent ±SEM.
Figure S3: GBPs stimulate body growth specifically through ICNs. Related to Figure 4. A. Pupal volume measurements in all control conditions (icn>w, w UAS-). (n>60)
B. Pupal volume measurements upon ectopic expressions of the fat body signals sun (icn>sun) and
upd2 (icn>upd2) in ICNs. (n>144)
C. Pupal volume measurements upon gbp1 (lpp>gbp1) or gbp2 (lpp>gbp2) overexpression in the fat body. (n>67)
D. Pupal volume measurements upon ectopic expressions of gbp1 and gbp2 in the EH (eclosion hormone) neurons (eh>gbp1 and eh>gbp2). (n>75)
E. Pupal volume measurements upon ectopic expressions of gbp1 and gbp2 in the CAPA neurons (capa>gbp1 and capa>gbp2). (n>88)
F. gbp1 overexpression in the fat body using lpp-GAL4 driver (lpp>gbp1) does not induce extra veins (L2). (n>15)
In graphs, means are shown and errors bars represent ±SEM, ****p<0,0001, **p<0,01.
Figure S4: Activation of EGFR signaling in ICNs promotes body growth via its effect on Dilps secretion without altering the ICNs identity nor dilps expression. Related to Figure 5.
A. Pupal volume measurements in all control conditions (icn>w, w UAS-). (n>44)
B. Quantification of dilp2 mRNA levels in dissected brains upon EGFR signaling pathway inhibition (icn>egfrRi and icn>dsorRi) or activation (icn>egfrA887T) in the ICNs. (n=3)
C. Pupal volume measurements upon EGFR signaling pathway inhibition (capa>egfrRi, capa>dsorRi) or activation (capa>egfrA887T) in the CAPA neurons. (n>83)
D. Pupal volume measurements upon ectopic expressions in the ICNs of a secreted activated form of Spitz (icn>sspi), its membrane-tethered form (icn>UAS-nrt::sspi) or the unprocessed form of Spitz (icn>UASmspi). (n>62)
E-E’. ICNs labelled by GFP (green) and either dTK (tachykinin) (E, red) or MIP (Myoinhibitory peptide) (E’, red) antibodies upon EGFR signaling inhibition (icn>mCD8GFP, egfrRi and -dsorRi) or activation (icn>mCD8GFP, egfrA887T).
F. Pupal volumes after ectopic expression of gbp1 alone (icn>gbp1), or upon co-silencing dsor (icn>dsorRi,gbp1) in the ICNs. (n>55)
In graphs, means are shown and errors bars represent ±SEM, ****p<0,0001, **p<0,01, *p<0,05.
Figure S5: The fusion protein GBP1::HA is functional and can be used to study secretion and localization of GBP1. Related to Figure 6.
A. Pupal volumes after overexpression of the fusion protein GBP1::HA in the fat body (lpp>gbp1::HA). (n>48)
B. Pupal volumes after overexpression of the fusion protein GBP1::HA in the ICNs (icn>gbp1::HA). (n>62)
C. GBP1::HA containing vesicles stained in the fat body upon fed condition and acute amino acids starvation (lpp> gbp1::HA). Scale bar represents 2,5μm.
D. GBP1::HA (green) stainings in the ICNs, labelled with dTK (red) antibody in control genotypes (lpp>w and w gbp1::HA).
GFP Dilp2 merge
B
C
D
z = 54 z = 67 z = 81 z = 91 z = 100 z = 33 Dilp2 GFPDilp2 Dsred reconstituted GFP merge
A
mCherry syt.eGFP merge
dilp2>UASDenMark; syteGFP R22H11>UASmCD8GFP R22H11>UAS-dvGlut::GFP R22H11LexA; dilp2>GRASP SEG SEG SEG cc cc cc SEG SEG SEG
A
icn>hid icn>w
icn>w w hid icn>hid 120h AEL
icn>w icn>hid icn>kir2.1
icn>tetx icn>nachbac
C
D
E
Δ pupal volume ratio -0,2
0,0 0,2 0,4 icn>w icn>hid icn>kir2.1 icn>tetx icn>nachbac
****
+15,6%****
+7%****
+11% nsΔ pupal volume ratio -0,2 0,0 0,2 0,4 0,6
icn>w 0,3x icn>hid 0,3x icn>w 2x
****
+18,9%****
+22,9% ns ΔDilp2 accumulation ratio
0,0 1,0 -1,0 icn>w icn>hid icn>kir2.1 icn>tetx icn>nachbac
****
-46% -47,6%****
-45,9%****
2,0****
+50,9% 0,0 0,5 1,0 -0,5 ΔDilp2 circulating levels ratio
*
+40,2%****
+75,5%****
+80,2%*
-41% icn>hid icn>w icn>kir2.1 icn>tetx icn>nachbac 72h 96h 120h AEL 0,0 0,5Larval volume ratio
1,0
*
+12,3%**
+18,6% icn>w w hid icn>hidB
A
B
C
D
Fed dilp2>calexa Starved Fed icn>calexa Starved
L3 dilp2>calexalate wandering L3 icn>calexalate wandering Fed Starved Δ GFP accumulation ratio 0 20 40 60 80
****
x20 Δ GFP accumulation ratio 0 5 10****
x2 L3 late wandering Fed Starved Δ GFP accumulation ratio 0 5 10****
x4,1 L3 late wandering Δ GFP accumulation ratio 0 10 20****
x6,8A
icn>w icn>gbp1 icn>gbp2B
GBP1::HA + EGFR::V5 EGFR::V5 GBP1::HA no DNA inputs αV5 IP αphosphoY WB αV5C
pERK GBP1::HA + EGFR::V5 GBP2::HA + EGFR::V5 cSpi::GFP + EGFR::V5 Hh::HA + EGFR::V5 ERKD
pERK pERK nub>w nub>gbp1 pERK pERK nub>egfrRi, gbp1 nub>egfrRiF
-0,2 0,0 0,2 0,4Δ pupal volume ratio
****
+9,9% +9,6%****
icn>gbp2 icn>gbp1 icn>w icn>w icn>gbp1 icn>gbp2 ΔDilp2 accumulation ratio
-0,5 0,0 0,5 1,0 -1,0
****
-50,4% -46,5%****
nub>w nub>gbp1 nub>gbp2
G
nub>w nub>gbp1 nub>gbp2 0 20 40 60 80 100****
61%****
66%Penetrance of extra vein
phenotype (%) Extra wing veins
control
pERK mcherry merge
hh>mcherry ; gbp1
pERK mcherry merge
hh>mcherry ; w
E
150 250 kDa 150 250 37 50 kDa 37 50A
icn>egfrRi icn>egfrRi, gbp1 icn>gbp1 icn>w icn>egfrRi icn>w icn>egfrA887T icn>dsorRiB
C
D
icn>w icn>egfrRi icn>dsorRi icn>egfr A887T -0,2 0,0 0,2Δ pupal volume ratio
****
-8,3% -8,7%****
****
+8,7% icn>w icn>gbp1 icn>egfrRi icn>egfrRi, gbp1 -0,2 0,0 0,2Δ pupal volume ratio
****
+8,3%****
-8,3% -7,3%****
ns icn>w icn>egfrRi icn>dsorRi icn>egfr A887T 0,0 2,0 4,0 ΔDilp2 accumulation ratio
****
+110%****
+152%****
-51% 0,0 2,0 4,0 icn>w icn>gbp1 icn>egfrRi icn>egfrRi, gbp1 ΔDilp2 accumulation ratio
****
+110% +97%