HAL Id: hal-01806759
https://hal.archives-ouvertes.fr/hal-01806759
Submitted on 15 Jun 2021
HAL is a multi-disciplinary open access
archive for the deposit and dissemination of
sci-entific research documents, whether they are
pub-lished or not. The documents may come from
teaching and research institutions in France or
abroad, or from public or private research centers.
L’archive ouverte pluridisciplinaire HAL, est
destinée au dépôt et à la diffusion de documents
scientifiques de niveau recherche, publiés ou non,
émanant des établissements d’enseignement et de
recherche français ou étrangers, des laboratoires
publics ou privés.
Radiocarbon Measurements of Small-Size Foraminiferal
Samples with the Mini Carbon Dating System
(MICADAS) at the University of Bern: Implications for
Paleoclimate Reconstructions
Julia Gottschalk, Sönke Szidat, Elisabeth Michel, Alain Mazaud, Gary
Salazar, Michael Battaglia, Jörg Lippold, Samuel Jaccard
To cite this version:
Julia Gottschalk, Sönke Szidat, Elisabeth Michel, Alain Mazaud, Gary Salazar, et al.. Radiocarbon
Measurements of Small-Size Foraminiferal Samples with the Mini Carbon Dating System (MICADAS)
at the University of Bern: Implications for Paleoclimate Reconstructions. Radiocarbon, University of
Arizona, 2018, 60 (2), pp.469-491. �10.1017/RDC.2018.3�. �hal-01806759�
Radiocarbon, 2018, p. 1–23 DOI:10.1017/RDC.2018.3 © 2018 by the Arizona Board of Regents on behalf of the University of Arizona
RADIOCARBON MEASUREMENTS OF SMALL-SIZE FORAMINIFERAL SAMPLES WITH THE MINI CARBON DATING SYSTEM (MICADAS) AT THE UNIVERSITY OF BERN: IMPLICATIONS FOR PALEOCLIMATE RECONSTRUCTIONS
Julia Gottschalk1*• Sönke Szidat2• Elisabeth Michel3• Alain Mazaud3• Gary Salazar2•
Michael Battaglia2• Jörg Lippold1,4• Samuel L Jaccard1
1
Institute of Geological Sciences and Oeschger Center for Climate Change Research, University of Bern, Bern, Switzerland.
2
Department of Chemistry and Biochemistry and Oeschger Centre for Climate Change Research, University of Bern, Bern, Switzerland.
3
Laboratoire des Sciences du Climat et de l’Environnement, LSCE/IPSL, CNRS-CEA-UVSQ, Université de Paris-Saclay, Gif-sur-Yvette, France.
4
Institute of Earth Sciences, Heidelberg University, Heidelberg, Germany.
ABSTRACT. Radiocarbon (14C) measurements of foraminifera often provide the only absolute age constraints in marine sediments. However, they are often challenging as their reliability and accuracy can be compromised by reduced availability of adequate sample material. New analytical advances using the MIni CArbon DAting System (MICADAS) allow 14C dating of very small samples, circumventing size limitations inherent to conventional 14C measurements with accelerator mass spectrometry (AMS). Here we use foraminiferal samples and carbonate standard material to assess the reproducibility and precision of MICADAS 14C analyses, quantify contamination biases, and determine foraminiferal 14C blank levels. The reproducibility of conventional 14C ages for our planktic (benthic) fora-miniferal samples from gas measurements is 200 (130) yr, and has good precision as illustrated by the agreement between both standards and their reference values as well as between small gas- and larger graphitized foraminiferal samples (within 100 ± 60 yr). We observe a constant contamination bias and slightly higher 14C blanks for foramini-fera than for carbonate reference materials, limiting gas (graphite) 14C age determinations for foraminifera from our study sites to ~38 (~42) kyr. Our findings underline the significance of MICADAS gas analyses for 14C on smaller-than-conventional sized foraminiferal samples for paleoclimate reconstructions and dating.
KEYWORDS: 14C backgrounds, AMS dating, foraminifera, Indian Ocean, MICADAS.
INTRODUCTION
Radiocarbon (14C) analysis is a versatile method to date and characterize material from various geological archives such as speleothems, marine sediment cores, ice cores, and terrestrial sequences. Several milligrams of carbonate are required for conventional 14C analysis (invol-ving sample graphitization), while the lowest limit is about 100–250 µg C (~0.8–2 mg CaCO3) in most laboratories. The smaller and older the sample, the stronger may be the impact of con-tamination (for example with modern atmospheric carbon) causing higher inherent age uncertainties (Vogel et al. 1987; Brown and Southon 1997; Ruff et al. 2010a; Bard et al. 2015). For paleoclimate reconstructions, this can be an issue owing to low sample availability.
Limitations related to conventional measurements and the reduced availability of carbonaceous or carboniferous sample material in some regions and climate archives have increased the demand for 14C analyses of small to ultra-small samples. This has led several laboratories world-wide to push analytical boundaries of accelerator mass spectrometry (AMS) towards smaller samples over the last decades (e.g., Pearson et al. 1998; Schleicher et al. 1998; Hua et al. 2004; Santos et al. 2007a; Ruff et al. 2010a; Smith et al. 2010; Delqué-Kolic et al. 2013; Wacker et al. 2013a; Szidat et al. 2014; Shah Walter et al. 2015; Freeman et al. 2016). Efforts to expedite small-size 14C measurements with conventional graphite targets have for instance concentrated on improving the performance of the iron catalyst powder (Freeman et al. 2016), decreasing reactor volumes (Shah Walter et al. 2015), adjusting the pretreatment conditions of the iron powder (Hua et al. 2004), and/or varying the temperature during CO2 reduction (Santos et al. 2007a).
*Corresponding author. Email: julia.gottschalk@geo.unibe.ch
Downloaded from https://www.cambridge.org/core. Queen Mary University, on 22 Mar 2018 at 15:19:34, subject to the Cambridge Core terms of use, available
2 J Gottschalk et al.
New designs such as the MIni CArbon DAting System (MICADAS) fitted with a gas ion source allow online analysis of small-size samples in gas form, and thus the omission of sample graphitization (Synal et al. 2007; Synal 2013; Ruff et al. 2010b; Wacker et al. 2010a). The MICADAS requires smaller voltages (200 kV) to suppress equal-mass molecules (e.g., 13C1H,
12
CD, 12CH2, 7Li2) by destroying their molecular integrity in the collision/stripping unit (Suter et al. 1997; Synal et al. 2000; Schulze-König et al. 2011), and has therefore much smaller dimensions than other AMS systems (Synal et al. 2007). The MICADAS can process gaseous samples from multiple sources, i.e., from sealed glass ampoules, from the dissolution of carbonate samples in evacuated or He-filled sealed vials or from combustion of organic matter in an elemental analyzer (Ruff et al. 2010a, 2010b; Salazar et al. 2015; Wacker et al. 2013a). Improvements of the gas source such as changes to the target setup (Ruff et al. 2007; Fahrni et al. 2013) have been made to refine the carbon ion yield and the transmission efficiency within the AMS system. MICADAS 14C measurements substantially reduce sample processing and measurement times owing to the omission of sample graphitization and cryogenic trapping for the purification of the sample gas, yet at the small expense of blank levels (Ruff et al. 2010a; Wacker et al. 2013b; Szidat et al. 2014). Pioneering work to improve non-graphitization analyses with MICADAS has exhibited promising outcomes, demonstrating the feasibility of analyses of samples as small as 1 µg C (~8 µg CaCO3) (Ruff et al. 2010a; Wacker et al. 2013a) as well as single benthic foraminifera (Wacker et al. 2013c). The lowest limit for 14C analyses by MICADAS is determined by the purpose of the measurements: while ultra-small carbon masses (e.g., 1–40 µg C) can be analyzed for source apportionment (e.g., distinguishing the sources of carbon- or aerosol fractions extracted from ice cores) (Jenk et al. 2007; Ruff et al. 2010a), sample material for age determinations should ideally be larger than ~40 µg C (~300 µg CaCO3) for the sake of reliability.
The MICADAS at the Laboratory for Radiocarbon Analysis with AMS at the University of Bern has been successfully applied to date wood material, plant remains, lacustrine macro-fossils, bulk sediment, charcoal (Szidat et al. 2014) and ancient bones (Szidat et al. 2017). The analyses have shown low detection limits and excellent agreement of International Atomic Energy Agency (IAEA) standards C4-C7 with their respective reference values (Szidat et al. 2014). Although foraminifera have been analyzed in other laboratories (Wacker et al. 2013a, 2013c), the reproducibility, precision and consistency of 14C analyses of foraminifera with conventional AMS
14
C measurements remains to be comprehensively tested at the University of Bern.
Here we report the results from systematic 14C analyses on planktic and benthic foraminifera (22– 146 µg C, 200–1200 µg CaCO3; 26–2 14C kyr before present, BP) and very old foraminifera devoid of 14C (“14C-free”) from the South Indian Ocean (sediment cores MD12-3396Q and MD11-3355) and from Ontong-Java-Plateau (sediment core RNDB-74P), performed with the MICADAS AMS at the University of Bern and with the Pelletron AMS at the University of Paris-Saclay. We exclusively make use of the carbonate dissolution unit to produce sample CO2 from our marine carbonate samples, which is then directly transferred into the AMS for gas analyses, or in the case of conventional (graphite) measurements, to the graphitization unit. The goals of our study are to test and assess (1) the reproducibility and precision of gas 14C mea-surements of small samples, (2) their consistency with conventional measurements of larger samples, (3) the impact of contamination during sample preparation and analysis, and (4) the 14C blank levels of
14
C-free foraminifera at our core site. We report 14C values as fraction modern, F14C (Reimer et al. 2004), which is equivalent to the ASN/AON metric of Stuiver and Polach, (1977).
Small-Size Foraminiferal 14C Analyses with MICADAS 3
SAMPLE MATERIAL
Sediment core MD12-3396CQ was retrieved with a kasten-square corer from a water depth of 3615 m from the Australian-Antarctic Basin, south of the Southeast Indian Ridge and east of Kerguelen Island (47°43.88′S; 86°41.71′E; Figure 1), as part of the Indien Sud expeditions aboard RV Marion Dufresne conducted by the French Polar Institute IPEV in 2011 and 2012. The core site is located in the Polar Frontal Zone of the Indian sector of the Southern Ocean. Bulk wet sediments were freeze-dried (at the University of Bern), were disintegrated in de-ionized water, were washed over a 150 µm-mesh to remove fine-grained clay particles, and were subsequently oven-dried (<50°C). All foraminifera were carefully hand-picked. Sediment core MD12-3396Q extends back to ~43 kyr BP as indicated by a comparison between magnetic susceptibility records of core MD12-3396 and cores from the same region, in particular core MD94-103, which record the Laschamp geomagnetic event (not shown; Mazaud et al. 2007). 14C-free benthic and planktic foraminifera were therefore separated from sediment levels 3982 to 3983 cm of piston core MD11-3355 that was retrieved from a nearby location (48°35.59′S; 86°09.40′E; 3976 m water depth) and that extends to calendar ages beyond the 14C application limit. According to initial core stratigraphy based on high-resolution color scan data (not shown), the selected interval cor-responds to a calendar age of ~160 kyr BP (i.e., the penultimate glacial period). In addition, we have extracted 14C-free benthic and planktic foraminifera from sediment levels between 235–490 cm of piston core RNDB-74P retrieved from Ontong-Java-Plateau (0°20.48′N, 159°22.49′E, 2547 m water depth; Figure 1). According to planktic foraminiferal δ18O stratigraphy, these sediment levels correspond to calendar ages older than 107 kyr BP (Berger et al. 1996).
METHODS
Experimental Setup
Reproducibility and Accuracy
In order to assess the reproducibility and precision of gas 14C measurements with the MICA-DAS at the University of Bern, we have performed multiple gas 14C analyses of planktic and benthic foraminiferal samples from the deglacial section of MD12-3396Q that have a sample size between 29–138 µg C (240–1150 µg CaCO3). They were performed on Neogloboquadrina pachyderma >150 µm (except for one Holocene sample, where Globigerina bulloides >200 µm was used instead) and on mixed benthic foraminiferal species >150 µm. The planktic
Figure 1 Location of the study cores (circles). Bathymetric isolines (–4000 m, –2000 m, –1000 m, and –120 m) are shown as gray lines (dark to light).
Downloaded from https://www.cambridge.org/core. Queen Mary University, on 22 Mar 2018 at 15:19:34, subject to the Cambridge Core terms of use, available
4 J Gottschalk et al.
foraminiferal samples were primarily separated from or near planktic foraminiferal abundance maxima to minimize biases inherent to bioturbation. The samples are compared to graphite 14C measurements performed at the University of Bern (MICADAS AMS) and the University of Paris-Saclay (Pelletron AMS).
For comparison and data correction/normalization, we have also performed multiple 14C measurements of the IAEA standard C2 (travertine; consensus F14C value: 0.4114 ± 0.0003, δ13C = –8.25 ± 0.31‰ VPDB (Rozanski 1991; Rozanski et al. 1992)) and IAEA standard C1 (marble; consensus F14C: 0.0000 ± 0.0002, consensus δ13C: –2.42 ± 0.33‰ VPDB (Rozanski 1991; Rozanski et al. 1992)). IAEA-C2 standard sizes varied between 31–112 µg C (260–930 µg CaCO3) for gas measurements and between 52–1000 µg C (430–8330 µg CaCO3) for graphite measurements, while the IAEA-C1 standard was sub-sampled with a mass varying between 8–122 µg C (67–1020 µg CaCO3) for gas measurements and between 38–1000 µg C (320–8330 µg CaCO3) for graphite measurements.
Samples were loaded into septum-sealed glass vials, treated with 15% H2O2 for 3 min, ultra-sonicated for few seconds, rinsed three times with milli-Q water (25°C, TOC <5 ppb), and then oven-dried at 45°C. Cleaning aims at removing organic detritus, extraneous sediment, and det-rital carbonate attached to the foraminiferal test that could interfere with the measurements. Upon completion of the successive cleaning steps, air in the septum vials was removed and replaced by He using two concentric needles inserted through the septum by the automated carbonate handling system (CHS, Ionplus AG; Wacker et al. 2013b, 2013c). The foraminiferal samples were then weakly leached by adding 200 µl HCl (0.01 M) for 5 min at room temperature. After a second flush of the vials with He (to remove CO2 produced during leaching), 0.5 mL 85% orthophosphoric acid (H3PO4) was added with a gas-tight syringe for carbonate dissolution. The reaction was run to completion over night at a temperature of 70°C. For a gas measurement with MICADAS at the University of Bern, the sample gas is transferred to a gas interface system (GIS; Ruff et al. 2007; Wacker et al. 2013a), and subsequently into the AMS (see the section below, “MICADAS: Measurement and Instrumentation”). For graphitization at the University of Bern, the CO2 is transferred from the CHS to an automated graphitization equipment (AGE) (Wacker et al. 2010c), where it is graphitized following standard hydrogen/iron procedures (Wacker et al. 2013b). The graphite is then pressed into targets and measured with the MICADAS AMS.
At the national French 14C Laboratory “ARTEMIS” at the University of Paris-Saclay, fo-raminiferal samples were treated with 2 mL 0.01 M HNO3 for 15 min in an ultrasonic bath. After vial evacuation, the sample CO2 resulting from the subsequent complete reaction of biogenic CaCO3 with
orthophosphoric acid at 60°C was graphitized with hydrogen on iron powder at 600°C following established protocols (Vogel et al. 1984). The sample powder was then pressed into targets and measured with a Pelletron AMS at the University of Paris-Saclay (Moreau et al. 2013).
Thirteen of 54 IAEA-C2 standards were chemically treated (similar to the method applied for foraminifera at the University of Bern), whereas H2O2 treatment and the weak acid leach were omitted for the remaining 41 IAEA-C2 standards, to assess the impact of sample preparation and cleaning on the 14C data. IAEA-C2 standards were analyzed both as gas- (n = 31) and as graphite samples (n = 23). 21 IAEA-C1 standards were chemically treated, while H2O2 treat-ment and weak acid leaching was omitted for the remaining 58 standards. 54 IAEA-C1 stan-dards were analyzed with the gas source, while 25 were measured as graphite.
We have additionally analyzed the National Institute of Standards and Technology (NIST) standard oxalic acid II (OxII; SRM 4990C) directly as CO2 sub-sampled from a commercially
Small-Size Foraminiferal 14C Analyses with MICADAS 5
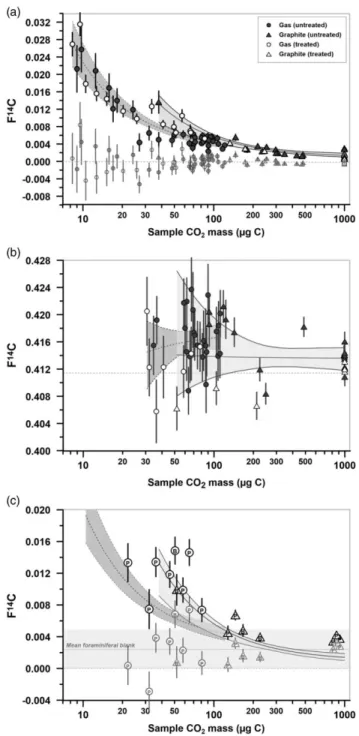
Figure 2 δ13C (top) and F14C values (bottom) of (a) NIST standard Oxalic Acid II (OxII), (b) blank CO2, and (c) 14
C-free planktic (P) and mixed benthic (B) foraminifera from sediment cores MD11-3355 and RNDB-74P (see also Table 1). Different symbols show different sample preparation procedures and analysis techniques: gas measurement of untreated (gray circles) and chemically treated samples (white circles) as well as graphite measurement of chemically treated samples (white triangles). Symbols and error bars to the right of the dashed line show the average and its associated one-sigma uncertainty (also highlighted by black line and light gray bar). F14C values are fully corrected using IAEA-C1 and C2 standards for background correction and normalization, respectively. F14C values in (c) indicate foraminiferal blanks, i.e., the residual F14C value after correction and standard normalization based on IAEA-C1 and IAEA-C2 standards.
purchased gas bottle, which was obtained by combustion of large quantities of the OxII standard at the Hertelendi Laboratory of Environmental Studies, Debrecen. Sample masses were sub-sampled to amount to 100–120 µg C. The OxII data are not used for data correction and normalization, and can accordingly be considered as independent samples (i.e., unknowns; Figure 2).
Foraminiferal Blanks
The observed 14C content of marine biogenic carbonates may be subject to an increased bias from contamination with decreasing sample size and/or increasing sample age (Ruff et al. 2010a; Bard et al. 2015; Freeman et al. 2016), and thus depend on accurate background cor-rections (Schleicher et al. 1998; Wacker et al. 2010a; Gottschalk et al. 2016). To assess 14C blank levels of our samples, we have analyzed the 14C content of nine 14C-free N. pachyderma samples and one mixed benthic foraminiferal sample from core MD11-3355. Their size ranges between 22–146 µg C (180–1220 µg CaCO3). The analyses are complemented with analyses of three 14C-free planktic foraminiferal samples (Globigerinoides sacculifer) and three mixed benthic fo-raminiferal samples from RNDB-74P ranging between 52–917 µg C (~430–7640 µg CaCO3). The foraminiferal data are compared against the IAEA standard C1. We have also analyzed blank CO2 samples taken directly from a commercially available sample bottle (Carbagas, Gümligen). Sizes of the blank CO2 samples were set to 100–120 µg C. Chemical treatment was
Downloaded from https://www.cambridge.org/core. Queen Mary University, on 22 Mar 2018 at 15:19:34, subject to the Cambridge Core terms of use, available
6 J Gottschalk et al.
applied to all foraminiferal samples, independent of the analysis technique chosen. Foraminiferal samples were analyzed as gas (n = 8) and as graphite (n = 8).
Graphite versus Gas Measurements
To assess the reliability of N. pachyderma 14C ages obtained with the gas ion source, we have performed graphite 14C analyses of aliquots of the same samples, both at the University of Bern (n = 7; MICADAS-200 kV) and at the University of Paris-Saclay (n = 8; Pelletron-2.6 MV). Samples graphitized and measured at the University of Bern ranged between 76–138 µg C (630– 1150 µg CaCO3), while the samples processed at the University of Paris-Saclay were larger (220– 590 µg C; 1830–4920 µg CaCO3). At the University of Bern, the planktic foraminiferal sam-ples analyzed as graphite were cleaned identically to N. pachyderma samples measured with the gas ion source, while the sample cleaning at the University of Paris-Saclay was slightly different (e.g., omission of H2O2 cleaning step; see the previous section, “Reproducibility and Accuracy”).
Data Processing
Sample batches consist of a set of standards (IAEA-C1 and IAEA-C2), analyses of OxII gas and fossil CO2 gas as well as 14C-free foraminiferal samples that are used for quality and consistency control and standard normalization. The data correction is performed with the help of the software BATS (version 3.6) (Wacker et al. 2010b), which includes correction for isotope fractionation (normalization to δ13C = –25‰ VPDB). We also apply a small cross-contamination correction (memory effect) owing to CO2 adsorption within the AMS system that was shown to be 0.2 ± 0.1% of the carbon mass of the previous sample for the MICADAS at the University of Bern (Salazar et al. 2015). We also correct for a measurement background that is derived from untreated IAEA-C1 and IAEA-C2 standards. It combines the background contributions resulting from the detection of apparent 14C ions not originating from the carbonate of interest (e.g., through charge changes, scatter, detector anomalies, inferences, insufficient vacuum, diminished ion source quality, and detection of equal-mass molecules), the acidification of the carbonate, the transfer of the sample CO2 from the CHS through the GIS into the gas ion source, and the target production. Chemically treated IAEA-C1 and IAEA-C2 standards are used to assess the blank contribution arising from 14C added during chemical cleaning from reaction vials and chemicals, i.e., the processing blank. Multiple analyses of IAEA-C1 and IAEA-C2 standards varying in size are performed to assess the impact of contamination on small samples and to quantify parameters of a constant-contamination model to correct the data (Brown and Southon 1997; Hua et al. 2004; Santos et al. 2007a, 2007b; Ruff et al. 2010b; Salazar et al. 2015). Hereafter, the combination of the corrections for cross-contamination, the measurement background and the processing blank is referred to as “correction without foraminiferal blank subtraction.” Foraminiferal blanks are assessed based on multiple analyses of 14C-free planktic and mixed benthic foraminiferal samples of last interglacial and penultimate glacial age that are compared against the IAEA-C1 standard and our blank (fossil) CO2 analyses. Correction for foraminiferal blanks apply a simple subtraction of residual F14C values after cross-contamination-, (IAEA C1) blank- and constant-contamination correction (hereafter, referred to as “correction with foraminiferal blank subtraction”). Uncertainties of our data are fully propagated for each correction.
MICADAS: Measurement and Instrumentation
The sample CO2 is purified in the GIS by means of a X13-zeolite trap (Ruff et al. 2007; Wacker et al. 2013a). It is released by heating the trap to 500°C, which expands the gas into a gas-tight syringe. The CO2 is mixed with He (CO2/He = 0.05), and is subsequently transferred into the AMS using a gas
Small-Size Foraminiferal 14C Analyses with MICADAS 7 source at a rate of ~1.5 µg C min–1 through a gas target, where the sample CO2 is fixed on the surface of a Ti insert. The sample CO2 interacts with the Cs+ beam and produces C– molecules with an efficiency of ~12% (Fahrni et al. 2013). Mass separated by an initial low-energy magnet, the ion beam enters a N2-filled stripper unit within the accelerator segment, where equal-mass molecules are suppressed and where the carbon ions perform a charge state conversion (Schulze-König et al. 2011). A higher-energy magnet subsequently causes final mass charge-dependent separation of the ion beam, and allows detection in Faraday cups (12C, 13C) or in a gas ionization chamber (14C). The overall transmission efficiency of carbon ions from the ion source to the detector is ~40%. Typical 12C– currents during a single measurement with 120 counting cycles, each lasting 10 s, were 10– 15 µA. Each measurement made use of a new Ti target surface, which was pre-sputtered for about ~1 min. During 14C analyses, the zeolite trap was cleaned and prepared for a new gas sample by flushing with He and heating to ~500°C.
RESULTS AND DISCUSSION Accuracy and Precision
Oxalic Acid II and Blank CO2
Analyses of 17 gas OxII standards as unknowns result in a mean F14C of 1.3399 ± 0.0053 using the IAEA-C2 standards for normalization, which is in agreement with the consensus value of F14C = 1.3407 ± 0.0005 (Figure 2a). The mean stable carbon isotope ratio of our OxII samples is δ13C = –16.3 ± 2.8‰ VPDB, which is slightly higher than the reference value of –17.8 ± 0.1‰ VPDB, but within the one-sigma uncertainty range.
Six measurements of fossil blank CO2 (Carbagas, Gümligen) show a mean F14C of 0.0000 ± 0.0013 consistent with the expected value (F14C = 0.0000; Figure 2b). The OxII standards and the fossil blank were provided as gaseous CO2 samples to the system, whereas the IAEA-C2 and C1 standards that were respectively applied for normalization and blank correction are available as carbonates, which underwent an additional step of acid treatment for transformation into CO2. The good agreement of the measurements of OxII and fossil CO2 with their reference values for both F14C and δ13C therefore demonstrates the excellent accuracy of the MICADAS at the University of Bern and the insignificance of fractionation contamination of the acidification step.
IAEA-C2
Our data are normalized based on the IAEA-C2 standard. The IAEA-C2 data are hence “forced” to meet their consensus F14C value, and can therefore not be independently compared against the reference value. Nonetheless, they provide useful insights into the precision of the analyses. In Figure 3a, we show fully corrected data for IAEA-C2 standards measured as graphite and as gas.
The average F14C of chemically treated gas measurements of IAEA-C2 has the highest one-sigma uncertainty (0.0049; Table 1; Figure 3a). These analyses were made on the smallest IAEA-C2 standard aliquots in our experiments. Contamination that is unaccounted for during corrections or possible overprints inherent to chemical cleaning may have caused the large one-sigma uncertainties.
δ13C values of all IAEA-C2 standard sets agree with the reference value within one-sigma uncertainty, except chemically treated IAEA-C2 standards measured as gas that agree with its reference within two-sigma uncertainties (Figure 3a). δ13C values of graphite measurements of IAEA-C2 performed in 2015 (the initial phase of the MICADAS setup for carbonate
Downloaded from https://www.cambridge.org/core. Queen Mary University, on 22 Mar 2018 at 15:19:34, subject to the Cambridge Core terms of use, available
8 J Gottschalk et al.
Figure 3 δ13C- (top) and F14C values (bottom) of (a) IAEA-C2 standard and (b) IAEA-C1 standard analyses (see also Table 1). Symbols refer to sample-treatment and analysis type: gas measurements of untreated (gray circles) and chemically treated standards (white circles) as well as graphite measurements of untreated (gray triangles) and chemically treated standards (white triangles). Mean and uncertainties are highlighted as black line and light gray bar. (These uncertainties refer to the standard deviation of the mean F14C or the average of the individual uncertainties; whichever is larger.) Numbers at symbols indicate year of measurement (δ13C data) and size of the sample analyzed in µg C (F14C data). IAEA-C2 standards are corrected for measurement backgrounds and are normalized to meet their consensus values. F14C values for IAEA-C1 standards are corrected for cross-contamination only (black symbols) and additionally for a constant contamination bias (gray symbols; no background subtraction).
Do wn lo a d e d f ro m h tt p s :// ww w. c a m b rid g e .o rg /c o re . Q u e e n M a ry Un iv e rs it y , o n 2 2 M a r 2 0 1 8 a t 1 5 :1 9 :3 4 , s u b je c t t o t h e Ca m b rid g e Co re t e rm s o f u s e , a v a il a b le a t h tt p s :// ww w. c a m b rid g e .o rg /c o re /t e rm s . h tt p s :// d o i. o rg /1 0 .1 0 1 7 /RDC .2 0 1 8 .3
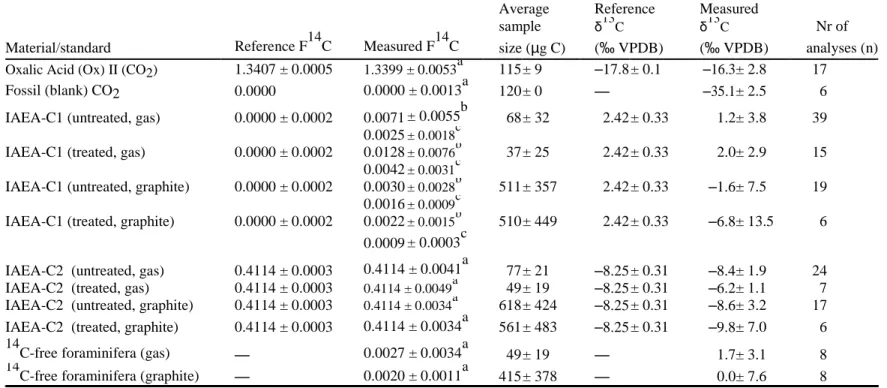
Table 1 Mean F14C and δ13C values of reference material and 14C-free foraminifera obtained with the MICADAS at the University of Bern. 14
C-free foraminifera were measured as mono-specific planktic and mixed benthic samples, and were hand-picked from cores MD11-3355 (South Indian Ocean) and RNDB-74P (Ontong-Java-Plateau). Reference values are from Rozanski (1991) and Rozanski et al. (1992).
Average Reference Measured Reference F14C Measured F14C
sample δ13C δ13C Nr of Material/standard size (µg C) (‰ VPDB) (‰ VPDB) analyses (n) Oxalic Acid (Ox) II (CO2) 1.3407 ± 0.0005 1.3399 ± 0.0053a 115 ± 9 –17.8 ± 0.1 –16.3 ± 2.8 17
Fossil (blank) CO2 0.0000 0.0000 ± 0.0013a 120 ± 0 — –35.1 ± 2.5 6 IAEA-C1 (untreated, gas) 0.0000 ± 0.0002 0.0071 ± 0.0055b 68 ± 32 2.42 ± 0.33 1.2 ± 3.8 39
0.0025 ± 0.0018c
IAEA-C1 (treated, gas) 0.0000 ± 0.0002 0.0128 ± 0.0076b 37 ± 25 2.42 ± 0.33 2.0 ± 2.9 15 0.0042 ± 0.0031c
IAEA-C1 (untreated, graphite) 0.0000 ± 0.0002 0.0030 ± 0.0028b 511 ± 357 2.42 ± 0.33 –1.6 ± 7.5 19 0.0016 ± 0.0009c
IAEA-C1 (treated, graphite) 0.0000 ± 0.0002 0.0022 ± 0.0015b 510 ± 449 2.42 ± 0.33 –6.8 ± 13.5 6 0.0009 ± 0.0003c
IAEA-C2 (untreated, gas) 0.4114 ± 0.0003 0.4114 ± 0.0041a 77 ± 21 –8.25 ± 0.31 –8.4 ± 1.9 24 IAEA-C2 (treated, gas) 0.4114 ± 0.0003 0.4114 ± 0.0049a 49 ± 19 –8.25 ± 0.31 –6.2 ± 1.1 7 IAEA-C2 (untreated, graphite) 0.4114 ± 0.0003 0.4114 ± 0.0034a 618 ± 424 –8.25 ± 0.31 –8.6 ± 3.2 17 IAEA-C2 (treated, graphite) 0.4114 ± 0.0003 0.4114 ± 0.0034a 561 ± 483 –8.25 ± 0.31 –9.8 ± 7.0 6 14
C-free foraminifera (gas) — 0.0027 ± 0.0034a 49 ± 19 — 1.7 ± 3.1 8 14
C-free foraminifera (graphite) — 0.0020 ± 0.0011a 415 ± 378 — 0.0 ± 7.6 8
a
Value is fully corrected for the measurement background and normalized using the IAEA-C1 and C2 standards, respectively (in the case of foraminiferal samples, it does not include a foraminiferal blank subtraction).
b
Value is corrected for cross-contamination, but not for the measurement background.
c
Value is corrected for cross-contamination and a size-dependent constant contamination bias, but not for the measurement background.
Sm all -Size Fo ram in if er al 14 C An aly ses with MI C ADA S 9
10 J Gottschalk et al.
analyses) show strong deviations from the reference value, as indicated in Figure 3a, which may be associated with some fractionation processes and weaknesses of the analyses setup that were since removed.
IAEA-C1
The IAEA-C1 standard allows an assessment of the 14C detection limits, and is hence crucial to determine the maximum 14C age that can be reliably determined by the AMS system. Contamination substantially influences 14C detection limit, and is an important control factor for the optimization of sample treatment procedures.
Aliquots of the IAEA-C1 standard were analyzed both in gaseous and solid form as well as with and without chemical treatment. We show the results of non-corrected IAEA-C1 standards that reflect the measurement background for untreated samples of various samples sizes, and in the case of chemically treated samples, may include an additional contribution from the processing blank (Figures 3 and 4).
Our untreated IAEA-C1 standards measured as gas (average standard size: 68 ± 32 µg C) show a mean background F14C = 0.0071 ± 0.0055 (n = 39). The mean value of our chemically treated IAEA-C1 standards (average standard size: 37 ± 25 µg C) is slightly higher (F14C = 0.0128 ± 0.0075; n = 15), and shows higher variability, owing to the analysis of smaller standards.
The δ13C values of all IAEA-C1 sets are within one-sigma uncertainty of the consensus value, except treated IAEA-C1 standards measured as gas that agree within two-sigma uncertainties (Figure 3b). We reiterate that large δ13C deviations of IAEA-C1 standards measured in 2015, as indicated in Figure 3b, might have been linked with some (unconstrained) isotopic fractionation effects, slightly incomplete CO2 formation in the CHS and/or fractionation in the trapping system that have since been resolved.
Our mean gas 14C background of untreated IAEA-C1 obtained with MICADAS at the University of Bern (F14C = 0.0071 ± 0.0055, n = 39) is in the same order of magnitude as those reported for other AMS systems (Ruff et al. 2007; Wacker et al. 2013c; Bard et al. 2015). Wacker et al. (2013c) reported a 14C background of IAEA-C1 standard gas of F14C = 0.0098
± 0.0010 (n = 6) measured at ETH Zurich on standard sizes of 47 ± 36 µg C and Bard et al. (2015) obtained F14C = 0.0025 ± 0.0016 (n = 2) with the AixMICADAS on standard sizes of ~100 µg C. The slightly lower background levels obtained with the AixMICADAS, although measurement number is very low and standards analyzed were slightly bigger than in our experiments, may be related to a better stripping efficiency with He (Schulze-König et al. 2011), used for the AixMICADAS (Bard et al. 2015). At the University of Bern, an upgrade of the MICADAS from N2 towards the more efficient He stripper gas (Schulze-König et al. 2011) is planned for the future.
The 14C background of graphite IAEA-C1 measurements is overall lower than for gas
measurements, i.e., F14C = 0.0030 ± 0.0028 (n = 19) for non-treated (average standard size: 511 ± 357 µg C) and F14C = 0.0022 ± 0.0015 (n = 6) for chemically treated standards (average standard size: 510 ± 449 µg C). This is to a large part a result of differences in sample sizes. Our results confirm previously determined graphite 14C backgrounds of the MICADAS at the University of Bern (F14C = 0.0018 ± 0.0005, n = 7), which was based on combustion of sodium acetate (Szidat et al. 2014). They are also similar to those determined with a conventional AMS system at the University of Kiel based on IAEA-C1
Small-Size Foraminiferal 14C Analyses with MICADAS 11
Figure 4 F14C values of (a) IAEA-C1 standard, (b) IAEA-C2 standard and (c) 14C-free planktic (P) and mixed benthic (B) foraminifera versus sample size (black symbols: cross-contamination correction only, gray symbols: full correction excluding foraminiferal blank subtraction). Lines and envelopes represent the applied constant contamination models for graphite samples (in light gray) and for gas samples (in dark gray); in (c) they refer to the constant contamination model obtained for IAEA-C1 standards. Dashed gray lines indicate the reference values for IAEA-C1 and IAEA-C2 (see Table 1). Horizontal line and gray box in (c) highlight the mean foraminiferal blank obtained for our study sites (F14C = 0.0024 ± 0.0025, n = 16). Note that the x-axes are shown on a logarithmic scale.
Downloaded from https://www.cambridge.org/core. Queen Mary University, on 22 Mar 2018 at 15:19:34, subject to the Cambridge Core terms of use, available
12 J Gottschalk et al.
(F14C = 0.0008 ± 0.0003, n = 75; Nadeau et al. 2001), and to those determined with the AixMICADAS based on phthalic acid (F14C = 0.0028 ± 0.0013, n = 79; Bard et al. 2015). Contamination
For gas and graphite measurements, we observe increasing IAEA-C1 F14C values of both chemically untreated and treated samples with decreasing sample size, particularly below 20 µg C (Figure 4). F14C values of IAEA-C2 standards remain rather constant with changing samples size (Figure 4). These trends may hint at a contamination source that has assumingly both constant mass (mc) and constant fraction modern (F14Cc), such that F14Cm × mm = F14Cs × ms + F14Cc × mc (Brown and Southon 1997; Hua et al. 2004; Santos et al. 2007a, 2007b; Ruff et al. 2010b; Salazar et al. 2015), where subscripts m and s refer to measurement and sample, respectively. The impact of constant contamination is reciprocally related to the sample size; its mass is assumed to be much smaller than that of the sample (mc < < ms). Contamination influences particularly small samples, driving blank values towards higher values, as observed (Figure 4).
Graphical solution based on IAEA-C1 and C2 standards assuming constant contamination of the AMS measurement including target production (Hua et al. 2004; Ruff et al. 2010b; Salazar et al. 2015; Santos et al. 2007a) suggests an influence of F14Cc = 0.30 ± 0.04 (0.49 ± 0.07) with mc = 0.68 ± 0.10 (0.94 ± 0.14) µg C on gas (graphite) measurements with the MICADAS at the University of Bern. Uncertainties of both F14Cc and mc are conservatively assumed to be ± 15% in agreement with our measurement results (see the section “Contributions to Overall 14C Age Uncertainty”). Constant contamination models separately calculated for chemically treated and untreated IAEA-C1 and IAEA-C2 standards do not show any significant deviation (not shown), which indicates that contamination due to sample cleaning is potentially negligible. Our reported constant contamination model parameters for gas and graphite analyses were hence determined based on both treated and untreated standards.
Untreated IAEA-C1 standards measured as gas (average standard size: 68 ± 13 µg C) and corrected for a constant contamination bias show a mean F14C = 0.0025 ± 0.0018 (n = 39), which suggests 14C detection limits of 43.8 kyr and better (Figure 3). The mean blank value of our chemically treated IAEA-C1 standards (average standard size: 37 ± 25 µg C) similarly corrected for a constant contamination bias is F14C = 0.0042 ± 0.0031 (n = 15) (Figure 3), and implies overall slightly lower 14C detection limits of 39.5 kyr and better. We find that chemical treatment (i.e., H2O2 treatment) of the samples does not have a significant positive effect on blank values, and may therefore be omitted.
Applying a correction according to the constant contamination model and performing a data normalization, the 14C background of graphite IAEA-C1 measurements is F14C = 0.0016 ± 0.0009 (n = 19) for non-treated and F14C = 0.0009 ± 0.0003 (n = 6) for chemically treated standards, which implies 14C detection limits of 48.1 kyr and better (Figure 3). Our analyses show the capability and accuracy of the Bern MICADAS to measure small samples up to ~50 kyr in solid form (graphite) and up to ~45 kyr in gaseous form; the first value is similar to conventional AMS systems.
Nonetheless, the determination of the constant contamination model is associated with rela-tively high uncertainties. Given its influence on corrected 14C ages and 14C detection limits, it is crucial to determine the impact of contamination on small samples (i.e., mc and F14Cc) accurately. We suggest that MICADAS gas measurements should ideally include a modern carbonate standard that can be measured with the MICADAS gas interface, and that can
Small-Size Foraminiferal 14C Analyses with MICADAS 13 experience the same chemistry as the actual samples (from preparation to sample CO2 production). Such certified reference material is currently not available.
Foraminiferal Blanks
Given different surface morphologies and mineral structures, foraminiferal carbonate and IAEA standard material may yield different 14C blank values. Ramped leaching experiments have emphasized the necessity of carefully removing any carbonaceous external phase that may bias the measurements (Schleicher et al. 1998; Bard et al. 2015). The residual F14C value of 14C-free foraminiferal samples from our study sites after correction is F14C = 0.0027 ± 0.0034 (n = 8), when foraminifera were measured as gas (average sample size: 49 ± 19 µg C), and F14C = 0.0020 ± 0.0011 (n = 8), when they were measured as graphite (average sample size: 415 ± 378 µg C). Our estimated foraminiferal blanks are consistent with foraminiferal 14C blanks obtained with other AMS systems that range between F14C = 0.0010 and 0.0058 (Schleicher et al. 1998; Nadeau et al. 2001; Wacker et al. 2013c). For our study sites, these foraminiferal blanks translate into maximum conventional 14C ages of foraminiferal samples of 38.0 kyr (gas) and 42.4 kyr (graphite) that can be determined with the MICADAS at the University of Bern.
The analyses emphasize the importance of correcting foraminiferal 14C ages based on foraminiferal blanks, particularly for old and small samples. A foraminiferal blank likely results from 14C addition during early diagenesis in marine sediments (e.g., in carbonate coatings) or during core storage, and/or through CO2 adsorption during AMS analysis. Although 14C-free foraminifera from the sediment core are often used to correct for the presence of contaminant 14C, it remains to be tested whether they faithfully reflect the 14C bias of non-14C-free foraminifera from shallower core depths. Hence, foraminiferal blank corrections are associated with substantial uncertainties, and a universal foraminiferal blank for a specific region, or even for a single sediment core, does not likely exist. Nonetheless, assuming that 14C is preferentially added to foraminifera rather than removed during post-mortem burial in sediments and during analysis, foraminiferal blank corrections may alleviate an overestimation of true 14C ages.
Reproducibility
Multiple CO2 Gas Measurements
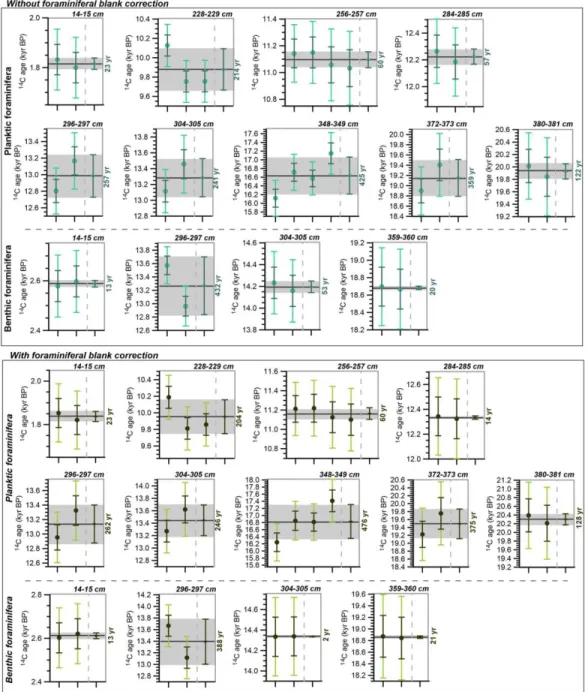
We have performed 13 replicate measurements on N. pachyderma (n = 8), G. bulloides (n = 1) and mixed benthic foraminifera (n = 4) either in the same or different sample batches in order to test the reproducibility of single gas measurements. Our samples were run as duplicates (n = 10), triplicates (n = 1) and quadruplicates (n = 2). We show the results with and without fo-raminiferal blank subtraction (Figure 5), which are taken as monthly- rather than long-term means and can therefore differ among analyses. While reporting results for both datasets, we mainly focus on discussing 14C results excluding a foraminiferal blank subtraction because they are more comparable with conventional (graphite) 14C data of cores (including MD12-3396Q) for which foraminiferal blank estimates are not sufficiently constrained or absent.
Most of the 14C age replicates measured either in the same batch or in different sample batches agree within their one-sigma uncertainties (Figure 5). Exceptions are observed for five (three) samples without (with) foraminiferal blank subtraction (out of 13), primarily for the planktic foraminiferal samples, that nonetheless agree within reported two-sigma uncertainties. On average, planktic foraminiferal 14C ages can be reproduced within 200 (200) yr without (with) foraminiferal blank subtraction, while the reproducibility for benthic foraminiferal 14C dates is
Downloaded from https://www.cambridge.org/core. Queen Mary University, on 22 Mar 2018 at 15:19:34, subject to the Cambridge Core terms of use, available
14 J Gottschalk et al.
Figure 5 Replicate 14C analyses of planktic and mixed benthic foraminifera from sediment core MD12-3396Q. Sediment depths of the samples are given in the upper right corner of each graph. Top and bottom panel shows corrected 14C data (including cross-contamination, constant contamination, measurement background and standard normalization) without and with foraminiferal blank subtraction, respectively. N. pachyderma was used for all samples except for sample 14–15 cm, where G. bulloides was chosen instead. Dark and light error bars indicate one-and two-sigma uncertainties of the 14C ages, respectively. Symbols and error bars to the right of the dashed line show means and the associated one-sigma standard deviation (highlighted by black line and gray band throughout each graph). Tick label interval is 0.2 kyr. See online version for colors.
Small-Size Foraminiferal 14C Analyses with MICADAS 15 better by a factor of ~two, i.e., 130 (100) yr. These estimates are similar to the average one-sigma uncertainty of the individual analyses, which is 160 ± 70 (210 ± 100) yr without (with) foraminiferal blank subtraction.
The average reproducibility of multiple 14C analyses of one and the same sample lies within 1.4 ± 0.6% and is a confirmation of the quality of 14C analyses at the University of Bern. The reproducibility of benthic foraminiferal 14C dates is better than that of planktic foraminifera, which may reflect more stable hydrographic conditions in the deep ocean than at the surface. However, the difference in 14C age reproducibility also raises questions on analytical limitations versus contributions from true sedimentary biases. On the one hand, planktic foraminifera may be more prone to contamination owing to their more porous and more fragile tests, which renders partial dissolution, recrystallization, adsorption of modern CO2 and/or precipitation of authigenic phases both during sample preparation and analysis as well as in the sediment more likely (Broecker et al. 2006). On the other hand, as the average sample size of our gas mea-surements on planktic foraminiferal samples is 60 ± 20 µg C (500 ± 170 µg CaCO3), representing roughly 80– 120 individuals of N. pachyderma, deviations of small-size sample replicates may represent true deviations from the sample mean. The lower limit of sample sizes for 14C gas analyses of planktic foraminifera with the MICADAS is hence determined by the extent to which small samples are representative of their sample mean, which depends on environmental conditions (e.g., reservoir age variability, hydrographic variations, foraminiferal habitat shifts) and post-depositional processes (e.g., local accumulation rates, bioturbation, sediment redis-tribution processes, the core quality, and the extent of early diagenetic overprints such as carbonate dissolution). These factors may substantially differ from site to site, which may lead to a varying degree of 14C age reproducibility and precision of MICADAS 14C gas analyses of samples from different marine sediment cores. Although this requires systematic analyses on multiple planktic foraminiferal species in the future, the findings indicate that the reproduci-bility of gas 14C analyses of planktic foraminifera may be compromised by increasing biases from natural sample variability towards very low sample sizes (e.g., <200–300 µg CaCO3).
Comparison of Graphite and Gas 14C Measurements
To compare the consistency between gas and graphite 14C analyses, we have performed multiple
14
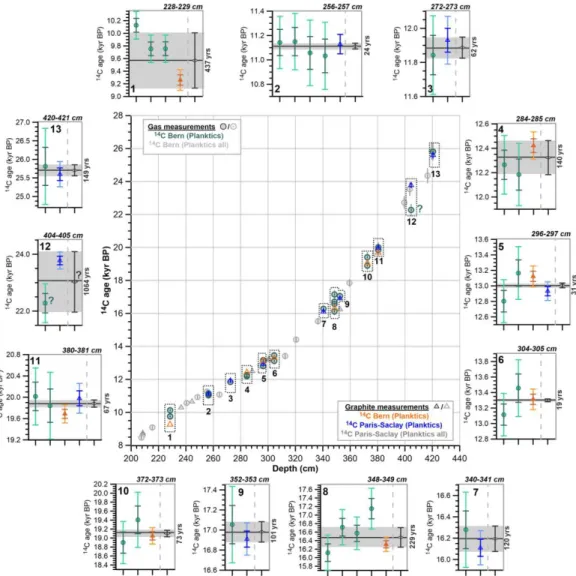
C analyses of aliquots of the same planktic foraminiferal sample in gaseous and solid form. In Figure 6, we compare (1) gas and graphite 14C measurements at the University of Bern (MICADAS, n = 7), (2) gas measurements at the University of Bern (MICADAS) with graphite analyses at the University of Paris-Saclay (n = 8), and (3) graphite measurements at the University of Bern and Paris-Saclay (n = 2).
The sample sizes of gas (50 ± 10 µg C; 420 ± 80 µg CaCO3) and graphite measurements (100 ± 20 µg C; 830 ± 170 µg CaCO3) at the University of Bern differ by a factor of two. Aver-aging replicate gas measurements, gas and graphite 14C ages agree within two (one) standard deviations in six (five) out of seven cases. The mean standard deviation between gas and graphite measurements at the University of Bern is 170 ± 140 yr (n = 7), which is similar to the mean one-sigma 14C age uncertainty of the graphite measurements and gas replicates (140 ± 70 yr, n = 14). Graphite measurements at the University of Paris-Saclay were performed on much larger sample aliquots (380 ± 130 µg C; 3170 ± 1080 µg CaCO3) than gas measurements at the Uni-versity of Bern (50 ± 10 µg C; 420 ± 80 µg CaCO3). Both are consistent within one-sigma stan-dard deviation in most cases (Figure 6). In one case (i.e., 404–405 cm), the 14C results for the gas
Downloaded from https://www.cambridge.org/core. Queen Mary University, on 22 Mar 2018 at 15:19:34, subject to the Cambridge Core terms of use, available
16 J Gottschalk et al.
Figure 6 14C age–depth relationship of sediment core MD12-3396Q (center graph) based on gas 14C measurements (circles) and graphite 14C measurements (triangles) of the planktic foraminiferal species N. pachyderma obtained at the University of Bern (MICADAS AMS) and the University of Paris-Saclay (ARTEMIS Pelletron AMS). 14C ages are fully corrected (measurement background, constant contamination, standard normalization and cross-contamination), but do not include a foraminiferal blank subtraction (to warrant a reliable comparison between gas and graphite measurements). Gray symbols refer to additional non-replicated 14C analyses of N. pachyderma obtained at the University of Bern and of other mono-specific planktic foraminiferal samples measured at the University of Paris-Saclay. Numbers and insets refer to graphs surrounding the center figure showing a detailed comparison of gas and graphite 14C ages. Symbols and labels to the right of the dashed lines show means and one-sigma standard deviations of gas 14C ages and graphite 14C ages. (Please note that samples graphitized and analyzed in Paris-Saclay at 380–381 cm [No. 11] and 420–421 cm [No. 13] were assumingly mixed during analysis. We show them in the expected order.) See online version for colors.
sample significantly deviates from that of the graphite 14C measurements performed in Paris-Saclay, and the overall 14C age-depth relationship in MD12-3396Q (Figure 6). Macroscopic sediment disturbances such as strong bioturbation or sediment remobilization could not be observed in the core, which makes it difficult to explain such strong deviation. The cause of this deviation remains unknown. However, taking this single outlier aside, the mean standard
Small-Size Foraminiferal 14C Analyses with MICADAS 17 deviation between gas 14C analyses of small samples at the University of Bern and graphite 14C analyses of large samples at the University of Paris-Saclay is 100 ± 60 yr (n = 7), which is remarkably low given a sample mass difference by a factor of eight.
We also compare two graphite measurements obtained at the University of Bern and the University of Paris-Saclay (Figure 6). Both agree within two-sigma uncertainties, whereby one agrees within one-sigma uncertainties. However, more analyses are required to assess the consistency between MICADAS AMS 14C analyses on small graphitized samples (~<100 µg C) and conventional AMS 14C analyses on large graphitized samples (>100 µg C).
The agreement of graphite 14C ages of large samples (Paris-Saclay) and gas 14C measurements on small samples (Bern) supports the accuracy and precision of 14C measurements on gas samples with the MICADAS at the University of Bern. In the absence of foraminiferal standards, we consider the foraminiferal graphite 14C analyses a benchmark for 14C gas analyses. However, biases of graphite 14C ages such as due to variations in depth habitats of foraminifera (Andrée et al. 1986), short-term hydrographic changes (Magana et al. 2010; Roach et al. 2013; Lindsay et al. 2015; Ezat et al. 2017), post-depositional addition of secondary calcite (Broecker et al. 2006; Wycech et al. 2016) or sedi-mentary mixing (Andrée et al. 1986; Barker et al. 2007) may lead to deviations in 14C ages of graphitized samples beyond the analytical uncertainty. These biases may therefore restrict the use of graphite 14C ages as benchmark for comparison with gas 14C measurements to some extent. Despite this cautionary note, our findings indicate that although single graphite 14C ages are more precise than a single gas 14C age, high-resolution gas 14C age analyses can compensate for their lower precision, and provide reliable information for age chronologies.
The standard deviation of mean gas 14C ages of small samples and mean graphite 14C ages obtained both at the University of Bern and the University of Paris-Saclay is 120 ± 120 yr (n = 12; Figure 6), which is similar to the average uncertainty of the graphite measurements (90 ± 30 yr, n = 16). We conclude that gas 14C analyses of small foraminiferal samples with MICADAS are sufficiently accurate for 14C dating of foraminifera in mass-limited samples and regions, if important criteria with respect to sedimentation rates (>5 cm kyr–1), integrity of the sediment core (undisturbed) and bioturbation (low) are fulfilled. Despite the sufficient accuracy, the precision of
14
C gas analyses of foraminifera is slightly lower than for conventional AMS systems, as was previously shown for other environmental materials at the University of Bern (Szidat et al. 2017, 2014).
Uncertainties
Comparison of Graphite and Gas 14C Age Uncertainties
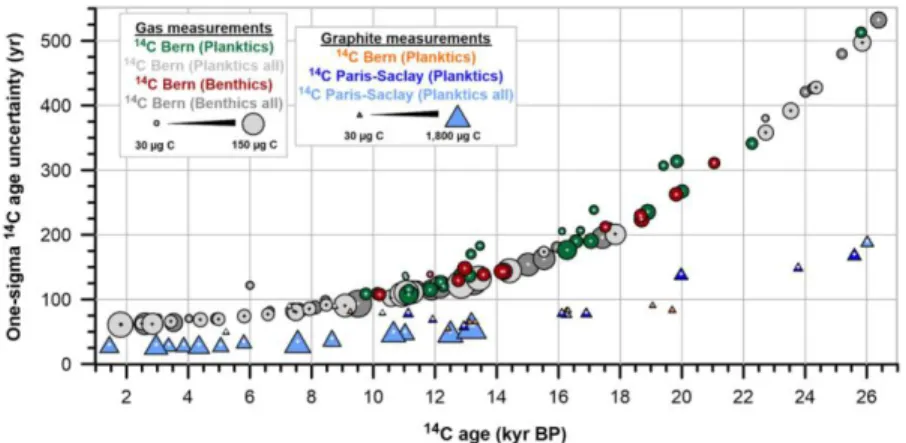
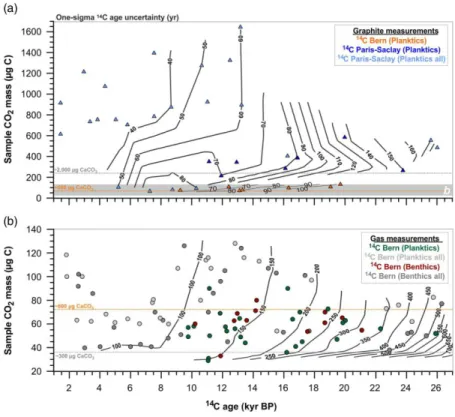
Significantly larger uncertainties of 14C ages are observed for gas than for graphite measure-ments (Figure 7). For gas (graphite), these uncertainties are below 110 (50) yr for 14C ages younger than 12 kyr BP, and between 110 (50) and 550 (190) yr for 14C ages between 12 and 26 kyr BP (Figure 7). The average difference therefore ranges from a factor of ~two during the Holocene to a factor of ~three during the last ice age. Our dataset indicates that age uncer-tainties of graphite samples larger than ~250 µg C (~2000 µg CaCO3) and of gas samples larger than ~40 µg C (~300 µg CaCO3) rapidly increase with 14C age (Figure 8). This increase appears independent of the samples size. However, below ~250 µg C (~2000 µg CaCO3) and ~40 µg C (~330 µg CaCO3), age uncertainties increase both as a function of increasing 14C age and decreasing sample size (Figure 8). More measurements are required to describe these dependencies more precisely. Although graphite samples analyzed at the University of Bern were overall much smaller (100 ± 20 µg C; n = 7) than those measured at the University of
Downloaded from https://www.cambridge.org/core. Queen Mary University, on 22 Mar 2018 at 15:19:34, subject to the Cambridge Core terms of use, available
18 J Gottschalk et al.
Figure 7 One-sigma 14C age uncertainties of planktic and mixed benthic foraminifera (foraminiferal blank not subtracted) from sediment core MD12-3396Q measured as gas (circle) and as graphite (triangle) at the University of Bern (MICADAS AMS) and the University of Paris-Saclay (ARTEMIS Pelletron AMS). Symbol size varies with sample size as shown in the legend. Colored symbols refer to the data shown in Figures 5 and 6; for completeness, pale symbols show all data obtained in both laboratories (including those without replicate analyses). Note that 14C age uncertainties are to some extent dependent on protocols of normalization and data correction that may differ among laboratories (see the section “Contributions to Overall 14C Age Uncertainty”). See online version for colors.
Paris-Saclay (680 ± 430 µg C; n = 30), they show similar age-dependent age uncertainties (Figures 7 and 8a), which illustrates the high precision of MICADAS graphite 14C measure-ments despite overall lower sample size requirements.
The difference in uncertainties between gas and graphite 14C measurements of a factor of 2.2 ± 0.4 over the last 26 kyr BP can be attributed to analytical differences. Graphitized samples are less likely to produce equal-mass molecules, have a higher ionization and transmission efficiency, which overall leads to better counting statistics. The counting statistics of gas analyses may be significantly influenced by the experimental setup, e.g., by the number of targets used for a sample analysis, the number of replicates, the duration of the analysis as well as the accuracy and precision of the (IAEA) standard measurements used for correction and normalization. Reliable
14
C age analysis on solid samples with MICADAS at the University of Bern can be performed on samples at least as low as ~70 µg C (~600 µg CaCO3), which was the smallest graphitized sample in our experiments. 14C analyses on gas samples with MICADAS provide reliable 14C age estimates below these limits, despite a reduced precision.
The strong link between 14C age and 14C age uncertainty for normal-sized to large samples can be attributed to the fact that 14C concentrations (and hence the likelihood for detection of non-sample
14
C or 14C-equivalent molecules) decrease (increases) exponentially with 14C age, which has a strong impact on AMS counting statistics. If sufficiently large, all samples are equal in terms of counting statistics to some extent, because the sample CO2 concentration in He prior to injection into the AMS for gas analyses is limited to 5% and the duration of the analysis is not dependent on the sample size. However, counting statistics significantly deteriorate for very small samples, for instance when the duration of the analysis becomes significantly shortened, causing a strong dependence of 14C age uncertainties on both sample age and -size.
Contributions to Overall 14C Age Uncertainty
Uncertainties of reported 14C ages depend to some extent on the correction protocols applied, because every procedure, e.g., cross-contamination correction, blank correction,
Small-Size Foraminiferal 14C Analyses with MICADAS 19
Figure 8 One-sigma 14C age uncertainties of planktic and mixed benthic foraminiferal samples (foraminiferal blank not subtracted) from sediment core MD12-3396Q measured as
(a) graphite (triangle) and (b) as gas (circle) at the University of Bern (MICADAS AMS) and the University of Paris-Saclay (ARTEMIS Pelletron AMS) as function of sample 14C age and sample size, shown as contours (in yr). Contours of 14C age uncertainties of graphite samples were determined separately for the Bern (small samples) and Paris-Saclay dataset (large samples). Colored symbols refer to the data shown in Figures 5 and 6. Gray symbols show all data obtained in both laboratories (including those without replicate analyses). The gray box in (a) shows the range of panel (b). Gray stippled lines show boundaries below which age uncertainties of graphite (a) and gas measurements (b) are strongly dependent on both sample size and 14C age. Note that 14C age uncertainties are to some extent dependent on protocols of normalization and data correction that may differ among laboratories (see the section “Contributions to Overall 14C Age Uncertainty”). See online version for colors.
contamination correction and standard normalization, adds to the overall uncertainty of the corrected 14C age (to various degrees). Although uncertainties of 14C ages should account for AMS counting statistics, the various background and blank contributions and fractionation effects as well as uncertainties associated with sample 14C age reproducibility, their calculation is not standardized and can differ among laboratories. Age uncertainties determined in this study are dependent on sample size and sample age, but are not universal and strictly reflect the analysis and correction protocols applied in our laboratory.
A relatively large contribution to the overall 14C age uncertainty arises from the correction of the size-dependent contamination bias owing to uncertainties inherent to the determination of the constant contamination model parameters mc and F14Cc (for which we have applied a conservative error estimate of ± 15%). This correction step can be replaced by a simple blank subtraction, if sample sizes can be precisely matched with those of the IAEA standards used for correction and
Downloaded from https://www.cambridge.org/core. Queen Mary University, on 22 Mar 2018 at 15:19:34, subject to the Cambridge Core terms of use, available
20 J Gottschalk et al.
normalization, which would reduce uncertainties of 14C ages. Comparing the standard deviation of our IAEA-C1 and C2 standard values with the mean of their uncertainties shows that our given uncertainty estimates fully account for and possibly overestimate the variability of the IAEA-C1 and C2 data. This suggests that all components of uncertainty are considered conservatively by our data correction and normalization protocols.
CONCLUSIONS
Along with carbonate IAEA standards C1 and C2 as well as gaseous OxII and fossil (blank) CO2 samples, we have performed systematic 14C analyses of planktic and benthic foraminifera extracted from sediment cores from the South Indian Ocean (MD12-3396Q, MD11-3355) and Ontong-Java-Plateau (RNDB-74P) with the MICADAS AMS at the University of Bern and in the ARTEMIS laboratory at the University of Paris-Saclay. The average mass of (non-14C-free) samples measured as gas (50 ± 10 µg C; 420 ± 80 µg CaCO3) and graphite (100 ± 20 µg C; 830 ± 170 µg CaCO3) at the University of Bern was smaller than samples measured with a conventional AMS (Pelletron) system at the University of Paris-Saclay (380 ± 130 µg C; 3170 ± 1080 µg CaCO3) by a factor of 8 and 4, respectively.
Analyses of fossil (blank) CO2 and NIST standard OxII agree with the consensus values within one-sigma uncertainties. The accuracy of 14C gas analyses with MICADAS is comparable to conventional analyses. Blank values of our 14C-free foraminiferal samples are significantly different from zero. Although a universal foraminiferal blank correction in an ocean region or in a single sediment core does not likely exist, we suggest that foraminiferal blank corrections based on 14C-free foraminifera from the same core (>100 kyr) may alleviate an overestimation of true
14
C ages. We find that the reproducibility of gas 14C analyses of our small planktic and mixed benthic foraminiferal samples (14C age = 20.2–1.8 kyr BP) is 200 yr (n = 9) and 130 yr (n = 4), respectively. The precision of our gas analyses with the MICADAS at the University of Bern decreases mainly as a function of 14C age for sample sizes above 40 µg C (>300 µg CaCO3). Below this limit, precision deteriorates substantially with decreasing sample size. Uncertainties of
14
C ages amount to 110 yr for foraminiferal samples younger than 12 kyr BP and between 110 and 550 yr for foraminiferal samples between 12–26 kyr BP. Uncertainties of foraminiferal 14C ages analyzed on graphite with the MICADAS at the University of Bern and the Pelletron AMS at the University of Paris-Saclay are on average lower by a factor of 2.2 ± 0.4 than those of gas analyses. Gas 14C analyses of small samples (400 ± 800 µg CaCO3) and graphite 14C analyses of large samples (3200 ± 1100 µg CaCO3) agree within 100 ± 60 yr (n = 7), despite an average sample mass difference by a factor ~8.
Foraminiferal 14C analyses on solid samples (graphite) with the MICADAS at the University of Bern provide accurate and precise 14C age estimates for samples sizes at least as low as ~70 µg C (~600 µg CaCO3), while foraminiferal 14C analyses on gaseous samples provide a sufficiently accu-rate
alternative for 14C dating of samples as low as ~10–30 µg C (~30–240 µg CaCO3), despite lower precision. Significant age determination of foraminiferal samples in gaseous and solid form from our study sites with the MICADAS at the University of Bern is currently limited to 38 kyr and 42 kyr, respectively. However, 14C analyses of IAEA-C1 standard material indicate that reliable 14C age analyses are possible for carbonate material with a 14C age up to 45 kyr (gas) and 50 kyr (graphite).
ACKNOWLEDGMENTS
We thank the staff of the Laboratoire de Mesure du Carbone-14 of the ARTEMIS French national AMS facility for the technical support received throughout the study. We thank Dr. Luke Skinner and Dr. Lukas Wacker for insightful discussions, and Patrick Rafter and an