HAL Id: hal-01597707
https://hal.archives-ouvertes.fr/hal-01597707
Submitted on 24 Jan 2018
HAL is a multi-disciplinary open access
archive for the deposit and dissemination of
sci-entific research documents, whether they are
pub-lished or not. The documents may come from
teaching and research institutions in France or
abroad, or from public or private research centers.
L’archive ouverte pluridisciplinaire HAL, est
destinée au dépôt et à la diffusion de documents
scientifiques de niveau recherche, publiés ou non,
émanant des établissements d’enseignement et de
recherche français ou étrangers, des laboratoires
publics ou privés.
mechanism for membrane protein insertion
Mathieu Botte, Nathan R. Zaccai, Jelger Lycklama À. Nijeholt, Rémy Martin,
Kèvin Knoops, Gabor Papai, Juan Zou, Aurélien Deniaud, Manikandan
Karuppasamy, Qiyang Jiang, et al.
To cite this version:
Mathieu Botte, Nathan R. Zaccai, Jelger Lycklama À. Nijeholt, Rémy Martin, Kèvin Knoops, et al..
A central cavity within the holo-translocon suggests a mechanism for membrane protein insertion.
Sci-entific Reports, Nature Publishing Group, 2017, 6 (38399), 13 p. �10.1038/srep38399�. �hal-01597707�
A central cavity within the
holo-translocon suggests a mechanism
for membrane protein insertion
Mathieu Botte
1,*, Nathan R. Zaccai
2,*, Jelger Lycklama à. Nijeholt
1, Remy Martin
2,
Kèvin Knoops
1, Gabor Papai
3, Juan Zou
4, Aurélien Deniaud
1, Manikandan Karuppasamy
1,
Qiyang Jiang
1, Abhishek Singha Roy
5, Klaus Schulten
5, Patrick Schultz
3, Juri Rappsilber
4,6,
Giuseppe Zaccai
7,8, Imre Berger
1,2, Ian Collinson
2& Christiane Schaffitzel
1,2The conserved SecYEG protein-conducting channel and the accessory proteins SecDF-YajC and YidC constitute the bacterial holo-translocon (HTL), capable of protein-secretion and membrane-protein insertion. By employing an integrative approach combining small-angle neutron scattering (SANS), low-resolution electron microscopy and biophysical analyses we determined the arrangement of the proteins and lipids within the super-complex. The results guided the placement of X-ray structures of individual HTL components and allowed the proposal of a model of the functional translocon. Their arrangement around a central lipid-containing pool conveys an unexpected, but compelling mechanism for membrane-protein insertion. The periplasmic domains of YidC and SecD are poised at the protein-channel exit-site of SecY, presumably to aid the emergence of translocating polypeptides. The SecY lateral gate for membrane-insertion is adjacent to the membrane ‘insertase’ YidC. Absolute-scale SANS employing a novel contrast-match-point analysis revealed a dynamic complex adopting open and compact configurations around an adaptable central lipid-filled chamber, wherein polytopic membrane-proteins could fold, sheltered from aggregation and proteolysis.
The hetero-trimeric Sec protein-conducting channel translocates integral inner membrane proteins and secretory proteins into or across the membrane1,2. Doung and Wickner discovered that in bacteria additional factors associate
with this complex to facilitate efficient protein translocation and named the supercomplex “preprotein translocase holoenzyme”3. They co-immunoprecipitated SecYEG, YajC and SecDF as well as a ~60 kDa protein which was
subsequently identified as YidC4 from radiolabeled Escherichia coli membranes using an anti-SecG antibody.
Further study, however, was impeded by the lack of means to produce holo-translocon in the quality and quantity required for its biochemical and structural characterization. More recently, using recombinant highly purified SecYEG-SecDFYajC-YidC holo-translocon, it was shown that the complex is active in co- and post-translational translocation5. A recent proteomics study in E. coli based on absolute protein synthesis rates provided protein
copy number estimates6 (Figure S1). This data is consistent with a molar ratio of SecY, SecE, SecG, SecD, SecF,
YajC and YidC of ~4:4:4:1:1:10:3 in the membrane, suggesting that as much as ~25% of all SecYEG could be complexed in HTL.Under optimal growth conditions, the protein synthesis of HTL could amount to 2,600 copies of HTL per generation6; the real copy number is likely smaller, since this number does not take into account any
protein turnover. Even accounting for a high level of turnover, this is in stark contrast to a previous copy number
1European Molecular Biology Laboratory, Grenoble Outstation, 71 Avenue des Martyrs, 38042 Grenoble, France. 2School of Biochemistry, University of Bristol, BS8 1TD, United Kingdom. 3Department of Integrated Structural
Biology, Institut de Génétique et de Biologie Moléculaire et Cellulaire (IGBMC), U964 INSERM, UMR7104 CNRS; University of Strasbourg, 1 Rue Laurent Fries, BP10142, 67404 Illkirch, France. 4Wellcome Trust Centre for Cell
Biology, University of Edinburgh, Edinburgh, EH9 3JR, United Kingdom. 5Department of Physics, University of
Illinois Urbana Champaign, 3217 Beckman Institute, 405 N Mathews Ave., Urbana, IL 61801, USA. 6Department
of Bioanalytics, Institute of Biotechnology, Technische Universität Berlin, 13355 Berlin, Germany. 7Institut Laue
Langevin, 71 Avenue des Martyrs, F-38042 Grenoble, France. 8CNRS, Institut de Biologie Structurale, F-38044
Grenoble, France. *These authors contributed equally to this work. Correspondence and requests for materials
should be addressed to I.C. (email: ian.collinson@bristol.ac.uk) or C.S. (email: christiane.berger-schaffitzel@bristol. ac.uk)
Received: 28 July 2016 Accepted: 08 November 2016 Published: 07 December 2016
estimation based on semi-quantitative alkaline phosphatase-SecDF fusion protein analyses7 suggesting that E. coli
membranes contain only ~10–30 copies of SecDF and about ~10-times more SecYEG copies.
The SecYEG core-translocon forms a central pore through which hydrophilic polypeptides are transported, otherwise closed by a girdle of hydrophobic residues and a short helix (plug)8. A lateral gate is formed between
transmembrane helices (TMs) 2b and 7 of SecY through which TMs partition into the lipid bilayer. YidC is required to facilitate this passage from the lateral gate and for the subsequent folding and assembly of inner membrane-proteins and complexes4,9–13. Crystal structures of YidC show a large periplasmic domain and a
conserved bundle of 5 TMs containing a hydrophilic groove at the cytosolic face for substrate binding and for facilitating membrane traversal14,15. The ancillary sub-complex comprising SecD and SecF stimulates protein
translocation through SecYEG8 assisted by the transmembrane proton-motive force (PMF)16,17. The periplasmic
domain of SecD consists of a P1-head and a P1-base domain, which are thought to contact the substrate and move in response to proton translocation; thereby facilitating the passage of polypeptides across the membrane17.
Here, we present an interdisciplinary analysis of HTL architecture combining small-angle neutron scat-tering (SANS), electron microscopy (EM) and biochemical and biophysical data in an integrated approach. Absolute-scale contrast variation SANS revealed a dynamic HTL complex and a lipid-filled central cavity sur-rounded by protein. The surrounding protein components were then visualized by cryo-EM. Their identities and arrangement were further characterized by EM analyses of HTL sub-complexes, with missing components. The data and available crystal structures of the individual subunits enabled us to build a quasi-atomic model of the complex, which lends itself to an interesting new mechanism for membrane protein insertion.
Results
HTL comprises one copy each of its subunits.
For balanced over-production of the functional bacterial HTL complex we used the ACEMBL expression system18, which allowed HTL isolation by detergentsolubilisa-tion, affinity purification via the hexahistidine-tags fused to SecE, SecD and YidC and the calmodulin-binding peptide fused to YajC, followed by gradient centrifugation (Supplementary Fig. S1)5. Size-exclusion
chromatog-raphy and analytical ultracentrifugation of the detergent-solubilized HTL are compatible with a protein complex of a molecular weight of ~250 kDa comprising one copy each of the subunits plus contributions from lipids and detergent (Supplementary Fig. S1c,d)5. The detergent-solubilized complex was expected to be highly dynamic
with respect to its periplasmic domains, which are flexibly linked to the transmembrane parts. Moreover, the HTL complex is sensitive to increased detergent concentrations5. Importantly, HTL cannot be reconstituted
from its individual components. Therefore, we applied mild glutaraldehyde cross-linking to produce stable par-ticles suitable for further analysis, or we exchanged the detergent DDM (n-Dodecyl-β -D-Maltopyranoside) with amphipols. It is important to note that crosslinking cannot ‘induce’ a new conformation, it will stabilize existing conformations of a protein complex. Glutaraldehyde reacts preferentially with amine groups and has a variable linker length. As other crosslinking reagents, glutaraldehyde will therefore stabilize preferentially rather compact conformations of a dynamic complex compared to more open conformations.
Small-angle neutron scattering reveals a dynamic HTL complex with a lipid-filled cavity.
In order to explore the component composition and conformation of HTL, we performed SANS on the native HTL complex as well as a mildly cross-linked version of it. The cross-linking procedure was developed to reduce the expected flexibility and to increase the stability of the complex, in aid of subsequent analysis by EM (see below). Through analysis of the D2O/H2O contrast match points, we can determine the composition of our HTL samplewith respect to protein and non-protein components (lipids and detergent). Moreover, we can determine the location of these components relative to one another. Thus, SANS allows an independent, model-free dissection of the HTL three-component system.
Absolute-scale SANS collected at different D2O concentrations were interpreted by a novel contrast match
point (CMP) analysis. The procedure enabled the dissection of the contribution of the protein, lipid and deter-gent components to the HTL structure based on their respective chemical composition and partial specific volume (CMP = 39.0%, 21.7%, 13.1% D2O, respectively, for protein, DDM and lipid). The lipid CMP was
calcu-lated from the lipid composition of the inner E. coli membrane. The measured CMP of the native HTL complex (24 ± 0.2% D2O) indicated a substantial contribution from non-protein components. The protein component
contribution was calculated and subtracted from the complex contrast variation line to yield the CMP of the non-protein component (16.5 ± 0.3% D2O), allowing the lipid/DDM volume ratio to be calculated. The SANS
data indicates that the composition of native and cross-linked HTL in DDM is consistent and mono-disperse, with single copies of each protein subunit. Importantly, the match-point analysis (Fig. 1a, Supplementary Fig. S2, Supplementary Table S1) indicates the native HTL complex isolated in DDM consists of not only the 250 kDa pro-tein component (33 ± 1% v/v) in detergent (26 ± 2% v/v), but also contains a large proportion of lipids (41 ± 3% v/v), equating to 330–390 lipid molecules per HTL complex. Corresponding values for the mildly cross-linked HTL complex are similar for protein and detergent (41 ± 2% and 33 ± 2% v/v), but containing fewer lipids (25 ± 3% v/v, equivalent to 160–200 lipid molecules) (Fig. 1b, Supplementary Fig. S2, Supplementary Table S1). Taken together, these data suggest that lipids form an integral part of the HTL complex, remaining protected from the detergent during extraction from the bacterial membrane.
Furthermore, SANS analysis allowed determining the location and dimensions of the protein and lipid/deter-gent constituents of HTL19. Stuhrmann20 has shown that by changing contrast in SANS, using different solvent
H2O/D2O mixtures, the scattering curve can be interpreted mathematically in terms of the scattering density
distribution within the particle. In the so-called Stuhrmann plot, the square of the radius of gyration is plotted versus inverse contrast (see Methods). A straight line plot indicates that the centres of mass of the density dis-tribution and equivalent homogeneous particle coincide. A positive slope indicates higher density further away from the centre, while a negative slope indicates higher density close to the centre. A parabolic plot indicates
a separation between the centres of mass of particle shape and density distribution. In cross-linked HTL the radius of gyration of lipid/detergent (Rg-lipid/detergent) is 22 ± 4 Å, while that of protein (Rg-protein) is 52 ± 5 Å.
The calculated Rg protein of the EM-reconstruction is ~44 Å (see below) and thus in reasonable agreement with
our SANS Rg-protein, considering the different sample states. The positive slope of the Stuhrmann plot (Fig. 1c)
clearly indicates that the higher-scattering density proteins surround an inner core of lower-scattering density lipids. The native HTL-complex had an equivalent structural organization, but appears to be significantly larger (Rg-lipid/detergent = 49 ± 2 Å; Rg-protein = 75 ± 3 Å). In conclusion, the SANS data imply that the HTL forms
a highly dynamic complex with an extended, open conformation predominant in DDM and a more compact arrangement stabilized by cross-linking. Lipids are an integral part of the HTL complex and are located in the centre surrounded by proteins, as indicated by the smaller radius of gyration of lipids compared to protein.
Nature of the lipids in the HTL preparations.
The presence of lipids in HTL, implicated by SANS, was further confirmed by mass spectrometry. We asked whether a particular lipid species would co-purify with the HTL preparations. The predominant phospholipids of the E. coli inner membrane, phosphatidyl-ethanolamine and phosphatidyl-glycerol, were identified in HTL complexes isolated in DDM and amphipols (Fig. 1d). Thus, the lipid species co-purifying with HTL are representative of those found in the surrounding E. coli inner membrane.Electron microscopy locates YidC and SecYEG within the HTL.
Due to the flexibility of the com-plex (see above), mild glutaraldehyde cross-linking was deployed in order to produce stable, homogeneous particles suitable for analysis by EM. An initial HTL volume was determined using negative-stain EM and random conical tilt (RCT) reconstruction (Supplementary Fig. S3). Subsequently, cryo-EM 2D class-averagesFigure 1. SANS Analysis reveals a dynamic HTL with a lipid-filled cavity. (a,b) Excess scattering length ρ V
of native HTL (a) and cross-linked HTL (b) at different D2O concentrations and resultant calculated scattering
lengths of HTL’s lipid/detergent component. Error bars represent the error in the I(0) determined from the Guinier analysis. (c) Stuhrmann plot for native and cross-linked HTL. The square of the radius of gyration (Rg) is plotted against the inverse of the particles’ neutron scattering contrast Δ ρ . Error bars in the y-direction
represent the errors in Rg determined from the Guinier analysis, and in x-direction the effect of labile
hydrogen-exchange varying between 70% and 90%. The 36% data point for cross-linked HTL is not shown because of the large error associated with the Rg due to the protein component being nearly matched out. (d) Table
summarizing the distinguishable lipid species identified by mass spectrometry in HTL preparations (DDM-solubilized and in amphipols), SecYEG, YidC and in control samples (E. coli total lipids and the cytoplasmic protein SecB). The numbers in bracket include the isobaric lipid species, i.e. these numbers take into account that several lipids in E. coli have an identical mass/charge ratio and therefore cannot be distinguished by MS. The numbers in the table thus indicate how many different lipids were detected, and the numbers in brackets indicate the maximal number of species that could be present in the sample. We note that cardiolipin is present in the control preparations of SecYEG while it is not present or lost in HTL purifications. The false discovery rate in this analysis is very low, since in independent analyses of cytoplasmic SecB (negative control) one or no lipid species were matched.
(Supplementary Fig. S4) were aligned against the RCT reconstruction to generate a cryo-EM volume. 3D max-imum likelihood refinement using 53,648 particles yielded a low-resolution (14 Å) structure (‘gold-standard’ method21 and Fourier shell correlation (FSC) criterion 0.14322, Supplementary Fig. S4c,d) with dimensions of
11.4 nm × 10.6 nm × 9.2 nm (Fig. 2a). The handedness of the reconstruction was confirmed by tilt pair validation (Supplementary Fig. S4e,f).
In parallel, we performed cryo-EM of native HTL complex stabilized by amphipols (Supplementary Fig. S5). The resulting reconstruction of this uncross-linked HTL converged at a similar resolution (15 Å) (‘gold-standard’ refinement21 and FSC criterion 0.14322, Supplementary Fig. S5d) and shows correspondent features to the mildly
cross-linked version. The compaction observed in the un-crosslinked HTL-amphipol sample may originate from loss of detergents and lipids during purification and exchange of detergent with amphipols (see Methods). A striking feature of the visualised HTL is that the protein complex is hollow. Indeed, the SANS data indicates that the interior contains lipids, which we cannot detect by EM at this resolution.
The consistency we observed between the shapes of uncross-linked HTL-amphipol and cross-linked HTL-DDM is noteworthy at this intermediate resolution and compelled us to perform subunit localization by analysing stable HTL sub-assemblies missing individual subunits. We calculated RCT reconstructions for SecYEG-SecDF-YajC (Δ YidC) and SecDF-YajC-YidC (DFYY)23 sub-complexes (Supplementary Fig. S1,
Supplementary Fig. S3b,c) and superimposed them with the HTL RCT volume (Fig. 2b,c). The locations of SecYEG and of the YidC P1-domain were verified in 2D class-averages of the three complexes (Fig. 2b,c). Therefore, we placed an E. coli homology model of SecYEG and the E. coli YidC structure15 as rigid bodies into
the respective EM density of the HTL (Fig. 2d,e, Supplementary Fig. S6). The EM volume representing SecYEG is somewhat reduced when compared to the crystal structure, indicative of flexibility in this region of HTL. Our intermediate resolution EM volumes of the HTL super-complex provided useful boundary conditions to model HTL architecture: The placement of SecYEG and YidC defined the orientation of the HTL complex, localizing the transmembrane (SecYEG) and periplasmic domains (YidC-P1).
Flexibility of the SecD periplasmic domain.
A homology model of the SecDF sub-complex was placed as a rigid body into the remaining density (Fig. 2d), with the exception of the SecD P1-domain. Best fit of P1 was achieved independently from the transmembrane part and the SecF periplasmic domain (P4), by rotation of ~120° (Fig. 3a). In the crystal structure from Th. thermophilus, the SecD P1-base and the SecF P4-domain adopt ferredoxin-like folds17, forming apparently continuous antiparallel β -sheets across the SecD-SecFinterface. However, careful inspection reveals that the P1–P4 interface interaction is weak with only a sin-gle hydrogen-bond present (Supplementary Fig. S7a). Thus, it is conceivable that the periplasmic domains of SecD and SecF can flexibly disengage from one another to adopt the conformation found in HTL. This flexi-bility of the SecD P1-domain is further supported by recent EM reconstructions of Th. thermophilus SecDF24.
Moreover, the region linking TM-helix1 to the P1-domain of SecD is not conserved between Th. thermophilus and E. coli (Supplementary Fig. S7b). Notably, the rotated SecD periplasmic domain is compatible with all the EM reconstructions presented here. The rotated version of the SecDF subcomplex fits into the native HTL-amphipol cryo-EM reconstruction as well as in the negative stain EM reconstructions of cross-linked HTL, SecDFYajC-YidC and of Δ YidC complexes (Supplementary Fig. S7c).
YajC is part of the HTL complex, but its function remained enigmatic. When we include YajC in the HTL model at the proposed position25 it would be bound at the interface of SecDF facing the YidC TM domain and
SecG (Supplementary Fig. S8).
SecD and YidC periplasmic domains are positioned above the translocation pore exit site of SecY.
The quasi-atomic model corresponding to 75% of HTL (Supplementary Fig. S6b) was flexibly-fitted into the map employing the molecular dynamics flexible-fitting method and NAMD2.10, coupling the Cα -chain to the map26.
EM density, not filled by the atomic model, is observed next to the SecD P1-domain (‘D1’ in Fig. 2d), likely due to the fact that the E. coli P1-domain is larger than the corresponding Th. thermophilus P1-domain on which our model is based (Supplementary Fig. S7b). Likewise, unassigned density is observed next to SecYEG in the trans-membrane region (‘D2’ in Fig. 2d) potentially corresponding to two additional N-terminal TMs of SecE and/or TM1 of YidC of which atomic coordinates are not available.
Importantly, in the HTL the three periplasmic domains of SecD, SecF and YidC adopt a ring-like arrange-ment, wherein the SecD P1-head and YidC P1 are positioned at the exit site of the SecY translocation channel (Fig. 3b,c). This interpretation is consistent with previous studies demonstrating cross-links between SecD and SecY/SecE/SecG5, and interactions between the P1-domain of YidC and SecG/SecD/SecF12,27. This arrangement
could enable these large periplasmic domains to contact emerging polypeptides and facilitate their translocation (Fig. 3b), potentially also aided by the PMF28,29.
The YidC transmembrane domain contacts SecY and SecF.
The HTL model is fully compatible with previous functional analyses. For instance, in the HTL membrane-sector, SecG is positioned close to the TM-domain (TMD) of SecD (Fig. 3c), consistent with known genetic interactions3,30. Close-by the SecY lateral gate, densityattributed to the conserved TM domain of YidC extends to YidC P1-domain (Fig. 3c). The resulting proximity of the YidC TMD to SecDF is supported by recent independent screening and complementation experiments31.
The YidC TMD was suggested to facilitate membrane-protein insertion, borne out by cross-linking between nas-cent TM-helices successively to SecY, lipids and finally to YidC10, including YidC-TM332.
Additional cross-links between the cytoplasmic C-terminus of YidC to SecF and SecY (but not to SecD) sup-port the placement of the YidC TMD within the HTL12 (Supplementary Table S2). Similar to SecYEG, the density
corresponding to YidC is somewhat reduced indicating flexibility (Fig. 3c), a feature also apparent in the crystal structure14. In the inner membrane leaflet, towards the cytoplasmic face of the HTL, there is an inter-connecting
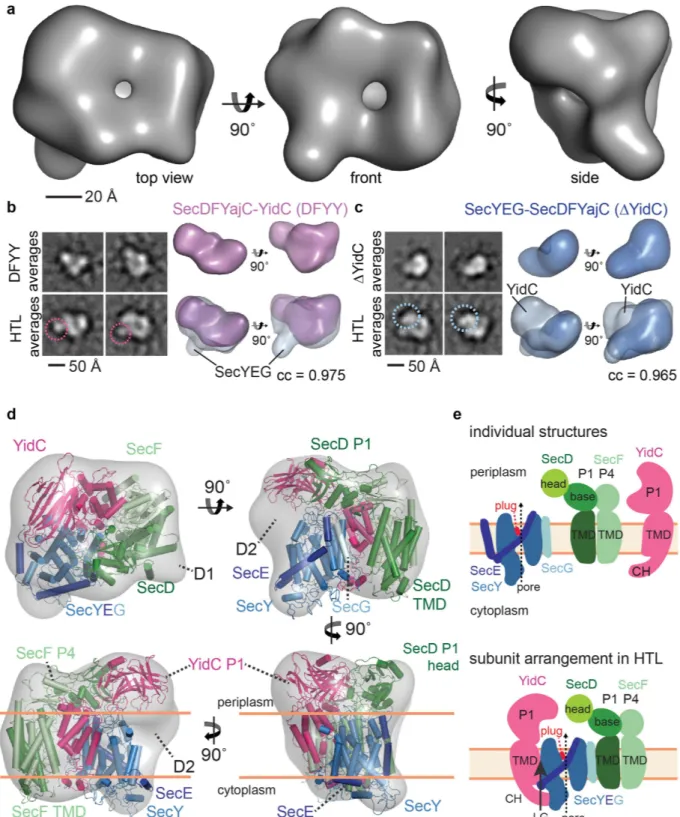
Figure 2. Electron microscopy of HTL and subcomplexes. (a) E. coli holo-translocon cryo-EM reconstruction
displayed in a top (left), front (middle) and side view (right). (b) Localization of SecYEG in HTL. Left: comparison of reference-free 2D class-averages of DFYY and HTL (pink circle: density attributed to SecYEG). Right: RCT reconstruction of DFYY (purple), below: Superimposition of DFYY and HTL (transparent gray) reconstructions (correlation coefficient (cc) 0.975). (c) YidC localization. Left: comparison of reference-free 2D class-averages of Δ YidC and HTL (blue circle: density attributed to YidC). Right: RCT reconstruction of Δ YidC (blue), below: Superimposition of Δ YidC and HTL reconstructions (cc of 0.965). (d) Fitting of crystal structures (YidC) and homology models of SecYEG and SecDF into HTL density (transparent grey), shown in a top (top left), front (top right) and two side views (below). Periplasmic domains of YidC, SecD and SecF are labelled P1 and P4 respectively. Unaccounted density is labelled D1 and D2. (e) Scheme of HTL assembly. SecY is colored marine, SecE dark-blue, SecG cyan, SecD green, SecF light-green, and YidC magenta.
density between YidC and SecY, highlighting an interaction12 (Fig. 3c). Evidently then, YidC is well-positioned
within the HTL to chaperone the entry of TM-helices emerging from the lateral gate of SecYEG into the lipid
Figure 3. Domain arrangement in the HTL complex. (a) Conformational change of the SecD periplasmic
domain placing the P1-head domain above the translocation channel. Comparison (above) and overlay (below) of the SecDF homology model based on the cryo-EM density (green and light-green) and the Th. thermophilus SecDF crystal structure17 (grey). (b) The HTL positions the periplasmic domains of SecD and YidC for substrate
binding. The YidC P1 and SecD P1-head domains are located above the SecY translocation-pore sealed by the plug (red) in the inactive state. YidC P1 has a polyethylene-glycol (PEG) molecule (violet spheres) bound in a putative hydrophobic substrate-binding cleft28. (c) HTL horizontal sections (red lines) in the periplasmic
region (right), outer membrane leaflet (middle) and inner membrane leaflet (left), highlighting the ring-like arrangement of the periplasmic domains, the positioning of YidC next to the lateral gate formed by SecY TM-helices and the position of the water-accessible, intramembrane cavity of YidC in our model, and the existence of a central cavity in HTL. Color coding as in Fig. 2; SecY lateral gate-helices are grey in panel (b,c); the position of the SecY translocation-pore is marked with a yellow star.
bilayer, possibly using the water-accessible YidC cavity as a first binding site for emerging TM-helices14,15,33. The
horseshoe-shape arrangement of the TM-domains of the HTL encloses the central cavity within the protein com-plex (Fig. 3c), which is occupied by phospholipids as evidenced by our SANS analyses.
Discussion
Membrane protein biogenesis and protein secretion are fundamental cellular processes. In particular membrane-protein folding and complex assembly is poorly understood because it is challenging to study exper-imentally. We previously described the generation of an expression system for simultaneous production of all seven subunits of the E. coli holo-translocon complex18. The concomitant over-expression of all seven
constitu-ents of the HTL complex allowed the extraction and isolation of the intact complex in a mild detergent, DDM18.
Subsequent biochemical characterization showed that the HTL preparations are active in co-translational mem-brane protein translocation and in post-translational protein secretion5. HTL was shown to be less active in
pro-tein secretion compared to SecYEG, but pro-OmpA secretion was stimulated much more effectively by the PMF in HTL, likely due to the presence of SecDF5. Importantly, HTL is more active in insertion and assembly of many
membrane protein substrates, compared to SecYEG or YidC alone5,34. Recent proteomics data from E. coli
indi-cate that about 25% of SecYEG could be part of HTL complexes6. In agreement, HTL can be immuno-precipitated
from native E. coli inner membranes using anti-SecG antibodies after membrane treatment with mild detergents3
or with SMALPs (styrene maleic acid lipid particles)34. Taken together, we suggest that HTL has an important
role in supporting membrane protein integration and folding as well as complex formation5,34. It is reasonable to
assume that HTL is not required for all translocation processes and that a large number of translocation substrates can be translocated by SecYEG alone, for instance secreted proteins which appear to be less efficiently translo-cated through HTL5. In light of these assumptions, which still have to be challenged experimentally, we consider
~25% of SecYEG in HTL complexes a very reasonable and significant number.
To explain the mechanism of HTL-conducted protein translocation5, it is essential to understand the
func-tional interplay of SecYEG, SecDF-YajC and YidC during translocation. While crystal structures of SecYEG, SecDF and YidC are available8,14,15,17,35, the subunit organization in the HTL complex remained unclear. Here, we
combined a range of biophysical data to provide mechanistic and structural insights into the HTL membrane pro-tein complex in an integrative approach. Based on the SANS data, EM volumes, subunit localization experiments and available biochemical data3–5,12,27,31 we present a quasi-atomic model of HTL and a working model for HTL
function in translocation into and across the membrane and membrane protein folding (Fig. 4).
Importantly, the architecture of HTL reveals that SecD and YidC P1-domains are positioned above the trans-location pore formed by SecY. Both domains have previously been suggested to interact with transtrans-location sub-strates28,29. Thus, in HTL SecD and YidC P1-domains are optimally positioned to bind and prevent backsliding of
translocation substrates (Fig. 4a). YidC P1 contains an elongated cleft, which in the crystal structure was occupied with a PEG molecule and therefore suggested to bind unfolded non-polar translocated peptides28. The interaction
of the SecD P1-head domain with translocation substrates is suggested to induce conformational changes in the SecDF complex, coupling protein translocation with proton transport across the membrane17, thus using the PMF
to facilitate translocation. In agreement, we previously showed that proOmpA secretion by HTL is stimulated by the PMF5. Consistent with this, the immobilization of SecD upon antibody contact inhibits protein secretion,
causing the accumulation of precursors in vivo29.
Surprisingly, we identified a lipid-filled cavity within the HTL-complex by SANS and EM. We propose that it provides an adaptable, protected environment for membrane-protein insertion, folding and controlled release into the inner membrane (Fig. 4b). Such a mechanism is analogous to those deployed by molecular chaperones such as Trigger-Factor and GroEL, which provide hydrophilic encapsulated environments for folding and then release of globular proteins. With this in mind we suggest the HTL has a chaperone function beyond the activ-ity of YidC alone. In our model, the membrane-protein chaperone YidC assists in folding by binding succes-sive TMs exiting from the SecY lateral gate (Fig. 4b). In HTL, an opening for the release of TM-bundles could then be achieved by YidC flexibly moving away from SecYEG, reminiscent of an airlock with two sealable gates. Similar mechanisms may also operate in the eukaryotic translocation-complex where membrane-proteins are suggested to partition in the lipid bilayer and fold in the vicinity of the Sec61 protein-conducting channel, the translocation-associated membrane-protein (TRAM) and additional associated complexes36; this study supports
a conserved mode of action. The results presented highlight the intricate and highly dynamic structure of HTL and give crucial new insights into the functional interplay between SecYEG, SecDF, YidC and phospholipids, providing a framework for our understanding the universal process of membrane-protein insertion.
Methods
Expression and purification of holo-translocon complex and subcomplexes.
The expression plasmid pACEMBL_HTL3 was generated using the ACEMBL expression system5,18. The ACEMBL acceptorand donor plasmids were combined by Cre-LoxP fusion to yield pACEMBL_DFYY. pACEMBL_HTL3Δ YidC was generated by deletion of the YidC encoding gene from the pACEMBL_HTL3 expression plasmid. HTL and SecDF-YajC-YidC (DFYY) were expressed in BL21star(DE3) (Invitrogen) and affinity purified as described via His6-tags fused to the N–terminus of SecE, the C–terminus of SecD, the C–terminus of YidC and via the
CBP-tag fused to the C–terminus of YajC5 with the following modifications: The Ni-NTA affinity-purified protein was
transferred into CBP buffer (50 mM Hepes-KOH, 130 mM NaCl, 10% glycerol, 2 mM CaCl2, 0.03% DDM, pH
8.0) using a desalting column (GE Healthcare) and loaded onto a calmodulin affinity column (Stratagene). HTL was eluted with CBP elution buffer containing 2 mM EGTA. For electron microscopy and biophysical characteri-zation, the complexes were stabilized by mild glutaraldehyde cross-linking37. 1.5 mg (2 ml) HTL was loaded onto
a 40 ml glycerol gradient from 10% to 30% glycerol and from 0 to 0.15% glutaraldehyde in 20 mM Hepes-KOH, 130 mM NaCl, 5 mM Mg(OAc)2, 0.03% DDM, pH 8.0 and centrifuged for 36.5 h at 83,000 × g and 4 °C (SW32
rotor, Beckman Coulter). The fraction (1 ml) containing HTL was supplemented with 100 μ g of lysine and con-centrated using a concentrator with a molecular weight cut-off (MWCO) of 30 kDa (Amicon). The concon-centrated fraction was further purified using a Superose6 column (GE Healthcare) equilibrated with HSM buffer (20 mM Hepes-KOH, 130 mM NaCl, 2 mM Mg(OAc)2, 0.03% DDM, pH 8.0). pACEMBL_HTL3Δ YidC was expressed in
BL21star(DE3) (Invitrogen) and purified as described above. In the purified HTL3Δ YidC complex, a band corre-sponding to YidC in the complex could not be detected, neither in the Coomassie-stained SDS gel nor by Western blot using a mouse anti-YidC antibody, which recognizes the YidC periplasmic domain (Supplementary Fig. S1) in agreement with a very strong overexpression of SecYEG-SecDFYajC compared to the endogenous levels of YidC.
For HTL-amphipol reconstitution, the CBP-affinity purified HTL was transferred in desalting buffer (20 mM Hepes-KOH, 130 mM NaCl, 5% glycerol, 0.03% DDM, pH 8.0) using a disposable desalting column (Bio-Rad). A8-35 amphipols (Anatrace) were added to the protein solution at a protein:amphipol mass ratio of 1 to 4 and incubated under gentle agitation for 2 hours at 4 °C. In the meantime, biobeads (Bio-Rad) were washed for 30 minutes in methanol under gentle agitation followed by three washes in milliQ water for 5 minutes. The deter-gent molecules were removed from the solution by adding biobeads to the protein solution at a deterdeter-gent:biobead mass ratio of 1 to 20 and incubated overnight at 4 °C under gentle agitation. The protein/amphipols solution was recovered by pipetting and subjected to ultracentrifugation for 30 minutes at 47,000 × g and 4 °C (TLA55 rotor, Beckman Coulter). Subsequently, the sample was concentrated using a concentrator with a molecular weight cut-off (MWCO) of 30 kDa (Amicon) and subjected to size exclusion chromatography using a Superdex200 col-umn (GE Healthcare) equilibrated with 20 mM Hepes-KOH, 130 mM NaCl, 5% glycerol, pH 8.0.
Analytical ultracentrifugation.
Absorbance at 280 nm and interference profiles were measured for 16 h at 35,000 rpm and 10 °C in a Beckman XL-I analytical ultracentrifuge with an An-60Ti rotor with 12 mm opti-cal path length cell equipped with sapphire windows. Data were analysed as described38. A frictional ratio of1.3 and a partial specific volume of 0.76 (intermediate between that of the protein complex with an expected
Figure 4. Mechanistic model of protein translocation catalyzed by the holo-translocon. (a) Protein
translocation through SecYEG driven by the PMF and SecDF. The YidC periplasmic and SecD P1-head domains are positioned to interact with translocation substrates preventing backsliding of the polypeptide through the translocation channel. Translocation is additionally energized by SecA ATPase or the translation machinery. (b) Membrane-protein integration and folding can occur at the interface between the SecY lateral gate and YidC in a protected lipid-HTL environment where TM-helices are suggested to accumulate until they can fold into a structured domain.
molecular mass of 250 kDa and that of the detergent) were used. Sample density and viscosity were 1.007 g/ml and 1.35 mPa·s, respectively, as determined with Sednterp.
Random conical tilt reconstructions.
Holo-translocon, DFYY and Δ YidC (~0.15 mg/ml each) were absorbed to a carbon-coated electron microscopy grid for 30 s, and negatively stained with 1% uranyl acetate for 30 s. A total of 300 micrographs were recorded at room temperature on a BioTwin CM120 electron micro-scope (FEI) at a magnification of 71,550× and a defocus of ∼ 2 μ m at 120 kV, using a 4 k × 4 k CCD camera. Two consecutive images of the same area were taken at 45° and 0° tilt angles under low-dose conditions. The contrast transfer function (CTF) was analyzed and corrected using BCTF (Bsoft package ref. 39). 11,653 HTL, 9,908 DFYY and 10,986 Δ YidC tilt pairs were selected manually using Tiltpicker40. Untilted images were aligned usingitera-tively refined 2D class averages as references and were subjected to multivariance statistical analysis (MSA) and Hierarchical Ascendant Classification for clustering into 400 class-averages with IMAGIC-541. 400 volumes were
calculated from the 2D classes and were aligned, averaged and clustered using Xmipp MLtomo42 to compensate
for the missing cone, resulting in 10 RCT reconstructions for each sample. The two most populated volumes of each sample were subjected to further refinement cycles through projection matching with Spider43, additionally
including 15,000 untilted images for HTL, 13,465 for DFYY and 11,473 for Δ YidC. For all samples, the two volumes converged during refinement. For subunit mapping, the 3D volumes of HTL, DFYY and Δ YidC were superimposed using Chimera (http://www.cgl.ucsf.edu/chimera).
Electron Cryo-Microscopy.
Purified HTL (0.15 mg/ml) was applied to a thin carbon foil sustained by a holey carbon grid (Quantifoil 2/2) and plunge-frozen in liquid ethane with controlled temperature and humidity (Vitrobot, FEI). Samples were imaged under low-dose conditions (~10 e− Å−2) at a magnification of 78,000× ona Polara cryo-transmission electron microscope (FEI) at 100 kV. 2,500 micrographs were recorded on a 4 k × 4 k direct electron detector (Falcon I, FEI) at 1.36 Å/pix and coarsened three times resulting in a final pixel size of 4.08 Å. HTL-amphipols were plunge-frozen using holey-carbon grids (Quantifoil 2/2) and imaged on a Titan Krios (FEI) equipped with a 4 k × 4 k direct electron detector (Falcon II) at a pixel size of 1.01 Å using 36 elec-trons per Å2. We also collected data at 300 kV, but we then could not identify the particles in the vitreous ice with
confidence.
Image Processing.
The CTF was determined using Bsoft39, and the image phases were flipped accordingly.Using EMAN244, 84,732 particles were boxed, subjected to 2D MSA and classification and compared to
projec-tions of the refined HTL RCT volume. At this step, 300 2D class-averages corresponding to 23,749 particles of crosslinked HTL and 35,521 particles of HTL-amphipols were rejected based on visual inspection and lower correlation with the projections from the RCT model. The RCT volume was used to assign the projection angles to the remaining 800 2D class-averages of HTL and 1,000 class-averages of HTL-amphipols to calculate the 3D reconstruction from the cryo-EM data with the BP RP program of Spider43. The resulting initial cryo-EM
vol-umes contained 60,983 HTL particles and 119,346 HTL-amphipol particles. For the HTL-amphipol sample, 3D classification resulted in one class with improved features (Supplementary Fig. S5f), which was subjected to max-imum likelihood 3D refinement until convergence in Relion45. The final reconstructions of crosslinked HTL and
of HTL-amphipols after gold-standard refinement21 contained 53,648 and 23,381 particles respectively. After
high-resolution noise substitution46, the resolution of the structures was 14 Å for the cross-linked HTL and 15 Å
for HTL-amphipols, based on the Fourier shell correlation criterion 0.14322 (Supplementary Figs S4c, S5d).
Tilt Pair Validation.
To confirm the handedness of the map, HTL and 70 S ribosome samples were negative stained and imaged on the same electron microscope at 0° and 10° tilt angles, using the same magnification and detector. Particles were manually picked in e2RCTboxer, and aligned to the random-conical-tilt reconstruction of HTL (Supplementary Fig. S3) and the cryo-EM map of a 70 S ribosome47 respectively using Relion. Dots wereplotted in e2tiltvalidate44 with filtering to exclude those with out-of-plane rotation larger than 30°. The position
of each dot represents the direction and the amount of tilting for a particle pair in polar coordinates. For both samples dots cluster in the same direction of the plot at a tilt angle of approximately 10°. This confirms that our HTL map has the correct handedness (the same as the 70 S ribosome map).
Generation of the quasi-atomic model of the HTL.
Homology models of SecD and SecF were gener-ated based on the crystal structure of Th. thermophilus SecDF17 using ClustalW2 (http://www.clustal.org/clustal2/,and the Swiss-Model workspace (http://swissmodel.expasy.org/). The SecYEG homology model is based on the
Methanococcus jannaschii SecYEβ structure8 which represents an inactive translocon where the channel is sealed
with a plug. Moreover, we used the E. coli YidC crystal structure for model building15. The structures were placed
into the EM map with Chimera (http://www.cgl.ucsf.edu/chimera) and Pymol (DeLano Scientific). For SecD, the periplasmic domain was fitted independently from the TMDs (Fig. 3a). Interactive fitting of atomic structures was performed using molecular dynamics flexible-fitting simulations at 300 K48,49. Only Cα atoms were coupled to
the density, in vacuum, with a g-scale of 0.3. The simulation was run for 10 ns till RMSD from the initial structure converged to 5 Å and the global correlation coefficient increased to 86%. The resulting atomic model is embedded into a 3POPE: 1POPG membrane, solvated, ionized.
Lipid/detergent density in the HTL.
Our SANS experiments (Fig. 1a) unambiguously demonstrate that a large fraction of lipids and DDM (~60% v/v) is present in the lipid-filled cavity and surrounding the pro-tein. Notwithstanding, when we analysed the very same sample by cryo-EM, we did not detect the lipids in the cryo-EM density at the current resolution, neither as positive nor as negative density. We attribute this to flexi-bility. In fact, the EM density volumes for SecYEG and the TM domain of YidC appear smaller than the corre-sponding protein volume, indicating flexibility. We hypothesize that the lipid and detergent in the central cavityand surrounding the HTL may be likewise flexible and lack the order required for visualization at the current resolution.
Lipid analysis by mass spectrometry.
Samples preparation. 800 pmol of five samples named as YidC,SecYEG, SecB, detergent-solubilized HTL (DDM) and HTL in amphipol A8-35 (HTL-amphipol) were dissolved in 1 ml of HEPES buffers (pH 8.0). 0.03% DDM was added to YidC, SecYEG and HTL (DDM). 3.5 ml of chloro-form:methanol solution (1:2 v/v) was added to the samples and agitated for 30 seconds. Subsequently, 0.5% acetic acid in 500 mM NaCl was added (to increase the yield of phospholipids) and agitated for 30 seconds. Finally 1.25 ml of chloroform was added and agitated for 30 seconds. Finally, the samples were centrifuged in swing-out centrifuge for 10 minutes at 1200 rpm. 2 ml of the bottom layer comprising the lipids were collected and trans-ferred into a new glass tube. The extraction was evaporated in a desiccator under vacuum for 3 hours at room temperature.
Mass spectrometry. Samples were resuspended in the 200 μ l 50/50 (v/v) acetonitrile/water for 10 min
at room temperature and subsequently centrifuged for 10 mins at 13,000 rpm. The supernatant was ana-lyzed on a LTQ-Orbitrap Velos mass spectrometer (Thermo Fisher Scientific) coupled with Dionex Ultimate 3000 RSLC nano system. The column with a spray emitter (75-μ m inner diameter, 8-μ m opening, 160 mm length; New Objectives) that was packed with C18 material (ReproSil-Pur C18-AQ 3 μ m; Dr Maisch GmbH, Ammerbuch-Entringen, Germany) using an air pressure pump (Proxeon Biosystems). The mobile phase A con-sisted of 50/50 (v/v) acetonitrile/water. Mobile phase B concon-sisted of 9/10 (v/v) isopropanol/acetonitrile. 0.05% (v/v) ammonia solution was added into both buffer A and B. Samples were loaded onto the column with 100% A at 500 nL/min flow rate and eluted at 300 nL/min flow rate with linear gradient increase from 65% B to 98% B in 29 minutes; then keep 98% B for 15 minutes. The eluted phospholipids were directly sprayed into the mass spec-trometer. The LTQ-Orbitrap Velos was operated in negative ion mode with spray voltage of 1.8 kV and capillary temperature of 240 °C. Full scan MS were acquired in the Orbitrap (m/z 350–2000) with a resolution of 100,000 and an automatic gain control (AGC) target at 1E6. The three most intense ions were selected for CID fragmen-tation in the ion trap and HCD in the Orbitrap with dynamic exclusion for 120 s. Ions with unrecognized charge state were excluded. CID normalized energy 38%, activation of q 0.25, activation time 30 ms, AGC 10,000; HCD normalized energy 65%, activation time 40 ms, AGC 50,000, resolution 7500.
Data Analysis. Data were analysed by LipidSearch software (version1.0, Thermo Fisher Scientific). Database:
Orbitrap, search type: Product; Exp Type: LC-MS; Precursor tol: 5 ppm; Product tol: 0.2 Da; Intensity threshold, relative 1%; m-Score Threshold: 10.0. Class: PE, PG, CL; Ion: -H and -2H. Each sample was run 4 times. All the reported lipid ions were identified at least twice.
Small angle neutron scattering of holo-translocon.
Sample preparation. Native HTL was purifiedas described (ref. 5).
SANS data collection. HTL complexes were concentrated and buffer exchanged into the appropriate D2O buffers
using a 50 kDa MWCO centrifugation filter (Millipore). An experimentally determined molar extinction coeffi-cient of ε HTL = 497,000 M−1 cm−1 was used to estimate protein concentration (c = 0.5 A mg.ml−1, where A is the
absorbance at 280 nm for 1 cm pathlength). The protein complexes were stored at 4 °C and used within 48 h after gel filtration. Scattering data for the native HTL were collected on beamline D22 at the Institut Laue Langevin (ILL, Grenoble, France), using 6 Å wavelength, at two instrumental detector/collimator configurations, 2 m/2 m and 5.6 m/5.6 m. SANS data for the cross-linked HTL were collected on beamline KWS-2 at Jülicher Zentrum für Forschung mit Neutronen (JCNS, Garching, Germany), using 6 Å wavelength, at distances 1.67 m and 7.67 m with collimation at 4 m and 8 m, respectively.
The samples were measured in Hellma quartz cells 100QS with either 0.100 or 0.200 cm optical path. The temperature was kept between 4 and 8 °C. Scattering patterns were radially averaged and corrected for buffer scattering and detector responses using standard software from the ILL (ftp://ftp.ill.eu/pub/cs/sans/SansManual_ and_2012update.pdf) and from JCNS (www.qtikws.de). The scattering data from H2O buffer was used to place
the data on an absolute scale.
SANS data analysis. Guinier analysis of the data was accomplished using Igor Pro software (WaveMetrics, Lake
Oswego, OR) with SANS macros developed at the NCNR (NIST, Gaithersburg, USA). The Guinier approximation straight line fit was used on the low-Q portions of the data to obtain values and errors for the radius of gyration Rg and the forward scattering intensity I(0) of the samples19. In general, the Guinier approximation is considered
valid for q.Rg ~1. For certain globular shapes, however, the linear range can extend significantly further.
The linear dependence of the excess scattering length of the particle obtained from the square root of I(0) divided by concentration versus solvent scattering length density expressed as equivalent percentage of D2O
(Fig. 1a,b) indicates that the scattering particle was constant for all D2O conditions measured—i.e. in both
com-position (protein-lipid-DDM stoichiometry) and association state (mild aggregation or polydispersity). The scattering length ρ(∆ .V) was determined by using the formula:
λ π ρ = − × ∆ . − I cTt f T N M V (0) ( ) 4 1 10 ( ) (1) H O A w 3 2 2
c: protein concentration in mg/ml; T: transmission of the sample, t: optical path length. The first bracket on the
second bracket converts mass concentration into number of particles. MW: molar mass of protein component; NA: Avogadro’s number. ρ ρ ρ ∆ .V = ∆ .V + ∆ .V ( ) ( )P ( )L (2) ρ ∆ .V
( ) is the sum fo protein and non-protein (lipid/detergent) component scattering lengths, respectively: Equation (1) results in the scattering length of the complex at X% D2O is therefore proportional to √ (I(0)/C
at X% D2O. The theoretical scattering length of the protein component was calculated using MULCh50. The
oligo-meric state of the protein was determined directly from the 0% D2O data as (∆ .ρ V)≥ ∆ .( ρ V)P. The molar
mass of the protein component alone, calculated from the extrapolation to 0% D2O of √ (I(0)/C) at the lipid/
DDM match point (16.5% and 18% D2O respectively for the native and the cross-linked HTL) putting a zero value
at 39% the match point of the protein, indicated that the HTL complex included one copy of each subunit. Contrast match point Matchtotal for the particle occurs at D2O concentration ρ(∆ .V)=0. It is significantly
lower than that of protein alone indicating the presence of a component (DDM/detergent mixture) of lower CMP. Incorporating into the above equations the experimental √ (I(0)/C vs %D2O line permitted the determination of
the volume and CMP of the lipid/DDM component. Correspondingly, the contrast match points for the protein and non-protein components of the particle were estimated as follows. Recasting formula (2) gives
× = × + ×
Vtotal Matchtotal VP MatchProt VL MatchL (3)
Vtotal: volume of particle; VP: volume of protein; MatchP: match point of protein. VL: volume of non-protein
com-ponent; MatchL: match point of non-protein component. Vtotal is the sum of VP and VL. VP was directly calculated
from the protein sequence and thus the volumes of particle and non-protein component were derived from the scattering data.
A similar approach was pursued to determine the composition of the non-protein component of the particle. Contrast match points of detergent and lipids have been measured here (for DDM) and by others19. The lipid
CMP was calculated from the lipid composition of the inner E. coli membrane. Note the contrast match points of proteins, detergent and lipids are significantly different (39.0%, 21.7% and 13.1%). We included an extra 5% error for the lipid/detergent scattering length due to estimating the level of labile Hydrogen-exchange for the protein component of HTL. Based on this, we estimated the proportion (v/v) of protein, lipid and detergent: 33 ± 1% pro-tein, 41 ± 3% lipid, 26 ± 2% detergent for the native HTL, and 41 ± 2% propro-tein, 25 ± 3% lipid, 33 ± 2% detergent for the mildly cross-linked sample used for EM.
Guinier-derived Rg values were used for the calculation of the Stuhrmann plot19,20. Rgs determined from
dif-ferent D2O concentrations are related to contrast by R2g=R2c+ α ∆ − β ∆/ ρ / ρ2 (Δ ρ is mean contrast for HTL;
Rc is Rg at infinite contrast, α and β are scattering density related coefficients; α relates to the distribution of
scat-tering densities relative to the center of mass; β provides the separation of the mass centers of the two compo-nents). The radius of gyration of the individual components of the HTL complex was determined by plotting the observed overall Rg against the inverse of the total contrast ( ρ∆ −1). The observation that the data can be fit
line-arly (β ≈ 0) implies the centers of mass of the two components coincide within the accuracy of the measurements. Moreover, the positive slope of the fit at infinite contrast (Δ ρ−1 = 0) in Fig. 1b demonstrates that the higher
con-trast component (here protein) lies towards the periphery of the complex. Consequently, the HTL has a lipid/ detergent core surrounded by protein.
The observed Rg can also be recast as follows:
ρ ρ ρ ρ ρ ρ ρ ρ = ∆ . ∆ . + ∆ . ∆ . + ∆ . ∆ . . ∆ . ∆ . . R V V R V V R V V V V D (4) g P P total P L L total l P P total L L total 2 2 2 2
where ρ∆ and V are for the protein (P), the non-protein components (L) and the total particle (total). D is the distance between the centers of mass of the protein and of the non-protein components. In the parallel axis anal-ysis, if ρ = ρ ∆ . ∆ . X V V P P
total and therefore = −
ρ ρ ∆ . ∆ . (1 X) V V L L
total , formula (4) should be rewritten as:
= . + − . + . − .
Rg2 X RP2 (1 X R) l2 X (1 X D) 2 or more clearly,
= − . + − + . + .
Rg2 D X2 2 (RP2 Rl2 D2) X Rl2
The observed Rg plotted against X would yield the same information as the Stuhrmann plot. Here however, at
X = 1, the scattering will only be due to the protein component, and at X = 0, the scattering will only due to the non-protein component.
References
1. Rapoport, T. A. Protein translocation across the eukaryotic endoplasmic reticulum and bacterial plasma membranes. Nature 450, 663–669 (2007).
2. Dalbey, R. E., Wang, P. & Kuhn, A. Assembly of bacterial inner membrane proteins. Annu Rev Biochem 80, 161–187 (2011). 3. Duong, F. & Wickner, W. Distinct catalytic roles of the SecYE, SecG and SecDFyajC subunits of preprotein translocase holoenzyme.
EMBO J 16, 2756–2768 (1997).
4. Scotti, P. A. et al. YidC, the Escherichia coli homologue of mitochondrial Oxa1p, is a component of the Sec translocase. EMBO J 19, 542–549 (2000).
5. Schulze, R. J. et al. Membrane protein insertion and proton-motive-force-dependent secretion through the bacterial holo-translocon SecYEG-SecDF-YajC-YidC. Proc Natl Acad Sci USA 111, 48844–48849 (2014).
6. Li, G. W., Burkhardt, D., Gross, C. & Weissman, J. S. Quantifying absolute protein synthesis rates reveals principles underlying allocation of cellular resources. Cell 157, 624–635 (2014).
7. Pogliano, J. A. & Beckwith, J. SecD and SecF facilitate protein export in Escherichia coli. EMBO J 13, 554–561 (1994). 8. Van den Berg, B. et al. X-ray structure of a protein-conducting channel. Nature 427, 36–44 (2004).
9. Samuelson, J. C. et al. YidC mediates membrane protein insertion in bacteria. Nature 406, 637–641 (2000).
10. Urbanus, M. L. et al. Sec-dependent membrane protein insertion: sequential interaction of nascent FtsQ with SecY and YidC. EMBO
Rep 2, 524–529 (2001).
11. Nagamori, S., Smirnova, I. N. & Kaback, H. R. Role of YidC in folding of polytopic membrane proteins. J Cell Biol, 165, 53–62 (2004).
12. Sachelaru, I. et al. YidC occupies the lateral gate of the SecYEG translocon and is sequentially displaced by a nascent membrane protein. J Biol Chem 288, 16295–16307 (2013).
13. van der Laan, M. et al. A conserved function of YidC in the biogenesis of respiratory chain complexes. Proc Natl Acad Sci USA 100, 5801–5806 (2003).
14. Kumazaki, K. et al. Structural basis of Sec-independent membrane protein insertion by YidC. Nature 509, 516–520 (2014). 15. Kumazaki, K. et al. Crystal structure of Escherichia coli YidC, a membrane protein chaperone and insertase. Sci Reports 4, 7299
(2014).
16. Arkowitz, R. A. & Wickner, W. SecD and SecF are required for the proton electrochemical gradient stimulation of preprotein translocation. EMBO J 13, 954–963 (1994).
17. Tsukazaki, T. et al. Structure and function of a membrane component SecDF that enhances protein export. Nature 474, 235–238 (2011).
18. Bieniossek, C. et al. Automated unrestricted multigene recombineering for multiprotein complex production. Nat Methods 6, 447–450 (2009).
19. Svergun, D. I., Koch, M. H. J., Timmins, P. A. & May, R. P. Small Angle X-Ray and Neutron Scattering from Solutions of Biological
Macromolecules Oxford University Press (2013).
20. Stuhrmann H. B. Neutron small-angle scattering of biological macromolecules in solution. J. Appl. Cryst. 7, 173–178 (1974). 21. Scheres, S. H. & Chen, S. Prevention of overfitting in cryo-EM structure determination. Nat Methods 9, 853–854 (2012).
22. Rosenthal, P. B. & Henderson, R. Optimal determination of particle orientation, absolute hand, and contrast loss in single-particle electron cryomicroscopy. J Mol Biol 333, 721–745 (2003).
23. Nouwen, N. & Driessen, A. J. SecDFyajC forms a heterotetrameric complex with YidC. Mol Microbiol 44, 1397–1405 (2002). 24. Mio, K. et al. Conformational variation of the translocon enhancing chaperone SecDF. J Struct Funct Genomics 15, 107–15 (2013). 25. Du, D. et al. Structure of the AcrAB-TolC multidrug efflux pump. Nature 509, 512–515 (2014).
26. Stone, J. E., McGreevy, R., Isralewitz, B. & Schulten, K. GPU-accelerated analysis and visualization of large structures solved by molecular dynamics flexible fitting. Faraday Discussions 169, 265–283 (2014).
27. Xie, K., Kiefer, D., Nagler, G., Dalbey, R. E. & Kuhn, A. Different regions of the nonconserved large periplasmic domain of
Escherichia coli YidC are involved in the SecF interaction and membrane insertase activity. Biochemistry 45, 13401–13408 (2006).
28. Ravaud, S., Stjepanovic, G., Wild, K. & Sinning, I. The crystal structure of the periplasmic domain of the Escherichia coli membrane protein insertase YidC contains a substrate binding cleft. J Biol Chem 283, 9350–9358 (2008).
29. Matsuyama, S., Fujita, Y. & Mizushima, S. SecD is involved in the release of translocated secretory proteins from the cytoplasmic membrane of Escherichia coli. EMBO J 12, 265–270 (1993).
30. Kato, Y., Nishiyama, K. & Tokuda, H. Depletion of SecDF-YajC causes a decrease in the level of SecG: implication for their functional interaction. FEBS Lett 550, 114–118 (2003).
31. Li, Z., Boyd, D., Reindl, M. & Goldberg, M. B. Identification of YidC residues that define interactions with the Sec Apparatus. J Bact 196, 367–377 (2014).
32. Yuan, J., Phillips, G. J. & Dalbey, R. E. Isolation of cold-sensitive yidC mutants provides insights into the substrate profile of the YidC insertase and the importance of transmembrane 3 in YidC function. J Bact 189, 8961–8972 (2007).
33. Shimokawa-Chiba, N. et al. Hydrophilic microenvironment required for the channel-independent insertase function of YidC protein. Proc Natl Acad Sci USA 112, 5063–5068 (2015).
34. Komar, J. et al. Membrane protein insertion and assembly by the bacterial holo-translocon SecYEG-SecDF-YajC-YidC. Biochem J 473, 3341–3354 (2016).
35. Li, L. et al. Crystal structure of a substrate-engaged SecY protein-translocation channel. Nature 531, 395–399 (2016). 36. Skach, W. R. Cellular mechanisms of membrane protein folding. Nat Struct Mol Biol 16, 606–612 (2009).
37. Kastner, B. et al. GraFix: sample preparation for single-particle electron cryomicroscopy. Nat Methods 5, 53–55 (2008).
38. Deniaud, A. et al. Oligomeric status and nucleotide binding properties of the plastid ATP/ADP transporter 1: toward a molecular understanding of the transport mechanism. PloS One 7, e32325 (2012).
39. Heymann, J. B. & Belnap, D. M. Bsoft: image processing and molecular modeling for electron microscopy. J Struct Biol 157, 3–18 (2007).
40. Voss, N. R., Yoshioka, C. K., Radermacher, M., Potter, C. S. & Carragher, B. DoG Picker and TiltPicker: software tools to facilitate particle selection in single particle electron microscopy. J Struct Biol 166, 205–213 (2009).
41. van Heel, M., Harauz, G., Orlova, E. V., Schmidt, R. & Schatz, M. A new generation of the IMAGIC image processing system. J Struct
Biol 116, 17–24 (1996).
42. Scheres, S. H., Melero, R., Valle, M. & Carazo, J. M. Averaging of electron subtomograms and random conical tilt reconstructions through likelihood optimization. Structure 17, 1563–1572 (2009).
43. Shaikh, T. R. et al. SPIDER image processing for single-particle reconstruction of biological macromolecules from electron micrographs. Nat Protoc 3, 1941–1974 (2008).
44. Tang, G. et al. EMAN2: an extensible image processing suite for electron microscopy. J Struct Biol 157, 38–46 (2007).
45. Scheres, S. H. RELION: implementation of a Bayesian approach to cryo-EM structure determination. J Struct Biol 180, 519–530 (2012).
46. Chen, S. et al. High-resolution noise substitution to measure overfitting and validate resolution in 3D structure determination by single particle electron cryomicroscopy. Ultramicroscopy 135, 24–35 (2013).
47. von Loeffelholz, O. et al. Ribosome-SRP-FtsY cotranslational targeting complex in the closed state. Proc Natl Acad Sci USA 112, 3943–3948 (2015).
48. Stone, J. E., McGreevy, R., Isralewitz, B. & Schulten, K. GPU-accelerated analysis and visualization of large structures solved by molecular dynamics flexible fitting. Faraday Discussions 169, 265–283 (2014).
49. Phillips, J. C. et al. Scalable molecular dynamics with NAMD. J Comput Chem 26, 1781–1802 (2005).
50. Whitten, A. E., Cai, S. & Trewhella, J. MULCh: modules for the analysis of small-angle neutron contrast variation data from biomolecular assemblies. J. Applied Cryst 41, 222–226 (2008).
Acknowledgements
We are extremely grateful to Wim Hagen for data collection, as well as to Karine Huard, Jesus Gomez and Sarah Zorman for assistance. We thank Ryan Schulze for his efforts during the early stages of this project and Robin
Corey for a constructive critique on the structure of the HTL. R.M. received a University of Bristol Postgraduate Scholarship. J.L. and A.D. were supported by an EMBL and EU Marie Curie Actions Cofund grant (EIPOD), K.K. by a postdoctoral EMBO fellowship (ALTF 900–2009). I.B. is supported by EC FP7 ComplexINC. We acknowledge support from the French Infrastructure for Integrated Structural Biology (FRISBI) [ANR-10-INSB-05-01] and INSTRUCT as part of the European Strategy Forum on Research Infrastructures (ESFRI). Additional support was gratefully received by I.C. from the BBSRC (BB/M003604/1 and BB/I008675/1). We are grateful to the Institut Laue Langevin and the Jülicher Zentrum für Forschung mit Neutronen for the use of their facilities and assistance of Anne Martel and Marie-Soussai Appavou. We thank Susan Krueger and Joseph Curtis for discussions about the neutron analysis, and Zhuo Angel Chen, Lutz Fischer, Colin Combe, Lauri Peil, Salman Tahir and Jimi-Carlo Bukowski-Wills for support during the MS analysis. The Wellcome Trust supported this work through a Senior Research Fellowship to J.R. (103139), a Wellcome Trust Centre Core Grants (092076) and an instrument grant (108504). CS acknowledges support by contract research ‘Methoden für die Lebenswissenschaften’ of the Baden-Württemberg Stiftung (Meth-P-LS-4), by the Agence Nationale de la
Recherche (ANR- 09-JCJC-0044) and by the BBSRC (BB/P000940/1). Sadly Klaus Schulten passed away October
31, 2016.
Author Contributions
M.B. purified proteins; M.B. and K.K. collected negative-stain EM data; M.K., G.P. and P.S. collected cryo-EM data; Q.J., K.K. and M.B. performed image analysis. R.M., N.Z. and G.Z. performed SANS experiments and analysed the data. J.L.N. generated expression constructs and purified proteins; R.M. purified native HTL; J.Z. and J.R. performed mass spectrometry; A.D. performed analytical ultracentrifugation experiments; A.S.R. and K.S. generated homology models and flexibly fitted the model into the EM density. I.B., I.C. and C.S. conceived the project, guided the experiments, and wrote the paper with input from N.Z. and G.Z.
Additional Information
Accession Codes: The HTL map and atomic model have been deposited in the EMDB and PDB with accession
codes EMD-3506 and PDB ID 5MG3.
Supplementary information accompanies this paper at http://www.nature.com/srep Competing financial interests: The authors declare no competing financial interests.
How to cite this article: Botte, M. et al. A central cavity within the holo-translocon suggests a mechanism for
membrane protein insertion. Sci. Rep. 6, 38399; doi: 10.1038/srep38399 (2016).
Publisher's note: Springer Nature remains neutral with regard to jurisdictional claims in published maps and
institutional affiliations.
This work is licensed under a Creative Commons Attribution 4.0 International License. The images or other third party material in this article are included in the article’s Creative Commons license, unless indicated otherwise in the credit line; if the material is not included under the Creative Commons license, users will need to obtain permission from the license holder to reproduce the material. To view a copy of this license, visit http://creativecommons.org/licenses/by/4.0/