Unveiling Network and Service Performance
Degradation in the Wild with mPlane
Pedro Casas
∗, Pierdomenico Fiadino
∗, Sarah Wassermann
∗§, Stefano Traverso
†Alessandro D’Alconzo
∗, Edion Tego
‡, Francesco Matera
‡, Marco Mellia
†∗
FTW Vienna,
†Politecnico di Torino,
‡Fondazione Ugo Bordoni,
§University of Li`ege
Corresponding Author: [email protected]/[email protected]
Abstract—Unveiling network and service performance issues in complex and highly decentralized systems such as the In-ternet is a major challenge. Indeed, the InIn-ternet is based on decentralization and diversity. However, its distributed nature leads to operational brittleness and difficulty in identifying the root causes of performance degradation. In such a context, network measurements are a fundamental pillar to shed light and to unveil design and implementation defects. To tackle this fragmentation and visibility problem, we have recently conceived mPlane, a distributed measurement platform which runs, collects and analyses traffic measurements to study the operation and functioning of the Internet. In this paper, we show the potentiality of the mPlane approach to unveil network and service degradation issues in live, operational networks, involving both fixed-line and cellular networks. In particular, we combine active and passive measurements to troubleshoot problems in end-customer Internet access connections, or to automatically detect and diagnose anomalies in Internet-scale services (e.g., YouTube) which impact a large number of end-users.
Index Terms—mPlane; Distributed Measurements; Internet Monitoring; Automatic Troubleshooting Support; Anomaly De-tection.
I. INTRODUCTION
Since the early days of the Internet, network measurements have always constituted a pillar to understand the behavior of the network, specially when something goes wrong. To address this issue we have recently conceived mPlane, a large-scale network measurement and analysis framework. mPlane is a distributed measurement architecture to coordinate traffic measurements, with built-in support for iterative measurement and, most of all, automated and advanced analysis. Probes, which perform measurements, Repositories, which store, ag-gregate, correlate, and analyze them, and a Supervisor which orchestrates components, are the basic of mPlabe. Reasoners are intelligent building blocks that extract knowledge, and offer support to network administrators.
The complete mPlane architecture has been previously presented in [1], where only some simple examples of ap-plications have been discussed. In this paper, we briefly recall the mPlane architecture – see Sec.II. Then we fully develop use cases, which focus on highlighting and troubleshooting on end-customer Internet issues. In particular, we show how to use mPlane to detect and diagnose network and service performance degradation events in operational ISP (Internet Service Provider) networks, exploiting the richness of the
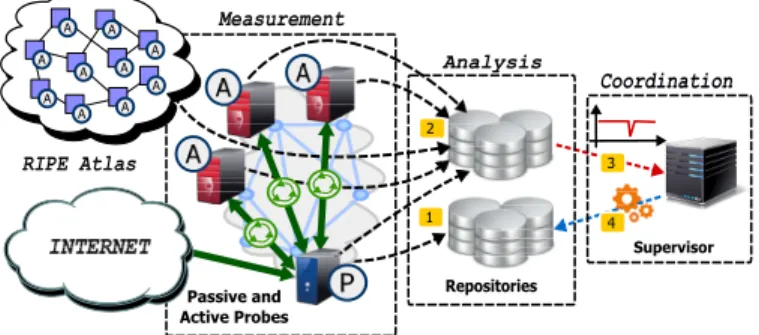
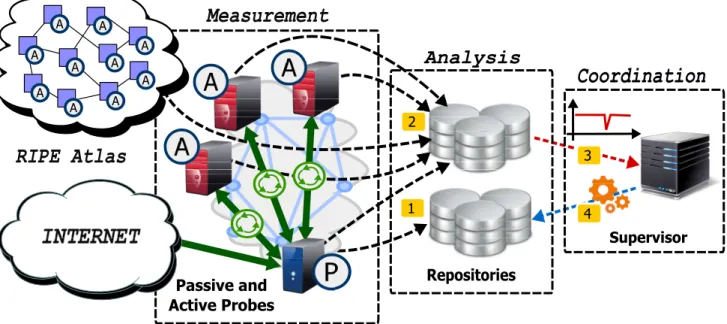
Repositories Supervisor Measurement Passive and Active Probes A A Analysis Coordination 2 1 3 A RIPE Atlas A A A A A A A A A A P
Figure 1. The distributed measurement platform following the mPlane architecture for ISP network troubleshooting, and its workflow. Green arrows correspond to both active and passive measurements. Black arrows correspond to measurement data that are exported from probes to repositories. Red arrows correspond to anomaly notification reports. Blue arrows depict the requests made by the Supervisor to trigger deeper data analysis, using for example external distributed measurement frameworks such as RIPE Atlas.
measurements mPlane probes perform, and the analysis ca-pabilities in terms of anomaly detection. We focus on three different case studies: (i) diagnosis of performance degradation in end-customer Internet access connections using hybrid mea-surements, (ii) detection and diagnosis of service availability issues in cellular networks, and (iii) detection and diagnosis of QoE (Quality of Experience)-relevant issues in YouTube. We additionally present a fourth analysis scenario in which we implement a proximity location service to analyze inter-AS paths between selected servers (e.g., YouTube serves, Face-book severs, etc.), based on distributed active measurements through RIPE Atlas.
After briefly summarizing related platforms in Sec. II, Sec. III gives an overview of the mPlane architecture. Sec. IV provides details on the operational ISPs considered in the case studies and details traffic datasets. The results obtained in the application of the deployed mPlane framework are presented in Sec. V. Finally, Sec. VI concludes the paper.
II. RELATED PLATFORMS
Many measurement platforms have been proposed in the
past, such as iPlane [2], PerfSONAR [3], or RIPE Atlas1.
Each of them targets specific needs, and focuses mostly on the monitoring of the network layer, relying exclusively on
active measurements. For instance, iPlane focuses on network topology discovery via traceroute measurements to build a predictive model of path latency; PerfSONAR and RIPE Atlas offer active measurements from a distributed platform (throughput, ping, traceroute, etc.), to again monitor network paths. They offer limited processing capabilities or algorithm for advanced diagnose, even if it is possible to run (custom) algorithms on the top of collected measurements. For instance, Calyam proposed an anomaly detection system specifically designed to be integrated on the top of PerfSONAR measure-ments [4].
mPlane platform is instead specifically designed to integrate existing and new measurement probes. Indeed, mPlane already integrates RIPE Atlas so that it is possible to instrument RIPE measurements from a mPlane Reasoner. In addition, mPlane offers support for passive and hybrid measurements. For instance, in this paper we leverage passive measure-ments collected by Tstat [5] to compare with active test (see Sec. V-A) and to feed the anomaly detection algorithms with rich information about the status of complex platforms, as the YouTube infrastructure (see Sec. V-B). Note that capturing and processing passive measurements at operational networks such as those analyzed in this paper pose a much more complex problem in terms of volume and analysis techniques than relying on pure active measurements.
Besides coordinating probes, mPlane offers storage capabil-ities, where data can be collected and processed by analytic components, which, for instance, integrate methodologies to identify anomalies. Furthermore, mPlane does not target the monitoring of network layer only. For instance, we show its ability to monitor Content Delivery Networks, and their direct impact on end-user QoE. In summary, mPlane is the first flexible, open and intelligent platform that aims at providing monitoring and analysis capabilities for Internet services at large, and not only of pure network layer problems.
Considering anomaly detection algorithms, many proposals are present in the literature – see for instance the survey of Chandola [7]. Most of them could be easily integrated into mPlane. The most innovative part offered by mPlane is the ability to design complete workflows, where actions can be triggered as a consequence of alarms, and domain knowledge can be easily integrated. This goes in the same directions as the one proposed by Kanuparthy in [8], [9], where the Pythia sys-tem is introduced; still, different from mPlane, Pythia focuses mainly on network path troubleshooting, relying exclusively on active measurements.
III. SYSTEMDESCRIPTION, COMPONENTS AND
APPROACH
The proposed distributed platform is an instance of the more generic mPlane architecture. The mPlane monitoring system is composed of four different entities, namely Probes, Repositories, Supervisor and Reasoners. They inter-operate thanks to a standard protocol, and are logically organized into three layers in Fig. 1:
The Measurement Layer: consists of probes located at vantage points within the monitored networks, which typically
generate large amounts of measurement data. The system supports active measurements, e.g., ping or traceroute, passive measurements, e.g., the analysis of traffic flowing on a link, and hybrid measurements, e.g., the passive observation of active probing traffic. Measurement campaigns may be triggered on demand, with results returned as soon as the mea-surement is completed; Or be run continuously, with results periodically exported into a mPlane repository to limit the storage utilization at the probe. For this specific instantiation of mPlane, the measurement layer includes the RIPE Atlas active platform using the so-called mPlane proxies [1]. The Analysis Layer: consists of repositories which collect and aggregate data generated by the probes. Apart from the storage capacity, the Analysis Layer is provided with a set of analysis modules which process the data imported from the probes. Such processing may involve filtering, grouping, aggregation of the raw data imported from the probes, or more complex analytics such as anomaly detection. The results are a higher level of aggregation and visibility on the monitored network, and can be directly accessed through a standard queryable SQL-like interface.
The Coordination Layer:
consists of the the Supervisor and the Reasoner. The first orchestrates probes and repositories. The latter receives output of analysis modules, and may trigger alarms, or initiate addi-tional operations in a reactive fashion, e.g., perform addiaddi-tional on-demand measurements to investigate the anomaly.
As indicated in Fig. 1, the measurement layer is decomposed in three different measurement approaches: hybrid measure-ments combine active and passive measuremeasure-ments, and are used in the analysis of end-customer Internet access connections; passive measurements are instrumented by deploying sniffers at Points of Presence (PoPs) aggregating a large number of customers; finally, active measurements are performed through both the RIPE Atlas and the IQM platforms.
A. Measurement Components
In more details, the passive probe used in all fixed-line scenarios is Tstat [5]. Tstat is an open source packet analyzer capable of monitoring links up to several Gb/s speed using commodity hardware. It extracts information about both TCP and UDP traffic flows at all the layers of the protocol stack, from simple flow size, or RTT average and standard devia-tion [6], up to layer 7 data (i.e., applicadevia-tion-related). When considering cellular networks, we rely on the METAWIN passive monitoring probe [12], which is capable of handling the complete 3GPP protocol stack.
We use two different active platforms: RIPE Atlas probes
and IQM (Internet QoS Measurement) probes2. Both probes
are capable of RTT and path measurements using ping and traceroute tools; in addition, the IQM offers more complex measurements, e.g., speed-tests and HTTP/HTTPS performance metrics. RIPE Atlas probes are maneuvered
through a custom interface3 which launch measurements and retrieve results automatically.
As repository, we use DBStream [10]. DBStream is a data stream warehouse tailored for large-scale traffic monitoring ap-plications. It continuously analyzes the measurements obtained by the probes. In particular, multiple instances of an Anomaly Detection Analysis Module (ADAM from now on) run in parallel on top of DBStream, flagging anomalous behaviors in different traffic features. We briefly describe ADAM next.
Finally, the mPlane Supervisor is the standard one, provided
by the mPlane RI4 - Reference Implementation. The Reasoner
is a custom set of python code that, interacting with the Supervisor, collects the output of the analysis module, and eventually starts measurement for further investigations.
B. Anomaly Detection and Diagnosis
ADAM [13] is a mPlane analysis module which detects unusual deviations in the probability distribution of a moni-tored feature over time. In short, the ADAM base algorithm detects anomalies based on the degree of similarity between the distribution of a feature as currently observed, and a set of distributions describing the normal behavior of the monitored feature, i.e., a baseline. The latter is build through a progressive refinement heuristic, which takes into account the structural characteristics of traffic such as time of day variations, presence of pseudo-cyclic weekly patterns, and long term variations. The baseline thus evolves in time to adapt to the dynamics of the system. The similarity between distri-butions is computed on the basis of a symmetric extension to the well-known Kullback-Leibler divergence. When the difference is bigger than an (adaptive) confidence threshold, ADAM raises an alarm. More details on ADAM can be found in [13], where we apply the same base algorithms to detect anomalies in Content Delivery Network (CDN) services.
Multiple instances of ADAM run in parallel, each analyz-ing multiple traffic features at the same time. We split the monitored features in two groups referred to as symptomatic and diagnostic features. Symptomatic features are defined such that their abrupt change directly correlates to the presence of abnormal and potentially harmful events. Diagnostic features shall provide contextual details of the anomalies, pointing to their root causes. In a nutshell, by locating those diagnostic signals which show a change at the same time or same temporal scope to the detected anomaly, one gets a more targeted and specific indication of which features might be causing the anomaly.
C. Analysis Workflow
The detection and diagnosis of anomalies runs as a contin-uous process. The Supervisor instructs passive probes to run continuously, measuring and exporting the obtained data to the DBStream repository. When an alarm is triggered, the Rea-soner can instruct active probes to run further measurements. The measurement and analysis workflow depends on the
3https://github.com/pierdom/atlas-toolbox 4https://github.com/fp7mplane/protocol-ri
specific case study, but apart from particular instrumentation details, all the scenarios follow the same base-steps, described in Fig. 1:
Step 1 - passive traffic monitoring: passive probes are deployed at vantage points. In the case of large-scale ser-vice monitoring, probes are deployed at PoPs aggregating a large number of customers and their real traffic is captured,
discarding all privacy-sensitive information. 5 In the case of
end-customer access monitoring, Tstat is installed at the same server which instantiates active measurements (a simple FTP server used for speed-tests), resulting in the aforementioned hybrid measurement approach.
Step 2 - active probing: active probes scattered in the ISP (five per region) continuously perform speed-tests to measure the available bandwidth on the network paths reaching the ISP customers, periodically downloading (uploading) files from (to) the FTP server. Active probes log the achieved application layer throughput, transferring the results to the same DBStream repository.
Step 3 - detection of anomalies: multiple instances of ADAM run on top of DBStream, analyzing a set of features. As soon as an abrupt change is detected in a symptomatic feature, an alarm is raised to the Reasoner.
Step 4 - correlating multi-source measurement data: when alarms suggesting unexpected performance degradation are detected, the Reasoner runs correlation analysis (e.g., Factor Analysis) to investigate which features show a similar abrupt change. Correlated features are then compared against a cata-log of known anomaly patterns or signatures, and if a match is found, the most probable cause(s) are reported to the network operator.
IV. DEPLOYMENT ANDDATASETS
For the sake of end-customer connections monitoring, we deployed active probes in more than 30 locations scattered in the operational country-wide network of the ISP. As reg-ular customers, active probes connects to the network using an ADSL or an FTTH access technology; The FTP server is installed in the ISP datacenter. This ISP offers three configurations for ADSL connections (U-1Mbps/D-16Mbps, U-1Mbps/D-12Mbps and U-0.5Mbps/D-8Mbps) and one for FTTH (U-10Mbps/D-10Mbps). Each probe periodically runs a speed-test by uploading (downloading) files of predefined size, measuring the application layer throughput. Tstat runs on the same server where the FTP is, and logs each TCP flow related by the active tests. We ran the system for more than three months (February the 1st till April the 30th, 2014), observing the time series of application-layer throughput. Speed-tests are scheduled every 4 minutes, resulting in a total dataset of 1.2 million speed-test reports produced by the active probes, and
as many TCP entries in the log generated by Tstat.6
5The deployment and the information collected for this has been approved
by the ISP security and ethic boards.
6Access lines for experiments are devoted to test only, with no actual
customer using those. As such, the testing traffic has minimal interference with customers? traffic that cross the same path to the FTP server. Similarly, no privacy issues are raised.
00:00 20-Feb 2014 06:00 12:00 18:00 06:00 12:00 18:00 Time 0 2 4 6 8 1012 14 Throughput [Mb/s] upload download 06:00 12:00 18:00 Time 06:00 12:00 18:00 0 5 10 15 20 25 30 35 Retransmitted Segments 06:00 12:00 18:00 Time 06:00 12:00 18:00 0.12 0.14 0.16 0.18 0.20 Coefficient of Variation of RTT
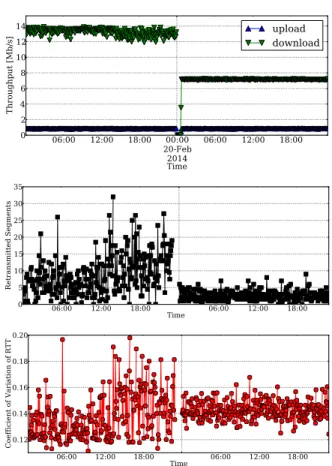
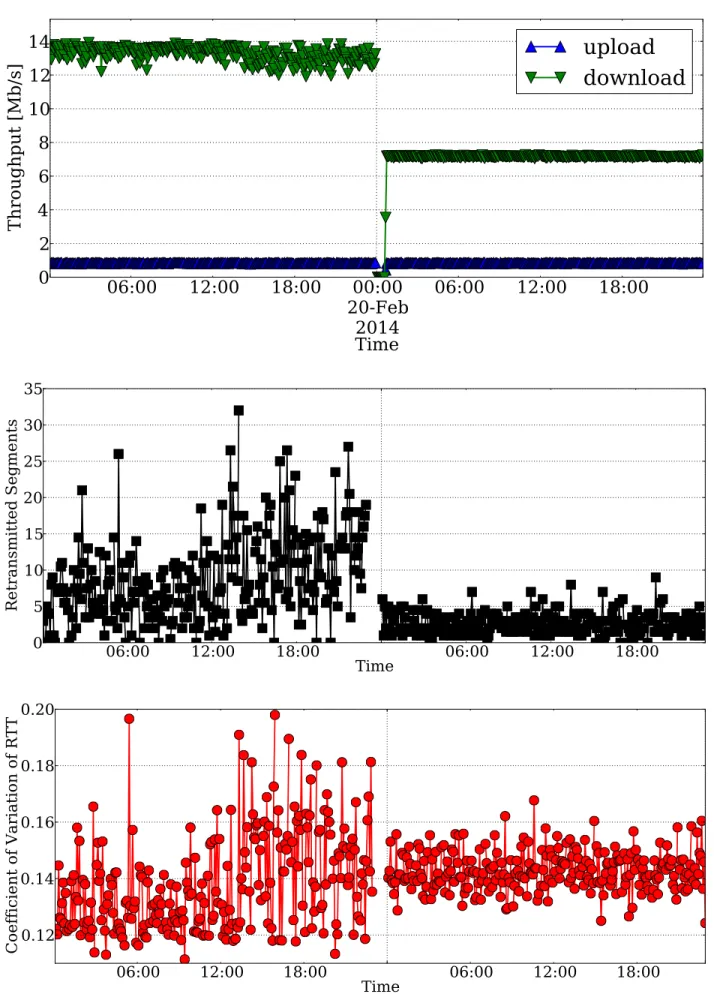
Figure 2. Evolution of time of the throughput measured by one active probe (top), the number retransmitted segments (center), and the coefficient of variation of the RTT (bottom). U-1Mbps/D-16Mbps ADSL probe.
For the analysis of cellular network traffic and service availability, i.e., the possibility for a client to obtain a response from servers of given service, we deployed the METAWIN passive probe at the core of a cellular ISP network in EU. Traffic flows were captured at the well-known Gn interface for two consecutive days by mid 2014. In this case study, we only consider Domain Name System (DNS) traffic. The DNS is the core component of the Internet, providing a flexible decoupling of a service’s domain name and the hosting IP addresses. Anomalies in Internet-scale services are likely to change the normal DNS usage patterns. For example, users accessing a temporary unreachable service would generate a new query at every connection retry. For that reason, we extract features derived from the DNS, e.g., frequency of DNS requests, error codes, etc.
Finally, the QoE-based service performance analysis is performed again using Tstat that passively monitor traffic from a PoP where 30.000 residential customers are. We focus on the analysis of YouTube traffic, that we extract using Tstat classification modules. The complete dataset corresponds to 4 weeks of YouTube video traffic flows, captured during the second quarter of 2013.
V. RESULTS ANDDISCUSSION
In this section we report some of the results obtained with the deployed mPlane framework in the aforementioned case studies. Due to lack of space we do not provide a fully
00:00 20-Feb 2014 06:00 12:00 18:00 06:00 12:00 18:00 Time 0 2 4 6 8 10 12 Throughput [Mb/s] upload download 06:00 12:00 18:00 Time 06:00 12:00 18:00 0 200 400 600 800 1000 1200 1400 Retransmitted Segments 06:00 12:00 18:00 Time 06:00 12:00 18:00 0.00 0.05 0.10 0.15 0.20 0.25 0.30 0.35 Coefficient of Variation of RTT)
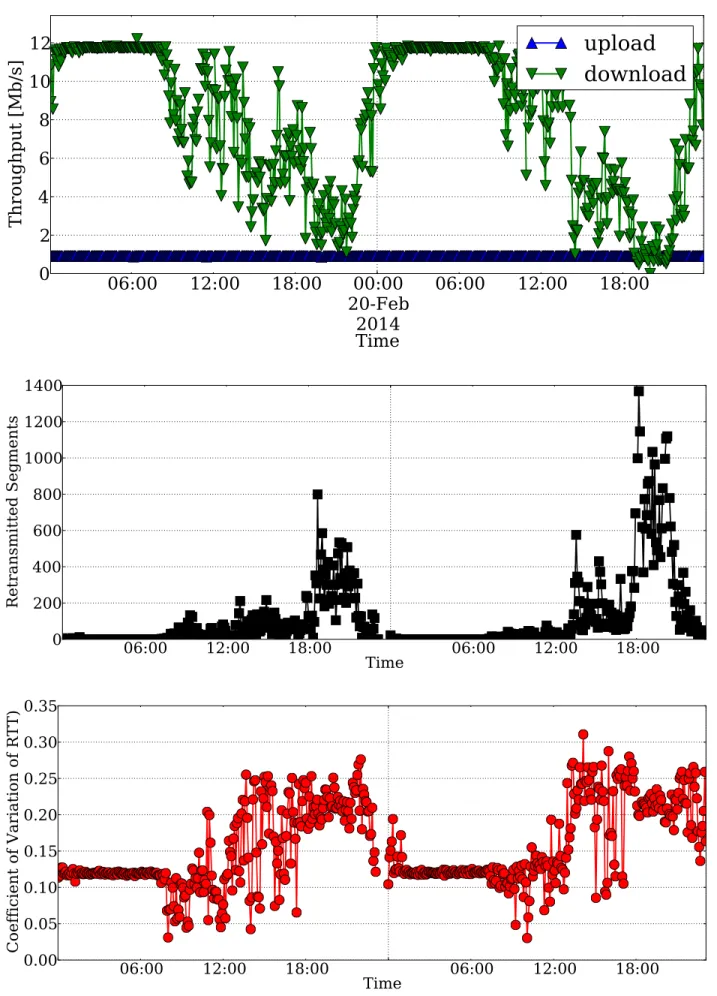
Figure 3. Evolution over time of the throughput measured by one active probe (top), the number of retransmitted segments (center), the coefficient of variation of the RTT (bottom). U-1Mbps/D-12Mbps ADSL probe.
detailed description on the complete diagnosis process for the presented scenarios, but refer the interested reader to https: //www.ict-mplane.eu/public/public-deliverables (reports D4.1-4) for further details.
A. Combining Active and Passive Measurements
For the sake of brevity, we report here two examples of anomalies that could be present in ADSL access links: low SNR in ADSL channels and path congestion.
Low SNR in ADSL lines: Fig. 2 (top) reports the evolution over time of the throughput measured by an active probe accessing the ISP network through a U-1Mbps/D-16Mbps
ADSL interface for two days.7 Observe that the download
throughput curve appears to be noisy during the first day, while after midnight, the ADSL line was re-calibrated to U-1Mbps/D-8Mbps. Since then, speed-test measures are much more stable over time. By correlating such output with the statistics provided by Tstat, we could notice a fairly large fraction of retransmitted segments during the first day (center), and a constant coefficient of variation of the RTT (bottom). The absence of evident day-night patterns let us exclude that this situation might be due to network congestion, since this typically emerges only during peak periods.
7The throughput reported in the plots is below the nominal bandwidth since
The most probable cause for this anomaly is the occurrence of low signal-to-noise ratio (SNR) events at the physical link,
which can lead to large bit error rate (BER).8 Losses due
to noise cause TCP congestion control to (randomly) slow down the download. The confirmation of this hypothesis is given by the second half of the plots in Fig. 2, when the ADSL modem automatically reduces the downlink capacity to improve the SNR, i.e., negotiating 8Mb/s instead of 16Mb/s, thus considerably reducing the packet loss rate, and making RTT measurements more stable.
Congestion in the Network: Fig. 3 (top) reports the evo-lution over time of the throughput measured by second active probe (U-1Mbps/D-12Mbps ADSL). During both days, a clear degradation in throughput is detected, with stable values dur-ing the night, i.e., when the network is typically lightly loaded. Conversely, available capacity highly decreases during peak time. This suggests that congestion may appear in the path toward the FTP server. By inspecting the statistics provided by Tstat at the server side, we could confirm this intuition. Indeed, notice how the RTT coefficient of variation (bottom) and the rate of retransmitted packets (center) considerably increase during the peak utilization period. Verification with the ISP, such probe accesses the Internet through a bottlenecked Virtual Leased Line, whose available bandwidth is out of the control of the operator.
B. Detecting and Diagnosing Availability Issues
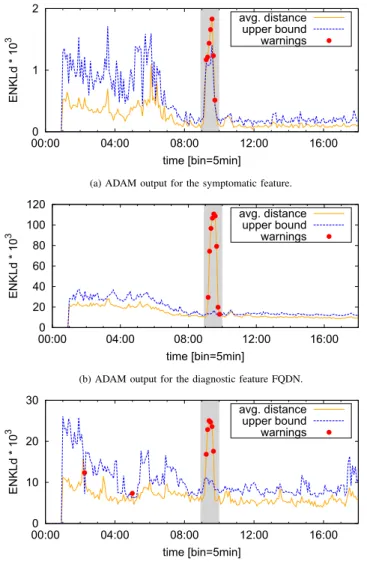
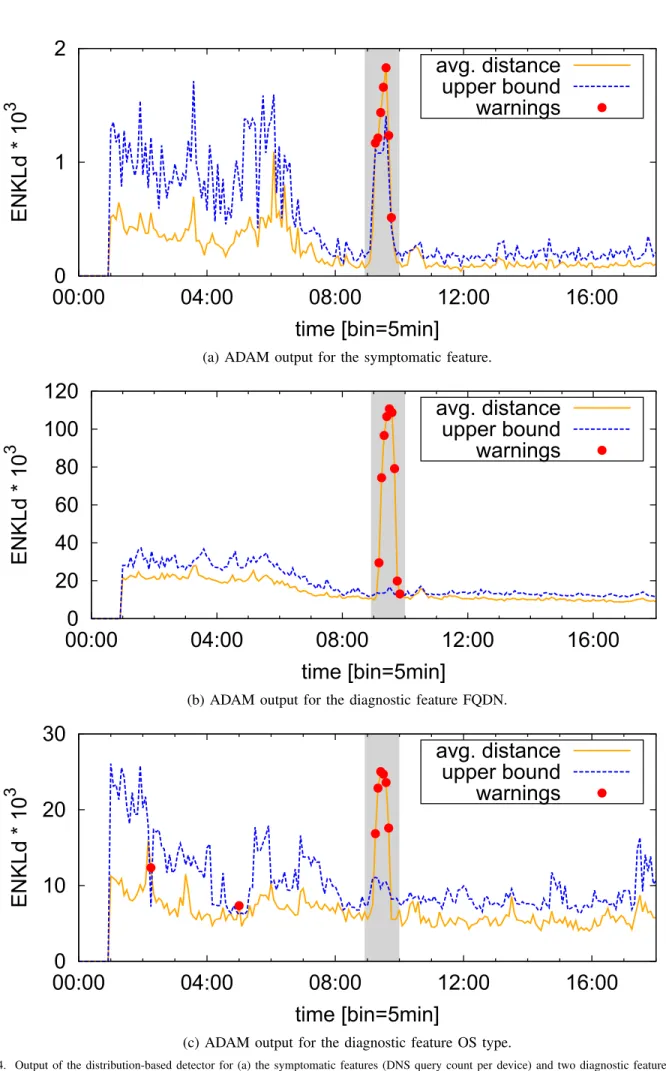
We present now a case study based on the detection and diagnosis of a large scale anomaly occurred in the aforemen-tioned cellular network. A significant and anomalous increase in the number of DNS requests is observed between 9:00 and 10:00 of the second day. Conversations with the Network Operations team revealed that the anomaly caused heavy stress in specific parts of the network. Fig. 4(a) depicts the output of ADAM when applied to the distribution of DNS requests per device, which is defined as the symptomatic feature. ADAM systematically generates anomaly warnings during the one hour duration of the anomaly.
To find out the root causes of the detected anomaly, we define a set of diagnostic features related to the class of problems we target, based on expert know how. In particular, we consider the following set of features: anonymized Mobile Device Identifier (MSID), contacted DNS server IP, Radio Access Technology (RAT), Access Point Name (APN), Type Allocation Code (TAC), DNS requested Full Qualified Domain Name (FQDN), device manufacturer, device Operating System (OS), and error code of the DNS response (DNS rcode). The first step of the diagnosis consists of identifying which of these features present a significant change in their probability distribution, simultaneously to the alarms generated by running ADAM on the symptomatic feature.
Figs. 4(b) and 4(c) provide a closer look into the anomaly, comparing the output of ADAM when applied to two of the diagnostic features: the distribution requested FQDNs, and the distribution of devices OS type. Both ADAM outputs also flag
8SNR and BER can be read from SNMP measurements as defined by RFC
2662. 0 1 2 00:00 04:00 08:00 12:00 16:00 ENKLd * 10 3 time [bin=5min] avg. distance upper bound warnings
(a) ADAM output for the symptomatic feature.
0 20 40 60 80 100 120 00:00 04:00 08:00 12:00 16:00 ENKLd * 10 3 time [bin=5min] avg. distance upper bound warnings
(b) ADAM output for the diagnostic feature FQDN.
0 10 20 30 00:00 04:00 08:00 12:00 16:00 ENKLd * 10 3 time [bin=5min] avg. distance upper bound warnings
(c) ADAM output for the diagnostic feature OS type.
Figure 4. Output of the distribution-based detector for (a) the symptomatic features (DNS query count per device) and two diagnostic features (b – FQDN and c – OS type). All the plotted features exhibit distribution changes during the anomalous event.
anomalies in these two features exactly at the same time of the main anomaly trigger, suggesting that the issue might be due to specific devices (OS) querying for certain services (FQDN). The next step of the diagnosis is to drill down each of the dimensions that are highly correlated with the anomaly. This can be achieved, e.g., by comparing the heavy hitters before and during the anomaly. For the specific case of the FQDN diagnostic feature, we observed that, while some of the top elements present a stable behavior (*.facebook.com and *.google.com), the FQDNs *.apple.com.akadns.net, *.push-apple.com.akadns.net, and xy-courier.push.apple.com show a significant increase, pointing to a problem in the availability of the push notification service deployed by Apple.
C. Detecting and Diagnosing QoE-relevant Anomalies The last case study consists of the detection and diagnosis of a major YouTube anomaly impacting the QoE of a large number of customers during several days at peak-load times. As the issue was caused by an unexpected caches selection
00:000 00:00 00:00 00:00 00:00 00:00 200 400 600 800 1000 time [hh:mm]
Flow Download Throughput (kbps)
Wed Thu Fri Sat Sun
(a) Median of the flow download throughput per hour for all YouTube flows.
00:00 00:00 00:00 00:00 00:00 00:00 1 1.25 1,5 2 2,5 time [hh:mm] β
YouTube QoE Impaired Region
Wed Thu Fri Sat Sun
(b) Median of β KPI per hour for all YouTube flows.
00:00 00:00 00:00 00:00 00:00 10−4 10−2 100 102 time [hh:mm] KL divergence mean confidence−bounds
Wed Thu Fri Sat Sun
(c) Anomalies in traffic volume served by YouTube /24 subnets.
00:00 00:00 00:00 00:00 00:00 0.1 0.2 0.3 0.4 0.5 0.6 time [hh:mm] KL divergence mean confidence−bounds
Wed Thu Fri Sat Sun
(d) Anomalies in the video flows average download throughput across YouTube users.
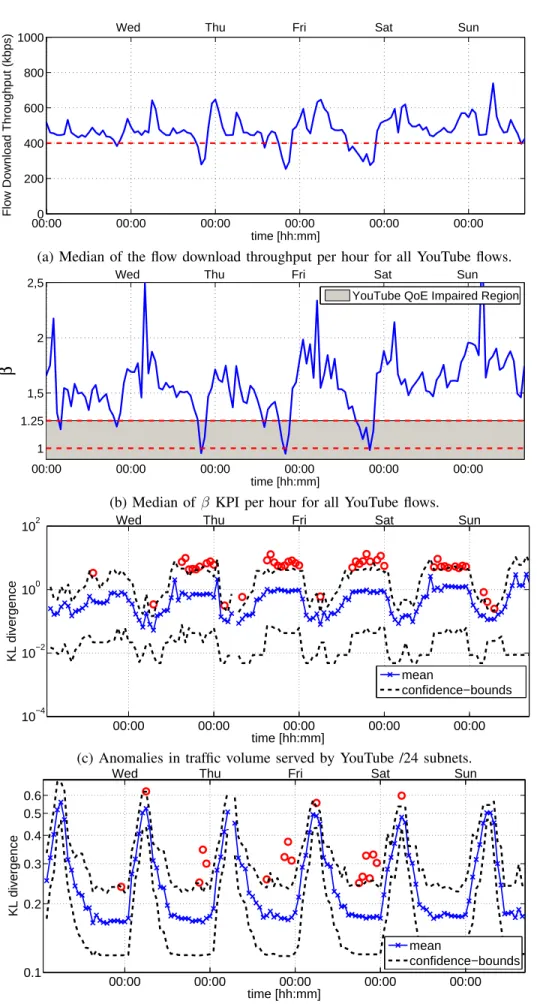
Figure 5. Detecting a QoE-relevant anomaly in a real ISP. There is a clear drop in the download flow throughput from Wednesday till Friday at peak-load hours, between 20hs and 23hs. The additional drop in the QoE-based KPI β reveals a significant QoE degradation. The anomalies are flagged by ADAM in the selected symptomatic and diagnostic features.
done by Google (at least according to our diagnosis analysis), the ISP internal RCA did not identify any problems inside its boundaries. As reported by the ISP operations team, the anomaly occurs on Wednesday the 8th of May, 2013. We therefore focus the analysis on the week spanning the anomaly, from Tuesday the 7th till Sunday the 12th. In the following analysis, we generally use 50% percentile values instead of averages, to filter out outliers.
Figs. 5(a) and 5(b) plot the time series of two different symptomatic features related to the YouTube download perfor-mance and to the end-user QoE. Fig. 5(a) depicts the median across all YouTube flows of the download flow throughput during the complete week. There is a normal reduction of the throughput on Tuesday at peak-load time, between 20hs and 23hs. However, from Wednesday on, this drop is significantly higher, and drops way below a predefined bad QoE threshold
of 400 kbps, as we found in [14].
To better monitor the QoE of YouTube videos from flow-level passive measurements, we introduced in [15] a novel QoE-based KPI defined as the ratio between the average down-load throughput (ADT) and the corresponding video bit rate (VBR), β = ADT/VBR. Intuitively, when β is lower than 1, the player buffer becomes gradually empty, ultimately leading to the stalling of the playback, which is the most relevant impact on QoE [14]. In [15] we found that no stallings are observed for β > 1.25. Based on this observation, Fig. 5(b) actually confirms that the throughput drops are heavily affecting the users experience, as the time series of the KPI β falls well into the video stalling region, i.e., β < 1.25.
To conclude, we report in Figs. 5(c) and 5(d) the output of ADAM for two selected features. Fig. 5(c) considers the per /24 YouTube subnetwork served volume as the monitored feature. From Wednesday the 8th of May onward ADAM rises alarms from 15:00 to 00:00, which correspond to a different selection of YouTube servers done by Google to serve the monitored customers. Fig. 5(d) reports the ADAM output for the average video flows download rate. In this case, ADAM detects the anomalies only between peak hours (21:00-23:00) from the 8th onward, coherently with the observations drawn from Fig. 5(a). Comparing the changes on the served traffic volume distribution against those on the video flows download rate distribution, we observe that the server selection policy used by Google resulted in a QoE degradation only during the peak hours on the high load days. This suggests that either the selected servers were not correctly dimensioned to handle traffic load peaks, or that there is some heavy network congestion at peak time in the paths from the selected Google servers to the customers.
To unveil such kind of Internet-paths performance issues within mPlane, we propose next a technique to perform direct
traceroutemeasurements in the downlink direction, from
the Google servers to the customers, i.e., a reverse tracer-oute. Our techniques avoids relying on IP spoofing (normally blocked by many ISPs), as done in previous work [16].
D. Distributed Active Measurements for Path Analysis To analyze the performance of server-to-costumers Internet paths in the most general scenario using mPlane, we rely on the RIPE Atlas distributed active measurements framework. We developed DisNETPerf, a Distributed Internet Paths Per-formance Analyzer to perform direct traceroute measurements, in the downlink direction. In a nutshell, given a certain source
server IP address IPs, and a destination customer IP address
IPd, DisNETPerf locates the closest RIPE Atlas IPDN P
probe to IPs, and periodically launches traceroutes from
IPDN P to IPd, collecting different path performance statistics
such as RTT per hop, end-to-end RTT, losses, etc.
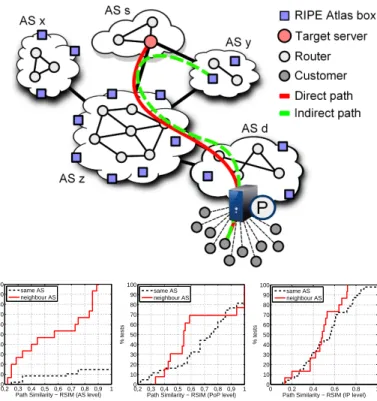
Fig. 6(top) depicts the overall idea behind DisNETPerf. DisNETPerf uses a combined topological and geographical-based distance, as probes are located first by AS, BGP routing proximity, and then by propagation delay. The selection of
IPDN P works as follows: given IPs, we select all the probes
are found) and launch standard ping measurements towards
IPs. We consider the probe with the smallest minimum RTT
as IPDN P.
We say that the probe selected by DisNETPerf is a good
probe w.r.t. IPsand IPd if the network path from IPDN P to
IPd is highly similar to the path from IPsto IPd. Similar to
[11], we define path similarity as the fraction of common links among both paths. Formally, we use the index RSIM (Route Similarity), defined as:
RSIM (IPDN P, IPs, IPd) =
2 × common links(IPDN P, IPs, IPd) total links(IPDN P, IPs, IPd)
(1)
where common links refer to the links shared in common by both paths, and total links to the total number of links for both paths. Note that links can be defined at multiple granularities; in particular, for these evaluations we consider links at the AS level, at the PoP level, and the router-interface (IP) level. IPs to ASes mapping is done through the
IP-to-ASN service provided by Team Cymru9, whereas IPs to PoPs
mapping is achieved through the datasets made available by iPlane [2].
In Fig. 6(bottom) we present evaluation results showing the applicability of DisNETPerf in terms of path similarity. The goal of the evaluation is to investigate whether the probe selection approach used by DistNETPerf obtains probes which present the most similar path to the one we want to actually monitor. We use RIPE Atlas probes as source and destination (i.e., IPs and IPd) so as to compute the real path
(i.e., the ground-truth) between source and destination. In the evaluation, we randomly select 100 RIPE Atlas source probes IPsi, i = 1..100, and consider a single fixed destination probe
IPd. For each of the sources IPsi we run DisNETPerf to
locate the 100 closest probes IPDN Pi, obtain both the ground
truth path going from IPsi to IPd and the DisNETPerf path
going from IPDN Pi to IPd, and compute the RSIM index
RSIM (IPDN Pi, IPsi, IPd), i = 1..100. We compute RSIM
for AS level, PoP level, and IP level, and plot the CDFs for the three cases. Results are reported for two different groups,
the former in which RSIM (IPDN Pi) and IPsi are located
in the same AS (black dotted lines), and the latter in which
RSIM (IPDN Pi) is located in a neighbor AS (red solid lines).
When considering paths at the AS level, there is a significant difference between the groups, and the case of same AS co-location results in near optimal results. Nevertheless, we observe that about 60% of the tests yield a RSIM index > 0.5. Finally, we observed that probes selected by DisNETPerf generally correspond to paths with the highest similarity to the ground-truth ones. Indeed, in more than 84% of the performed
tests, RSIM (IPDN Pi) results in the highest RSIM index
among all the selected candidates.
9http://www.team-cymru.org/IP-ASN-mapping.html 0,2 0,3 0,4 0,5 0,6 0,7 0,8 0,9 1 0 10 20 30 40 50 60 70 80 90 100
Path Similarity − RSIM (AS level)
% tests same AS neighbour AS 0,2 0,3 0,4 0,5 0,6 0,7 0,8 0,9 1 0 10 20 30 40 50 60 70 80 90 100
Path Similarity − RSIM (PoP level)
% tests same AS neighbour AS 0 0.2 0.4 0.6 0.8 1 0 10 20 30 40 50 60 70 80 90 100
Path Similarity − RSIM (IP level)
% tests
same AS neighbour AS
Figure 6. DisNETPerf approach. DisNETPerf achieves almost perfect path similarity at the AS level when IPDN P is located in the same AS of IPs,
and path similarity above 50% for most of the cases, also at the PoP and interface level.
VI. CONCLUDINGREMARKS
Unveiling network and service performance issues in com-plex and highly decentralized systems such as the Internet is a major challenge. mPlane provides a distributed measurement platform which, among other applicators, can be used to shed light in such performance issues. By deploying mPlane in both fixed-line and cellular operational ISP networks, we have shown how to use this powerful and novel framework to au-tomatically detect and diagnose performance issues with very different root causes in different scenarios. Finally, note that all the software tools used in this paper are publicly available at the mPlane project website (https://www.ict-mplane.eu/). We refer the interested reader to https://www.ict-mplane.eu/public/ use-cases for more details on how mPlane is applied to many other relevant use cases.
ACKNOWLEDGMENTS
The research leading to these results has received funding from the European Union under the FP7 Grant Agreement n. 318627 (Integrated Project “mPlane”). Special thanks to Eike Kowallik, Stefano Raffaglio, and Andrea Fregosi from Fast-web, Italy, for their contributions to the analysis of anomalies in ADSL lines.
REFERENCES
[1] B. Trammell, P. Casas, D. Rossi, A. B¨ar, Z. Ben-Houidi, I. Leontiadis, T. Szemethy, and M. Mellia, “mPlane: an Intelligent Measurement Plane for the Internet,” in IEEE Communications Magazine, Special Issue on Monitoring and Troubleshooting Multi-domain Networks using Measurement Federations, vol. 52, no. 5, pp. 148–156, 2014. [2] H. Madhyastha, T. Isdal, M. Piatek, C. Dixon, T. Anderson, A.
Kr-ishnamurthy, and A. Venkataramani, “iPlane: An Information Plane for Distributed Services,” in Proc. of the 7th USENIX Symposium on Operating Systems Design and Implementation, pp. 367–380, 2006. [3] A. Hanemann, J. Boote, E. Boyd, J. Durand, L. Kudarimoti, R. Lapacz,
D. Swany, S. Trocha, and J. Zurawski, “PerfSONAR: A Service Oriented Architecture for Multi-Domain Network Monitoring,” in Proc. of the 3rd International Conference on Service-Oriented Computing, LNCS 3826, pp.241–254, 2005.
[4] P. Calyam, Jialu Pu, W. Mandrawa, A. Krishnamurthy, “OnTimeDetect: Dynamic Network Anomaly Notification in perfSONAR Deployments,” in Modeling, Analysis & Simulation of Computer and Telecommunica-tion Systems (MASCOTS), 2010 IEEE InternaTelecommunica-tional Symposium on, pp. 328–337, 2010.
[5] A. Finamore, M. Mellia, M. Meo, M. Munafo, and D. Rossi, “Experi-ences of Internet Traffic Monitoring with Tstat,” in IEEE Network, vol. 25, no. 3, pp. 8–14, 2011.
[6] M. Mellia, M. Meo, L. Muscariello, D. Rossi, “Passive analysis of TCP anomalies,” in Computer Networks, vol. 52, no.14, pp. 2663-2676, 2008. [7] V. Chandola, A. Banerjee, V. Kumar, V. Anomaly detection: A survey.
ACM computing surveys (CSUR), vol. 41, no. 3, 2009.
[8] P. Kanuparthy, D. Lee, W. Matthews, C. Dovrolis, S. Zarifzadeh, “Pythia:
detection, localization, and diagnosis of performance problems,” in Communications Magazine, IEEE, vol. 51, no. 11, pp. 55-62, 2013. [9] P. Kanuparthy, C. Dovrolis. “Pythia: diagnosing performance problems
in wide area providers,” in USENIX Annual Technical Conference (USENIX ATC’14), Philadelphia, PA, pp. 371-382, 2014.
[10] A. B¨ar, A. Finamore, P. Casas, L. Golab, and M. Mellia, “Large-Scale Network Traffic Monitoring with DBStream, a System for Rolling Big Data Analysis,” in Proc. of the 2nd IEEE International Conference on Big Data, pp. 165–170, 2014.
[11] N. Hu, P. Steenkiste, “Quantifying Internet End-to-End Route Similar-ity,” in Proc. of Passive and Active Measurement Conference, 2006. [12] F. Ricciato, “Traffic Monitoring and Analysis for the Optimization of
a 3G Network,”, in IEEE Wireless Communications, vol. 13, no. 6, pp. 42–49, 2006.
[13] P. Fiadino, A. D’Alconzo, A. B¨ar, A. Finamore, and P. Casas, “On the Detection of Network Traffic Anomalies in Content Delivery Network Services,” in Proc. of the 26th International Teletraffic Congress, pp. 1–9, 2014.
[14] P. Casas, A. Sackl, S. Egger, R. Schatz, “YouTube & Facebook Quality of Experience in Mobile Broadband Networks,” in Proc. of the IEEE Globecom Workshop on Quality of Experience for Multimedia Commu-nications, pp. 1269–1274, 2012.
[15] P. Casas, P. Fiadino, A. Sackl, and A. D’Alconzo, “YouTube in the Move: Understanding the Performance of YouTube in Cellular Net-works,” in Proc. of IFIP Wireless Days, pp. 1–6, 2014.
[16] E. Katz-Bassett, H. Madhyasthay, V. Adhikari, C. Scott, J. Sherry, P. van Wesep, T. Anderson, and A. Krishnamurthy, “Reverse Traceroute,” in Proceedings of the 7th USENIX Conference on Networked Systems Design and Implementation, pp. 15–28, 2010.
VII. BIOGRAPHIES
Pedro Casas is a Senior Researcher at FTW. He got a Ph.D. in computer science from Telecom Bretagne in 2010, and joined CNRS as a research fellow between 2010 and 2011. His research interests span the analysis of network traffic, QoE modeling and assessment, and data mining in networking. He has co-authored more than 80 papers (45 as first author) in major conferences and journals, and received 8 best paper/best workshop awards in the last 7 years. Pierdomenico Fiadino received his BSc and MSc degrees in Computer Engineering from “La Sapienza” University of Rome, and a PhD in Electrical Engineering from the Institute of Telecommunications of TU Wien, in 2008, 2010 and 2015 respectively. Since 2010, he is a Researcher at the Telecommunications Research Center of Vienna (FTW). His research interests cover network traffic monitoring and analysis, anomaly detection and diagnosis, machine learning, and data mining.
Sarah Wassermann is currently a first year MSc student in Computer Science at the Universit´e de Li`ege (ULg) in Belgium, where she also earned her BSc degree in 2015. Her main research interests lie in the field of network measurements.
Stefano Traverso (M’12), Ph.D. His research interests include privacy-preserving systems, network measurements and content delivery networks. During his Ph.D. and Post-doc he has been visiting Telefonica I+D research center (Barcelona, Spain), NEC Laboratories (Heidelberg, Germany) and Alcatel-lucent Bell Labs (Paris, France). He is currently a Post-doc Fellow of the TNG group of Politecnico di Torino. Alessandro D’Alconzo received the MSc Diploma in Electrical Engineering and the Ph.D. degree from Polytechnic
of Bari, Italy, in 2003 and 2007 respectively. Since 2007 he is Senior Researcher at the Telecommunications Research Center Vienna (FTW), Austria. His research interests cover various topics in the field of Telecommunication Networks, including traffic monitoring and analysis, network measurements, security and privacy, and detection and diagnosis of network traffic anomalies in Content Delivery Networks.
Edion Tego received his bachelor degree from Polytechnic University of Tirana in 2008 and his master degree from “La Sapienza” University of Rome in 2008, where he is also a Ph.D. Candidate. His research interest are in SLA verification, traffic monitoring for anomaly detection and intrusion preventions and Software Defined Networking.
Francesco Matera received the Laurea degree in
Electronics Engineering from the University “La Sapienza” in Rome, Italy, in 1985. Since 1986, he has been Researcher at Fondazione Ugo Bordoni where he currently works on networks and optical fiber systems. He was the scientific coordinator of European IST ATLAS “All optical Terabit per second Lambda Shifted transmission” project and took part in several other European projects.
Marco Mellia (S’08), Ph.D., research interests are in the in the area of traffic monitoring and analysis, in cyber monitoring in general, and Big Data analytics. He has co-authored over 250 papers published in international journals and presented in leading international conferences. He won the IRTF ANR Prize at IETF-88, and best paper award at IEEE P2P’12, ACM CoNEXT’13, IEEE ICDCS’15. He is part of the edi-torial board of ACM/IEEE Transactions on Networking, IEEE Transactions on Network and Service Management, and ACM Computer Communication Review. He holds a position as Associate Professor at Politecnico di Torino, Italy.
Repositories
SupervisorMeasurement
Passive and Active ProbesA
A
Analysis
Coordination
2 1 3A
RIPE Atlas
A A A A A A A A A AP
Figure 1. The distributed measurement platform following the mPlane architecture for ISP network troubleshooting, and its workflow. Green arrows correspond to both active and passive measurements. Black arrows correspond to measurement data that are exported from probes to repositories. Red arrows correspond to anomaly notification reports. Blue arrows depict the requests made by the Supervisor to trigger deeper data analysis, using for example external distributed measurement frameworks such as RIPE Atlas.
00:00
20-Feb
2014
06:00
12:00 18:00
06:00
12:00 18:00
Time
0
2
4
6
8
10
12
14
Throughput [Mb/s]
upload
download
06:00
12:00
18:00
Time
06:00
12:00
18:00
0
5
10
15
20
25
30
35
Retransmitted Segments
06:00
12:00
18:00
06:00
12:00
18:00
Time
0.12
0.14
0.16
0.18
0.20
Coefficient of Variation of RTT
Figure 2. Evolution of time of the throughput measured by one active probe (top), the number retransmitted segments (center), and the coefficient of variation of the RTT (bottom). U-1Mbps/D-16Mbps ADSL probe.
00:00
20-Feb
2014
06:00
12:00 18:00
06:00
12:00 18:00
Time
0
2
4
6
8
10
12
Throughput [Mb/s]
upload
download
06:00
12:00
18:00
Time
06:00
12:00
18:00
0
200
400
600
800
1000
1200
1400
Retransmitted Segments
06:00
12:00
18:00
06:00
12:00
18:00
Time
0.00
0.05
0.10
0.15
0.20
0.25
0.30
0.35
Coefficient of Variation of RTT)
Figure 3. Evolution over time of the throughput measured by one active probe (top), the number of retransmitted segments (center), the coefficient of variation of the RTT (bottom). U-1Mbps/D-12Mbps ADSL probe.
0
1
2
00:00
04:00
08:00
12:00
16:00
ENKLd * 10
3
time [bin=5min]
avg. distance
upper bound
warnings
(a) ADAM output for the symptomatic feature.
0
20
40
60
80
100
120
00:00
04:00
08:00
12:00
16:00
ENKLd * 10
3
time [bin=5min]
avg. distance
upper bound
warnings
(b) ADAM output for the diagnostic feature FQDN.
0
10
20
30
00:00
04:00
08:00
12:00
16:00
ENKLd * 10
3
time [bin=5min]
avg. distance
upper bound
warnings
(c) ADAM output for the diagnostic feature OS type.
Figure 4. Output of the distribution-based detector for (a) the symptomatic features (DNS query count per device) and two diagnostic features (b – FQDN and c – OS type). All the plotted features exhibit distribution changes during the anomalous event.
00:000 00:00 00:00 00:00 00:00 00:00 200 400 600 800 1000 time [hh:mm]
Flow Download Throughput (kbps)
Wed Thu Fri Sat Sun
(a) Median of the flow download throughput per hour for all YouTube flows.
00:00 00:00 00:00 00:00 00:00 00:00 1 1.25 1,5 2 2,5 time [hh:mm]
β
YouTube QoE Impaired Region
Wed Thu Fri Sat Sun
(b) Median of β KPI per hour for all YouTube flows.
00:00 00:00 00:00 00:00 00:00 10−4 10−2 100 102 time [hh:mm] KL divergence mean confidence−bounds Wed Thu Fri Sat Sun
(c) Anomalies in traffic volume served by YouTube /24 subnets.
00:00 00:00 00:00 00:00 00:00 0.1 0.2 0.3 0.4 0.5 0.6 time [hh:mm] KL divergence mean confidence−bounds Wed Thu Fri Sat Sun
(d) Anomalies in the video flows average download throughput across YouTube users.
Figure 5. Detecting a QoE-relevant anomaly in a real ISP. There is a clear drop in the download flow throughput from Wednesday till Friday at peak-load hours, between 20hs and 23hs. The additional drop in the QoE-based KPI β reveals a significant QoE degradation. The anomalies are flagged by ADAM in the selected symptomatic and diagnostic features.
0,2 0,3 0,4 0,5 0,6 0,7 0,8 0,9 1 0 10 20 30 40 50 60 70 80 90 100
Path Similarity − RSIM (AS level)
% tests same AS neighbour AS 0,2 0,3 0,4 0,5 0,6 0,7 0,8 0,9 1 0 10 20 30 40 50 60 70 80 90 100
Path Similarity − RSIM (PoP level)
% tests same AS neighbour AS 0 0.2 0.4 0.6 0.8 1 0 10 20 30 40 50 60 70 80 90 100
Path Similarity − RSIM (IP level)
% tests
same AS neighbour AS
Figure 6. DisNETPerf approach. DisNETPerf achieves almost perfect path similarity at the AS level when IPDN P is located in the same AS of IPs, and