HAL Id: insu-02343644
https://hal-insu.archives-ouvertes.fr/insu-02343644
Submitted on 3 Nov 2019
HAL is a multi-disciplinary open access
archive for the deposit and dissemination of
sci-entific research documents, whether they are
pub-lished or not. The documents may come from
teaching and research institutions in France or
abroad, or from public or private research centers.
L’archive ouverte pluridisciplinaire HAL, est
destinée au dépôt et à la diffusion de documents
scientifiques de niveau recherche, publiés ou non,
émanant des établissements d’enseignement et de
recherche français ou étrangers, des laboratoires
publics ou privés.
Exoplanet mass distribution considering selection factors
for transit technique
Vladislava Ananyeva, Alexander Tavrov, Inna Shashkova, Andrey Yudaev,
Anastasia Ivanova, Oleg Korablev, Jean-Loup Bertaux
To cite this version:
Vladislava Ananyeva, Alexander Tavrov, Inna Shashkova, Andrey Yudaev, Anastasia Ivanova, et al..
Exoplanet mass distribution considering selection factors for transit technique. EPSC-DPS Joint
Meeting 2019, Sep 2019, Geneva, Switzerland. �insu-02343644�
Exoplanet mass distribution considering selection factors
for transit technique
Vladislava Ananyeva (1), Alexander Tavrov (1, 2), Inna Shashkova (1), Andrey Yudaev (2), Anastasia Ivanova (1),
Oleg Korablev (1), and Jean-Loup Bertaux (1, 3)
(1) IKI/RAS, Moscow, Russia (2) MIPT, Dolgoprudny, Moscow Region, Russia (3) LATMOS-IPSL, Guyancourt, France ([email protected])
Abstract
Retrieving the mass distribution of exoplanets was performed for photometric observed planets from space- and ground-based surveys. True statistical distribution requires debiasing (correction) of observation selection. Retrieved distribution of transit exoplanets by mass accounts the probability of mass determination and the probability of transit configuration. As a not normalized probability density function (PDF), the corrected (debiased) exoplanet mass distribution can be approximated by the power law: dN/dm ∝ m-2. Minima significances
in the retrieved mass distribution have been verified by Kolmogorov-Smirnov test.
1. Introduction
Retrieving the mass distribution of exoplanets determines the abundance of planets of various types in the Galaxy. It will verify the planet formation mechanisms. Moreover, the planet mass statistics is not traceable in Solar system, because the number of Solar planets and their diversity are both incomplete. We followed to the catalogue [1] mass distribution of transiting exoplanets. The transiting planets which masses were determined by the radial velocity (RV) surveys are considered. The mass m is robustly determined if an exoplanet has transit. Statistical mass distribution of transiting planets was taken from the exoplanet catalogue sharply differs from the true, actual distribution, because of the presence and biasing of several factors of observation selection, which we discuss here and do account for them. As the result, the communication shows the refined mass distribution which is close to several distributions, known e. g. from [2, 3]. Directly obtained from [1], two raw catalog mass distributions of transit exoplanets known today, are presented in Figure 1. Exoplanet mass distributions are shown, with those, discovered by Kepler ST (space telescope) represented by the green (dot) line and those by
ground-based transit surveys and CoRoT – represented by the blue (dashed) line. Taking into account the errors in the measurement of mass, the standard KDE with symmetric Gaussian profile - or asymmetric skew normal profile was used to smooth these distributions, shown by red (solid) line and black (solid) line respectively. Evidently, both distributions should have a similar shape; however, this is clearly not observed by the catalogue obtained dependencies. Evident reason for this discrepancy is the observation selection. We intent to show that both mass distributions well converge when these factors are taken into account.
Fig. 1. From catalog [1], the raw mass distribution of transit planets. Gray (dot) line shows distribution of Kepler planets with the measured mass, KDE filtered red (solid) line. Gray (dashed) line shows the distribution of transit planets discovered by ground-based surveys and the CoRoT mission. Blue (solid) line accounts for the mass measurements errors.
2. The selection factor of mass
determination
for
exoplanets
detected by Kepler ST
For giant planets, the mass is more easily measured than for small planets (e.g. neptunes and super-earths). The proportion of Kepler's planets with a measured mass relative to the total number of Kepler planets is close to one in the region of giant planets. EPSC Abstracts
Vol. 13, EPSC-DPS2019-1818-3, 2019 EPSC-DPS Joint Meeting 2019
c
However, this proportion drastically falls down to 2-3% in the region of 0.1-0.3 of the radius of Jupiter (rJ). A "mass determination coefficient" denoted by k
was introduced, used to describe the ratio of the number of Kepler ST planets with the measured mass to the total number of Kepler ST planets in a radii domain. The graph of k versus the radius in rJ is
shown in Figure 2.
Fig. 2. The "mass determination coefficient" k versus the radius of Kepler ST planet.
3. Exoplanets
mass
distribution
corrected for the mass
deter-mination and for the probability of
transit configuration
To account for the mass determination observation selection factor, we have considered each Kepler ST planet with the measured mass as having a statistical weight inversely proportional to k. The raw (catalogue) mass distribution of Kepler ST exoplanets, shown by the red (solid) line in Figure 1, is changed significantly, as shown in Figure 3 (by the red (solid) line). As the first order approximation, the corrected distribution follows a straight line in log-log scale. Therefore, this dependence can be approximated by a power law dN/dm ∝ m-2 by the least squares method.
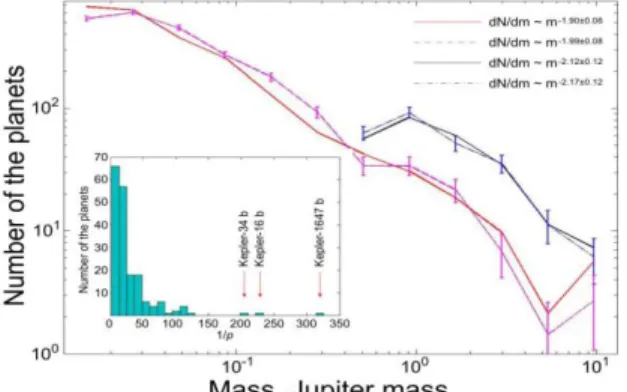
Considering the factor of mass determination “k”, the corrected mass distribution of Kepler ST planets is shown by the red (solid) line, and that for transit planets discovered by ground-based surveys and CoRoT mission shown by the black (solid) line. Additionally, taking into account the factor of transit configurations
probability, the corrected mass distribution of Kepler ST
planets is represented by the magenta (dashed) line and transit planets discovered by ground-based surveys and CoRoT mission shown by the blue (dashed-dot) line. These lines are shown by errorbars considering Poisson criterion N . Furthermore, shown is a histogram of
Kepler ST planets (reciprocal probability 1/p)
demonstrating three Kepler ST planets with statistical oscillations. The legend in right-top corner shows the corresponding exponent, if approximated by the power law. For correct statistics of the mass distribution of planets, and also following [4], we added another factor of observational selection, namely, the probability of transit configuration. For ground-based surveys, the observed distribution of transit planets for true masses dN/dm remains less distorted by observational selection only for planets of the size class of r > 0.7 rJ. Planets
with masses m> 0.4 mJ have r > 0.7 rJ. For these planets,
the mass determination factor is close to one: k = 1-0.02,
to which we accounted for.
Fig. 3. Mass distribution of transit planets with accounted for observation selection. Details in text.
Acknowledgements
We acknowledge the support from the Government of Russian Federation and Ministry of Education and Science of Russian Federation (grant N14.W03.31.0017) and the Russian Science Foundation (grant 18-19-00452).
References
[1] NASA Exoplanet Archive. 2019. https://exoplanetarchive.ipac.caltech.edu/.
[2] Butler, R.P., Wright, J.T., Marcy, G.W., Fischer, D.A., Vogt, S.S., Tinney, C.G., Jones, H. R. A., Carter, B.D., Johnson, J.A., McCarthy, C., Penny, A.J., 2006. Catalog of Nearby Exoplanets.
[3] Marcy, G., Butler, R.P., Fischer, D., Vogt, S., Wright, J.T., Tinney, C.G., Jones, H. R. A., 2005. Observed properties of exoplanets: Masses, orbits, and metallicities. Progress of Theoretical Physics Supplement. 158, 24–42. [4] Petigura, E.A., Howard, A.W., Marcy, G.W., 2013. Prevalence of Earth-size planets orbiting Sun-like stars. Proc Natl Acad Sci U S A., 110(48), 19273-19278.
![Fig. 1. From catalog [1], the raw mass distribution of transit planets. Gray (dot) line shows distribution of Kepler planets with the measured mass, KDE filtered red (solid) line](https://thumb-eu.123doks.com/thumbv2/123doknet/14721542.570445/2.918.479.793.592.771/catalog-distribution-transit-planets-distribution-kepler-measured-filtered.webp)