Development of Cell-laden Hydrogels with High Mechanical Strength for
Tissue Engineering Applications
by
Hyeongho Shin B.S. Chemical Engineering Seoul National University, 2004
Submitted to the Department of Materials Science and Engineering in partial requirements for the degree of
Doctor of Philosophy at the
Massachusetts Institute of Technology February 2014 fulfillment of the MATSAMCHUSES IN61MftE OF TECHNOLOGY
MAY
1
4
2014
LIBRARIES
Q 2013 Massachusetts Institute of Technology. All rights reserved.
Signature of Author ...
Department of Materials Science and Engineering October 7, 2013
C e rt ifie d b y ... ... . . .... V
.
...--
-. . . . .A
A--- i -Kh ad e ---- -mh os s e in iAssociate Professor of Medicine and Health Sciences ap4lTechnolgy, Harvard Medical School
AT Thesis Supervisors r
Certified by
...--Accepted by ...
Christine Ortiz Professor of Materials Science and Technology Thesis Reader
Gerbrand Ceder Professor of Materials Science and Engineering Chair of the Departmental Committee on Graduate Students
Development of Cell-laden Hydrogels with High Mechanical Strength for
Tissue Engineering Applications
by Hyeongho Shin
Submitted to the Department of Materials Science and Engineering on October 7, 2013 in partial fulfillment of the requirements
for the degree of Doctor of Philosophy in Materials Science and Engineering
Abstract
The development of materials with biomimetic mechanical and biological properties is of great interest for regenerative medicine applications. Hydrogels are a promising class of biomaterials due to several advantages, however, the mechanical weakness remains a critical challenge for applications as tissue scaffolds. Particularly, scaffolds for load-bearing tissues such as cartilage and bone need to have great strength to keep their integrity after implantation. This thesis focused on the development of cell-laden hydrogels that have high mechanical strength and good biological properties. The first work of the thesis was to synthesize a biodegradable hydrogel, poly(glucose malate)methacrylate (PGMma), from two natural monomers glucose and malic acid. The PGMma hydrogels were cell-adhesive, and mechanically tunable by altering the formulation. In the second work, double-network (DN) hydrogels were prepared from two biomacromolecules, gellan gum and gelatin. The DN hydrogels prepared exhibited much higher strength than traditional hydrogels, the maximal strength being 6.9MPa. By using a cell-compatible two-step photocrosslinking process, it was also possible to encapsulate cells with high viability. Further research into the materials as tissue scaffolds showed that the DN hydrogels weakened when they were prepared at cell-compatible conditions, and stronger cell-hydrogel interaction is needed to improve the function of the encapsulated cells. Therefore in the last work, microgel-reinforced (MR) hydrogels that have better mechanical strength and biological properties in comparison to DN hydrogels were prepared by embedding stiff GG microgels into soft and ductile gelatin hydrogels. The MR hydrogels exhibited higher strength than the DN hydrogels and the gelatin hydrogels. The cells encapsulated in MR hydrogels showed high metabolic activity and high level of osteogenic behaviors similar to the cells encapsulated in gelatin hydrogels, which was not the case for DN hydrogels. The MR hydrogels, the final product of all these works could be potentially useful for load-bearing tissue scaffolds.
Thesis Supervisor: Ali Khademhosseini
Title: Associate professor of Medicine and Health Sciences and Technology, Harvard Medical School
Acknowledgements
I would like to thank my advisor Dr. Ali Khademhosseini for his guidance and support throughout my graduate experience at MIT. He provided me with opportunities to learn from many people with various expertises and trained me to be a self-driven and independent scientist that can survive the fast-growing research field.
I thank Dr. Bradley D. Olsen for his guidance and scientific advice on my projects. He understood and encouraged me when I was depressed by the research data. I also thank Dr. Christine Ortiz and Dr. Michael Cima for serving on my thesis committee and for their helpful advices and suggestions.
Dr. Halil Tekin, who had been in the lab for five years with me before he graduated, helped me a lot and was the good friend that I can talk with about the graduate life. Mark Brigham introduced the lab and taught the basics of experiments to me when I joined the lab. Dr. Jason W. Nichol guided my first project and answered my basic questions, which helped me to start my own project.
So many people passed by the lab. Some of them helped me a lot with experiments and gave me good advice on science and the graduate life. Some of them were very nice to encourage me and wish my successful graduation. I thank Dr. Shilpa Sant, Dr. Akhilesh Gaharwar, Dr. Alpesh Petal, Dr. Jesper Hjortnaes, Dr. Neslihan Alemdar, Silvia Mihaila, and many other people. I am sorry to many people that passed by the lab that I could not care, help, and be kind to more because I was too busy and stressed especially for the last two years of my graduate life.
I would like to thank many Korean post-docs who passed by the lab for their kind encouragement and consolation. I have lots of good memories of having good times with them.
PPST friends of my year, Dr. Jane Wang, Yin Fan, Adam Zeiger, and Alex W. Scott have been my good friends. They kept me from feeling lonely and helped me to adjust to the foreign academic life. I hope all of them can continue their successful career somewhere in the world.
Korean PPST friends, Dr. Seungwoo Lee and Hyewon Kim helped me a lot in preparing the qualifying exam, and encouraged me throughout the graduate experience. KGMSE friends of my year, Hyunjeong Lee, Jaechul Kim, Heechul Park, and Shinyoung Kang, have been my closest friends. Thanks to them, I have lots of good memories of my MIT life.
People from my church, FKCC, prayed for me and encouraged me. Dr. Soochan Bae, Dr. Jonghwan Kim, Dr. Changhyun Sung were my great mentors. Thanks to many friends from the church, my life in the USA has been more pleasant.
I could not be here without the support, prayer, and love of my mom and dad. I love you. And my sister, she is always supporting me in her heart.
To my wife, Eunkyoung Lee, who has been my greatest support and I will share all my happy life with, thank you, and I love you.
Table of contents
Abstract ... 2
Acknow ledgem ents ... 4
Table of contents ... 5
List of figures ... 7
List of tables ... 10
Chapter 1: Introduction and background ... 11
1.1. Scaffolds for tissue engineering ... 11
1.2. Hydrogels as tissue scaffolds ... 12
1.2.1. Photocrosslinked hydrogels ... 12
1.3. Hydrogels w ith high m echanical strength ... 13
1.3.1. Double-network (DN) and microgel-reinforced (MR) hydrogels ... 14
1.4. Bone tissue engineering ... 16
1.5. Specific aim s of thesis ... 18
Chapter 2: Cell-adhesive and mechanically tunable glucose-based biodegradable hydrogels 20 2.1. Introduction ... 20
2.2. M aterials and m ethods ... 22
2.2.1. Synthesis of PGM m a polym ers ... 22
2.2.2. Characterization of PGM m a polym ers ... 23
2.2.3. Photopolym erization ... 23
2.2.4. Hydrogel characterization ... 24
2.2.5. Cell culture ... 25
2.2.6. Cell adhesion and proliferation on PGM m a hydrogels ... 25
2.2.7. Statistical analysis ... 26
2.3. Results ... 26
2.3.1. PGM m a polym er synthesis and characterization ... 26
2.3.2. Characterization of PGM m a hydrogels ... 29
2.3.3. In vitro degradation of PGM m a hydrogels ... 32
2.3.4. Cell adhesion and proliferation on PGM m a hydrogels ... 33
2.4. Discussion ... 34
2.5. Conclusions ... 39
Chapter 3: The mechanical properties and cytotoxicity of cell-laden double-network hydrogels based on photocrosslinkable gelatin and gellan gum biomacromolecules
3.1. Introduction ... 40
3.2. M aterials and m ethods ... 42
3.2.1. Synthesis of GGIM A and Ge IM A polym ers ... 42
3.2.2. 1 H NM ... .R 43 3.2.3. Fabrication of SN and DN hydrogels ... 43
3.2.4. Diffusion test ... ... 44
3.2.5. M echanical test ... 45
3.2.6. Hydrogel characterization ... 45
3.2.7. Cell culture and encapsulation ... 46
3.2.8. Statistics ... ... ...---- 47
3.3. Results and discussion ... 47
3.3.1. GGM A and GeIM A synthesis ... 47
3.3.2. Fabrication of DN hydrogels ... 48
3.3.3. M echanical properties of DN hydrogels ... 52
3.3.4. Encapsulation of cells in DN hydrogels ... 57
3.4. Conclusions ...-- 58
Chapter 4: Gellan gum microgel-reinforced cell-laden gelatin hydrogels ... 59
4.1. Introduction ... 59
4.2. M aterials and m ethods ... 60
4.2.1. M odification of GG and gelatin ... 60
4.2.2. Preparation and characterization of m icrogels ... 61
4.2.3. Preparation and characterization of MR and DN hydrogels ... 62
4.2.4. Cell culture and encapsulation ... 63
4.2.5. Cell behavior analysis ... 64
4.2.6. Statistics ... --...---. 65
4.3. Results and discussion ... 65
4.3.1. Preparation and characterization of m icrogels ... 65
4.3.2. Preparation and characterization of M R hydrogels ... 67
4.3.3. Cell behavior in M R hydrogels ... 70
4.4. Conclusions ... . ... 74
Chapter 5: Sum m ary and future w ork ... 75
5.1. Sum m ary ...----... 75
5.2.1. Enhancem ent of hydrogel strength ... 76
5.2.2. Further research needed for tissue form ation ... 77
List of figures
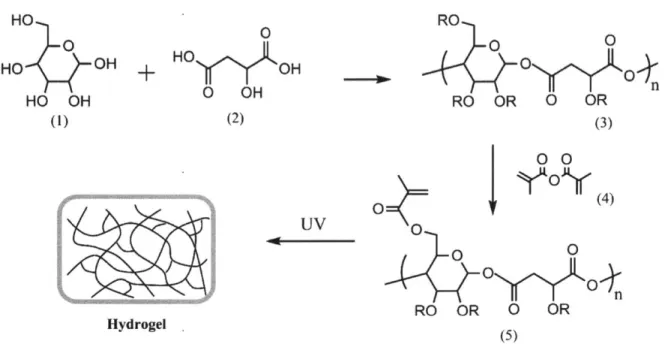
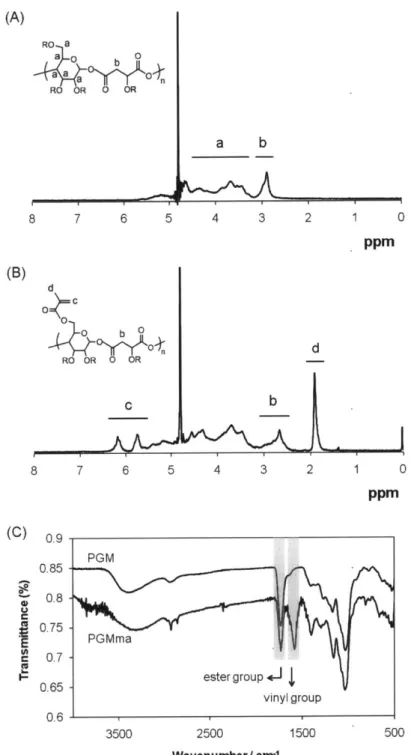
Figure 2.1. General synthetic scheme of PGMma hydrogel. (1) glucose, (2) malic acid, (3) PGM, (4) methacrylic anhydride, (5) PGMma. PGM and PGMma is randomly branched polymer because R can be H, glucose, m alic acid, or polym er chain. ... 22 Figure 2.2. (A) A representative 1H NMR spectrum of PGM. (B) A representative 'H NMR spectrum of PGMma. (C) Representative FT-IR spectra of PGIM and PGMma. ... 27
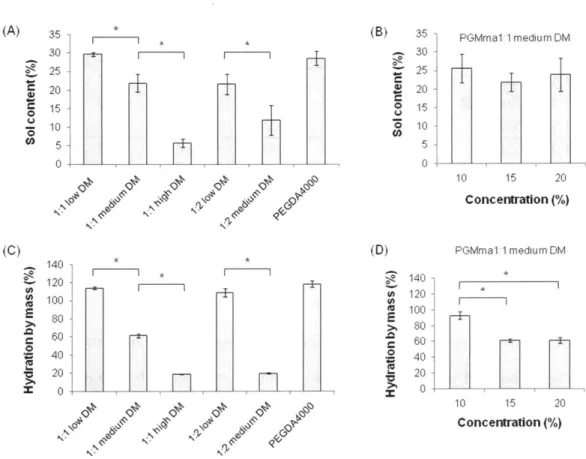
Figure 2.3. Sol content of (A) 15% (w/v) hydrogels of each PGMma formulation compared with PEGDA4000, and (B) PGMma1:1 medium DM hydrogels with different concentrations. Hydration by mass of (C) 15% (w/v) hydrogels of each PGMma formulation compared with PEGDA4000, and (D) PGMma1:1 medium DM hydrogels with different concentrations. (*) indicates significant difference
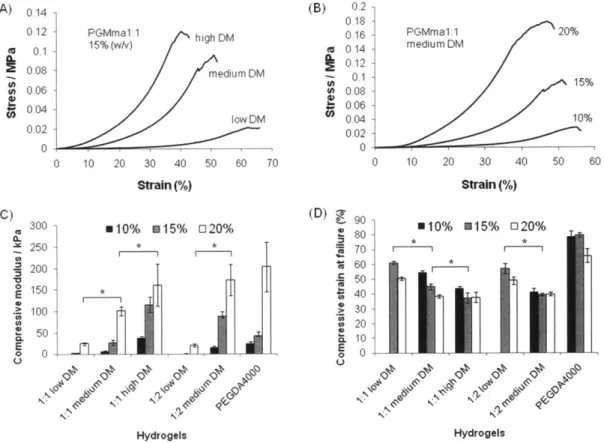
(p < 0 .0 5 ). ... .... . -...---... 3 0 Figure 2.4. Stress-strain curve of PGMma1:1 hydrogels (A) 15%(w/v) of each DM, (B) different polymer concentrations (10%, 15%, 20% (w/v)) of medium DM. (C) Compressive modulus of PGMma1:1 and PGMma1:2 hydrogels compared with that of PEGDA4000 hydrogel. (D) Compressive strain at failure of PGMma1:1 and PGMma1:2 hydrogels compared with that of PEGDA4000 hydrogel. (*) indicates significant d ifference (p<0 .05). ... 31
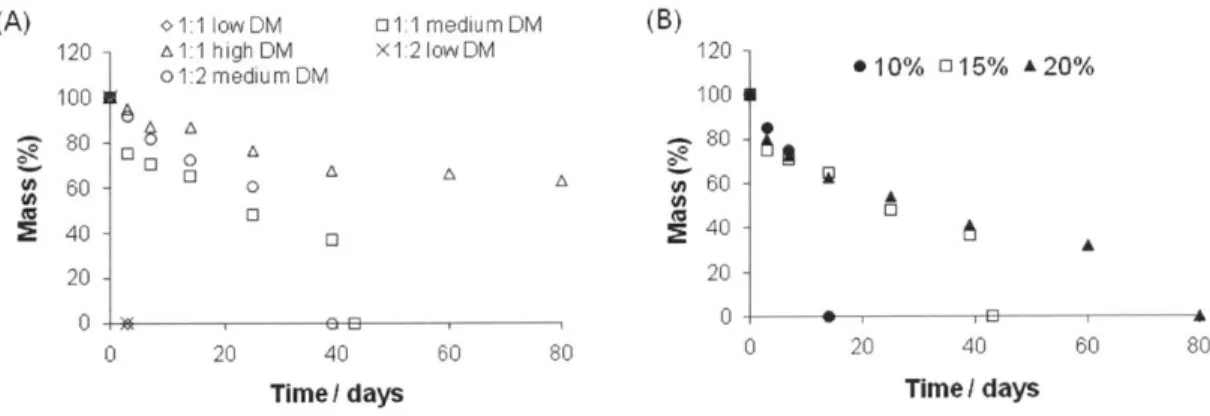
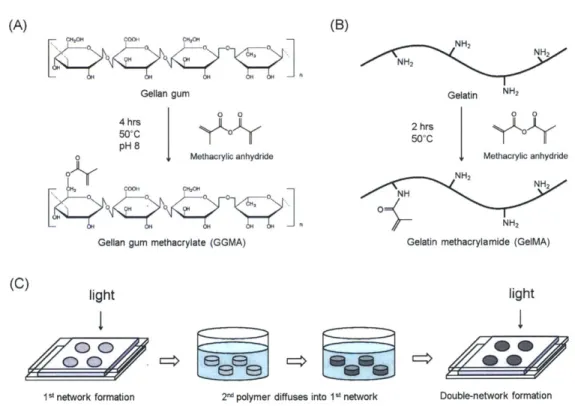
Figure 2.5. Mass-loss over time of PGMma hydrogels in PBS at 37*C (A) 15% (w/v) of each formulation, (B) PG M m a1:1 m ed ium D M . ... 32 Figure 2.6. Fluorescence images (10x) of live/dead stained 3T3 fibroblasts after 3 days of culture on PEGDA4000 (inset in (A)), (A) PGMma1:1 medium DM, (B) PGMma1:1 high DM, (C) PGMma1:2 medium DM, and (D) PGMma1:2 medium DM + GeIMA. The polymer concentration of hydrogels is 15% (w/v). Bars represent 200pm. (E) Attachment and proliferation of 3T3 fibroblasts on different hydrogels. (*) indicates significant difference (p<0.05) to the other hydrogel(s) for that time point. Phalloidin/DAPI staining for F-actin/cell nuclei on day 2 of culture on (F) PEGDA4000 and (G) PGMma1:1 medium DM. Scale bars represent 1OOIm. (H) Determination of cell density, defined as the number of DAPI stained nuclei per PGMma1:1 medium DM hydrogel area. (*) indicates significant difference (p<0.05). ... 33 Figure 3.1. Synthesis scheme of (A) gellan gum methacrylate (GGMA) (pictured as above for simplicity, although methacrylic anhydride can react with any hydroxyl group in gellan gum) and (B) gelatin methacrylamide (GeIMA). (C) Fabrication of DN hydrogels through a two-step photocrosslinking process.
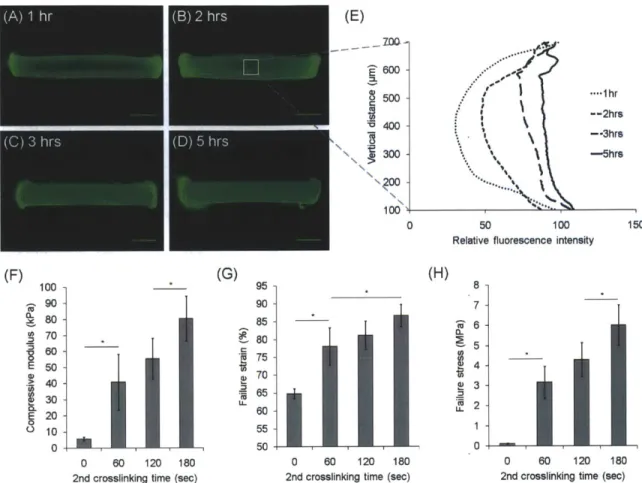
... ... ... -- -- - ... 4 2 Figure 3.2. Formation of double-network (DN) hydrogels. (A-D) Diffusion of FITC-GeIMA molecules into
GGMA hydrogels over time. (A) 1hr, (B) 2hrs, (C) 3hrs, (D) 5hrs. Scale bars represent 1 mm. (E) Vertical fluorescence profile of the cross-section of hydrogels over time. (F) Compressive modulus, (G) failure strain, and (H) failure stress of DN hydrogels with varying 2nd crosslinking time. 0.5% GGMA hydrogels
crosslinked for 120 seconds and 20% GelMA(DM: 14.7%) solutions were used for (A)-(H). (*) indicates significant d ifference (P < 0.05). ... 49 Figure 3.3. (A) FTIR spectra of GGMA and dried GGMA hydrogels crosslinked for varying time. The shoulder peak appearing around 1640cm-1 corresponds to the unreacted C=C bonds. (B) Stress-strain curves of GGMA/GelMA SN and DN hydrogels with the same mass ratio (GeIMA/GGMA = 8.2). Every crosslinking time was 120 seconds, and GelMA (DM: 32.3%) was used. The number in parenthesis refers to the polym er content of the hydrogels. ... 51
Figure 3.4. (A) Stress-strain curves for SN and DN hydrogels under uniaxial compression. (B) Polymer content, (C) compressive modulus, (D) failure strain, and (E) failure stress of SN and DN hydrogels. (t) indicates the stress under which the majority of GeIMA SN gels started to break, and the strain at that stress. Every crosslinking time was 120 seconds, and GelMA (DM: 32.3%) was used for (A)-(E). (*) indicates significant difference (P < 0.05). ... 53
Figure 3.5. (A) Degree of methacrylation (DM) of GeIMA with varying amount of methacrylic anhydride added to the reaction. (Inset in B) Polymer content of DN hydrogels with varying DM of GeIMA. Effect of DM of GeIMA on (B) compressive modulus, (C) failure strain, and (D) failure stress of DN hydrogels. Every crosslinking time was 120 seconds. 0.5% GGMA hydrogels and 20% GeIMA(each DM) solutions were used for (A)-(E). (*) indicates significant difference (P < 0.05). ... 55
Figure 3.6. Mass ratio (GeIMA/GGMA), polymer content, compressive modulus, failure strain, and failure stress of DN hydrogels with varying concentration of either component: (A) varying concentration of
GGMA hydrogels + 20% GelMA solution, and (B) 0.5% GGMA hydrogels + varying concentration of
GelMA solution. GeIMA (DM: 32.3%) was used for (A)-(B). (*) indicates significant difference (P < 0.05). ... 5 6 Figure 3.7. Fluorescence images of live/dead stained NIH-3T3 fibroblasts encapsulated in DN hydrogels:
(A) day 0 and (B) day 3 of culture after DN hydrogel formation. Scale bars represent 200pm. (C) Viability
of 3T3 fibroblasts encapsulated in SN and DN hydrogels. (*) indicates significant difference (P < 0.05). 0.5%
GGIMA hydrogels and 20% GelMA (DM: 14.7%) solutions were used for (A)-(C). ... 57
Figure 4.1. Preparation procedure of M R hydrogels. ... 65
Figure 4.2. SEM (A-D) and optical microscope images (E-H) of GG microgels prepared at different polymer concentrations: (A,E) GG1.0, (B,F) GG1.5, (C,G) GG2.0 (D,H) GG2.5. The scale bars in (A-D) represent 2pm, and the scale bar in (E) represents 50tm. (1) Particle size of GG microgels in PBS. (J)
Swelling ratio of GG microgels in distilled water. (*) indicates significant difference (p<0.05) ... 66
Figure 4.3. Polymer concentration of MR hydrogels (A) and mechanical properties of gelatin and MR hydrogels: (B) stress-strain curve (MRx-y: GG concentration is x% in microgels and y% in MR hydrogels),
(C) compressive modulus and (D) failure strength. Compressive modulus and failure stress of DN
hydrogels are added for comparison in (C) and (D) in each dotted box. (*) indicates significant difference
(p < 0 .0 5 ). ... 6 8 Figure 4.4. SEM images of cross-section of hydrogels. The scale bars represent 10pm. ... 70
Figure 4.5. (A) Live/dead staining on MC3T3-E1 cells / hydrogel constructs after 1 and 14 days in culture. The scale bar represents 100pm.(B) Viability and (C) metabolic activity (AlamarBlue assay) of MC3T3-E1 cells encapsulated in hydrogels after culture. (*) indicates significant difference (p<0.05). ... 71
Figure 4.6. Alkaline phosphatase expression of MC3T3-E1 cells normalized by the amount of DNA after culture. (*) indicates significant difference (p<0.05). ... 73
Figure 4.7. Alizarin Red S staining on MC3T3-E1 cells / hydrogel constructs after 1 and 28 days in culture. The scale bar represents 500 pm . ... 74
Figure 4.8. Quantification of Alizarin Red S stained in MC3T3-E1 cells / hydrogel constructs. (*) indicates significant d ifference (p<0 .05). ... 74
List of tables
Table 2.1. Composition by 1H NMR and molecular weight distribution of PGM. ... 28
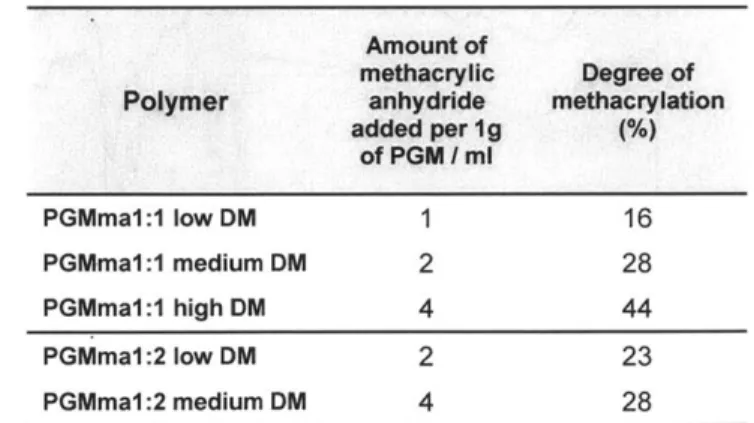
Table 2.2. The amount of methacrylic anhydride added to PGM and the resulting degree of m ethacrylation of PG M m a polym ers. ... 28
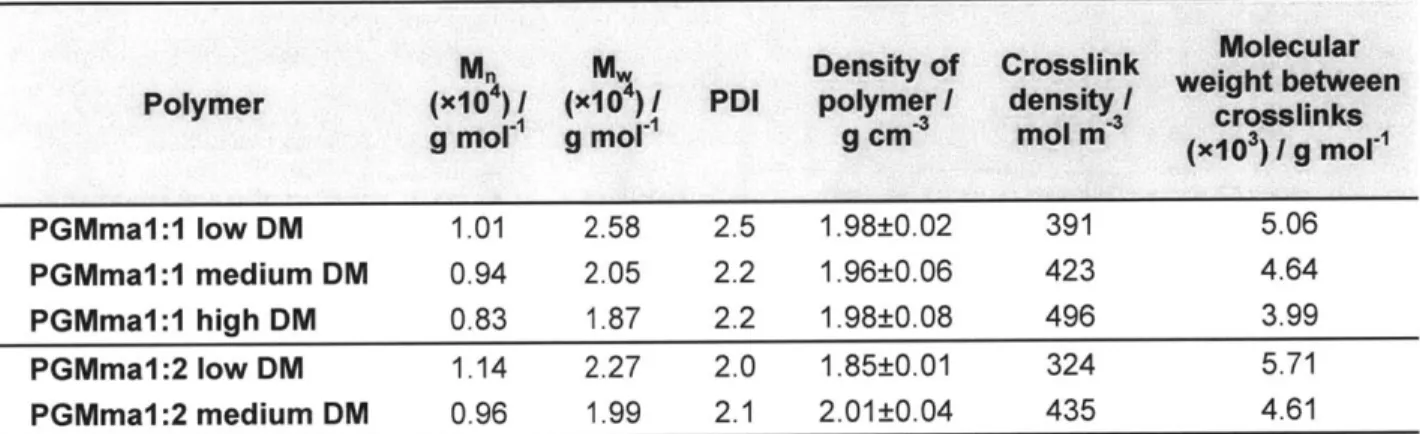
Table 2.3. Physical properties of PGMma polymers and hydrogels. Crosslink density and molecular weight between crosslinks were calculated for 15% hydrogels. ... 29
Chapter 1: Introduction and background
1.1. Scaffolds for tissue engineering
The general strategy to create new organs or tissues is to seed appropriate cells into biodegradable scaffold, and culture them with various environmental factors in order for the cells to make their own extracellular matrix (ECM) and form a new tissue structure, while the scaffold degrades away 1. Scientists have been studying about the three major components of tissue engineering, which are cells, environmental factors, and scaffolds. First, an adequate source of healthy, expandable cells is required to obtain a large amount of cells enough to engineer tissue constructs, thus autologous, allogeneic, and xenogeneic cells are being studied respectively for engineered implants 2. Stem cells are a promising candidate for treating tissues
where the source of cells is limited 3, and methods to better handle them are actively being
examined. Second, various environmental factors such as growth factors, mechanical forces, and ECM molecules affect growth and function of cells. They selectively interact with specific stimulus receptors expressed on the surface of cells to facilitate repairs of damaged tissues4.
The scaffold is also a very important part of tissue engineering as it accommodates cells and guides their growth in three dimensional tissues. There are several requirements in the design of scaffolds. They have to be biocompatible, biodegradable, porous and permeable, exhibit adequate mechanical properties, and possess surface chemistry for cell attachment 5.
Metals and ceramics have been used extensively for surgical implantations, but most of them are not biodegradable, and their proscessability is very limited 6. Due to these reasons,
polymers have become a promising candidate for scaffolds. Natural polymers such as collagen and chitosan closely mimic the native cellular environment, so they have been studied widely to repair various tissues. Biodegradable synthetic polymers such as poly(a-hydroxy ester)s, poly(ortho esters), and polyanhydrides were developed as alternatives to natural polymers 7. Synthetic polymers can be prepared with controllable and reproducible properties, and most of them degrade by chemical hydrolysis, not by enzymatic processes, so their degradation does not depend on the patient. However, many of them produce acidic degradation products which
can harm cells, and they are hydrophobic and typically prepared in severe conditions
8
preventing from encapsulating viable cells to provide three-dimensional environment
1.2. Hydrogels as tissue scaffolds
Hydrogels are a network of hydrophilic polymer chains that contain a large amount of water. Hydrogels have received great attention as tissue scaffolds due to their high water content, biocompatibility, and good permeability for transport of nutrients and wastes. It can also be injected into the body in a minimally invasive method, and encapsulate cells to provide three-dimensional environment which mimics native tissues more closely 8,9. Various synthetic
and natural materials can be used to form hydrogels as tissue scaffolds. Synthetic materials include poly(ethylene glycol), poly(vinyl alcohol), poly(acrylic acid), and polypeptides. Natural materials include proteins and polysaccharides such as collagen, gelatin, chitosan, alginate, and hyaluronic acid. Hydrogels can be formed by inherent phase transition, ionic crosslinking, or covalent crosslinking. For example, collagen forms hydrogel by temperature-driven phase transition, but it is too soft to handle 1. Alginate forms hydrogel by ionic crosslinking with multivalent cations, however, ionic crosslinking is not stable due to exchange of ions with other ionic molecules in aqueous solutions ". Covalent crosslinking is more stable, resulting in relatively stiff hydrogel, but most of the chemical crosslinkers are toxic to cells. Thus, a covalent crosslinking method that is cell-compatible may be desirable.
1.2.1. Photocrosslinked hydrogels
As a way of cell-compatible crosslinking, photocrosslinking has been widely used for tissue scaffold studies. Polymers are modified to become photocrosslinkable by functionalizing with photoreactive moieties such as acrylate or methacrylate groups before they are dissolved with photoinitiator and exposed to light. Then the initiator creates radicals that are transferred to the photoreactive groups to undergo chain polymerization. Studies have shown that by using mild conditions (light intensity, kind and the amount of photoinitiator, and exposure time), photocrosslinking is compatible with encapsulation of a variety of cells 12, 13 Besides
cell-compatibility, this method enables temporal and spatial control in the fabrication of complicated structures 14, 15. For example, control of light by using masks can make
asymmetrical matrix environment, which leads to spatially patterned differentiation of embryonic stem cells 16. The photoreactive groups can be attached to any polymers with
pendant functional groups such as hydroxyl or amine groups, and the process is very simple. Most of the common natural polymers such as collagen 17,18 gelatin 19-21, chitosan 22, alginate
24, 25 dextran 26-28, and hyaluronic acid 29-31 have been modified to form photocrosslinked
hydrogels for tissue engineering researches. Given these advantages, photocrosslinked hydrogels are a powerful tool in developing tissue constructs.
1.3. Hydrogels with high mechanical strength
The mechanical properties of native tissues vary depending on their functions. The softest tissues such as brain and liver exhibit the modulus of hundreds of Pa, while lung and cardiac muscle are stiffer with the modulus ranging from several to a few hundred kPas 32.
Load-bearing tissues such as cartilage, tendon, and bone exhibit much higher modulus, which is on the order of MPa or even up to GPa 32,33 These load-bearing tissues have strength of a few
tens to a few hundred MPas, which is enough to prevent from failure of the tissues by frequent loads 34-36. It has been a main challenge to create tissue scaffolds of which the mechanical
properties closely mimic the native tissues. In particular, despite several advantages of hydrogels as tissue scaffolds, the mechanical weakness of hydrogels is a critical defect in using them as load-bearing tissue scaffolds. The strength of most traditional hydrogels is below 1
MPa 37-40. Thus, several new platform materials have been developed to improve the
mechanical strength of hydrogels.
A main reason that traditionally crosslinked hydrogels are weak is the heterogeneous distribution of crosslinks that result in concentrated stress around the dense crosslinks 41. Thus,
some studies used an approach of making homogenous crosslinks distribution for uniform distribution of stress. Tetra-PEG hydrogel 42 was designed by combining two tetrahedron-like
functional groups that can react with each other, the two macromers were connected alternately so the resulting hydrogel had a homogeneous network structure leading to high mechanical strength. Polyrotaxane hydrogel 43 consisted of poly(ethylene glycol) (PEG) chains and a-cyclodextrin molecules threaded and trapped by large end groups on the PEG chains. These a-cyclodextrin molecules were chemically crosslinked, so the crosslinkers could slide to distribute the tension evenly throughout the hydrogel, resulting in highly stretchable hydrogel. Nanocomposite hydrogel 44 was prepared by mixing clay slabs and N-isopropyl acrylamide
(NIPAM) monomers followed by radical polymerization of the NIPAM monomers. The clay slabs served as multifunctional crosslinkers dispersed uniformly to distribute tension and make the polymer chains connected to the same clays withstand the load cooperatively.
Self-assembly of copolymers was also used to develop strong hydrogels. lonically crosslinked triblock copolymer hydrogel 4 was prepared by synthesizing an amphiphilic triblock copolymer consisting of two glassy poly(methyl methacrylate) end blocks and a poly(methacrylic acid) midblock. The ionic crosslinking among carboxylate groups in conjunction with the self-assembled triblock copolymer network resulted in high mechanical strength. A responsive block copolymer composed of poly(N-isopropylacrylamide) (PNIPAM) end blocks and a protein midblock containing coiled-coil associating domains was also developed 46. The thermoresponsive self-assembly of PNIPAM blocks reinforced the shear
thinning hydrogel formed by the association of the engineered protein blocks.
Although strong hydrogels have been prepared using various strategies as explained above, challenges exist in using them as tissue engineering scaffolds, such as cytotoxic, non-biodegradable materials, cytotoxic processing conditions, and insufficient strength. Modifications to these approaches are needed to make the hydrogels biodegradable and enable cell-compatible processing conditions and better cell-hydrogel interaction.
1.3.1. Double-network (DN) and microgel-reinforced (MR) hydrogels
Another approach to make a strong hydrogel is through the use of double-network (DN) molecular approach. DN hydrogel consists of two networks with opposing mechanical
properties, one being stiff and brittle and the other being soft and ductile. Combination of these two networks with different mechanical properties results in the formation of strong hydrogels. Several DN hydrogels have been prepared from various materials. Gong et al. used highly crosslinked poly(2-acrylamido-2-methylpropanesulfonic acid) (PAMPS) and loosely crosslinked poly(acrylamide) (PAAm) 41. N,N'-methylenebisacrylamide (MBAA), a chemical crosslinker, was used to control the crosslink density of each network. Waters et al. prepared DN hydrogels by photocrosslinking PEG and poly(acrylic acid) sequentially 48. Natural polymers
were also used to create DN hydrogels. Nakayama et al. created bacterial cellulose-based hydrogels which exhibit anisotropic mechanical properties by adding gelatin or polysaccharides such as gellan gum, alginate, and carrageenan physically crosslinked . Weng et al. used methacrylated hyaluronic acid and N,N-dimethylacrylamide to prepare strong hydrogels for corneal implant applications 50
Gong et al. studied extensively on the structure and strengthening mechanism of their DN hydrogels. With the data obtained by using dynamic light scattering, they proposed a structure model in which the PAMPS network is inhomogeneous and voids exist due to the radical polymerization si. The PAAm network interpenetrates in the PAMPS network and also fills the voids, absorbing the energy needed for crack propagation in the PAMPS network. It was also found that a large damage zone is formed around a crack tip which prevents the crack propagation, and the rigid network fragments into small clusters, which plays a role of crosslinkers correcting the inequality of stress 41,52. The effects of several parameters on the
strength of DN hydrogel were also studied. The significant enhancement of strength of DN hydrogels was obtained only when the molar ratio of the second to the first polymer was as high as several to a few tens. In addition, an optimal crosslink density for the second network existed, that with higher crosslink density lowering the strength 47. The molecular weight of the second polymer was also an important parameter for strengthening the DN hydrogels, with a critical value for a remarkable enhancement s3. High concentration of the second polymer was needed for more entanglement with each other . It was also found that the addition of a small amount of voids into the first network increased the strength of the DN hydrogels. The
voids led to concentrated stress around them which allowed wider range of internal fracture of the first network 5.
Knowing that strengthening of the DN hydrogels is due to the first network that helps to dissipate the stress, Gong et al. also tried to introduce PAMPS microgels into PAAm hydrogels as a strengthening motif of the same manner 56, 57. The microgel-reinforced (MR) hydrogels
exhibited significant enhancement in mechanical strength in comparison to the hydrogels with no mirogels, and they showed comparable mechanical properties with the DN hydrogels prepared from the same polymers. It was found that the two parameters, the concentration of the microgels in the MR hydrogels and the molar ratio of the two polymers in the microgel phase were critical in the strength of the MR hydrogels.
Similar approaches that used microgels to reinforce hydrogels have also been developed. For example, Qin et al. prepared hydrogels containing hydrophilic reactive microgels (HRM) by embedding PAAm microgels into PAAm/PAMPS hydrogels 58. The PAAm microgels were
modified with C=C double bond so that they could be covalently linked to the PAAm/PAMPS hydrogels. By altering the microgel concentration in the HRM hydrogels and the mass ratio of PAAm/PAMPS, the strength of hydrogels were tuned. Lally et al. added either ethyleneglycol dimethacrylate or PEG dimethacrylate as a crosslinking monomers in a dispersion of pH-responsive poly (ethylacrylate/methacrylic acid/butanediol diacrylate) microgels and crosslinked the monomers -9. The mechanical properties of the resulting hydrogels were tunable by changing the pH or the type of the crosslinking monomers. Jha et al. prepared hyaluronic acid microgels modified with methacrylate groups 60. The microgels were then
integrated by covalent bonds in the bulk hydrogel from methacrylated hyaluronic acid resulting in stronger hydrogels. Chondrocytes could be encapsulated in these hydrogels with minimal cell damage, and they produced cartilage specific extracelluar matrix.
However, these strategies that used DN or microgel approach still have limitations in using them as tissue scaffolds such as non-biodegradable materials, cytotoxic processing conditions, and poor cell-matrix interaction.
1.4. Bone tissue engineering
Bone is a composite material consisting of 65-70% hydroxylapatite mineral part, and 25-30% organic part 61. It is arranged in two architectural forms, which are trabecular or cancellous bone that composes about 20% of the total skeleton and cortical or compact bone that composes about 80% of the total skeleton 6. Cortical bone is very stiff and strong, being about
10% porous, while trabecular bone has a high porosity of 50-90% exhibiting around 20 times inferior stiffness and strength than cortical bone 62. The proportion of these two types of bone
differs depending on locations in a body. Bone tissue is maintained by the interaction of three cell types: osteoblasts, which synthesize and regulate bone ECM deposition and mineralization, osteocytes (former osteoblasts entrapped in mineral), which play as a sensor and information transfer system, and osteoclasts, which resorbs bone 63
Roughly one million cases of bone defects are occurring each year and treating these defects is raising more concern due to the ageing of population 63. Autologous and allogeneic bone grafting have been effective in alleviating the disability, but they have limitations such as
64
insufficient donor tissue, immune rejection, donor site morbidity, and pathogen transmission Metals and ceramic were also used as alternatives, but they also presented disadvantages such as poor overall integration with native tissue and mechanical mismatch 63. Bone tissue
engineering thus has been actively investigated to overcome these issues. There are two critical components to engineer bone tissue: cells and scaffolds.
Obtaining a sufficient amount of appropriate cells is essential to engineer tissue construct. The obvious choice of cells for bone tissue engineering is osteoblasts. However, only a small amount can be obtained after isolation of osteoblasts, and their growth rate is relatively low 63. In addition, in case of autologous cells from a patient with bone related diseases, the protein expression of the osteoblasts may be under the normal values 65. Stem cells are a great alternative since they can be easily isolated and expanded in vitro. The finding that the embryonic stem cells differentiated into osteoblasts in the presence of dexamethasone was of particular interest for bone tissue engineering 66. Due to ethical concerns with embryonic stem
cells, mesenchymal stem cells (MSCs) isolated from bone marrow, which were found to be able to differentiate into osteoblasts in the adequate culture condition 67, are being used broadly in
bone tissue engineering research. The osteogenic differentiation of MSCs is influenced by many factors, but they are usually cultured in media containing L-ascorbic acid, @-glycerolphosphate,
and dexamethasone 68,69. The osteogenic potential can be determined by examining alkaline
phosphatase (ALP) activity, expression of the osteogenic markers such as osteocalcin, osteocalcin, bone morphogenetic protein, and type I collagen at the mRNA and protein levels, and formation of mineralized ECM containing hydroxyapatite 69,70
The required properties of bone tissue scaffolds are biodegradability, porosity that allows cell in-growth, surface properties for cell adhesion and proliferation, osteoinductivity, and sufficient mechanical strength 63. Generally, ceramics, polymers, and composite of these
are being used. Ceramics such as
p-tricalcium
phosphate, hyaroxyapatite have shown good results regarding bone regeneration due to their osteoconductivity and osteoinductivity 7-74However, they are too brittle and their degradation rate is difficult to control 75. Natural polymers such as collagen 76-78, hyaluronic acid 31,79-81, and silk 82-84 provide innate biological
guidance to cells and exhibit the capability of interacting with the host tissue .Synthetic polymers such as poly(a-hydroxy acids) 85-87 and polycaprolactone 88-91 have chemical versatility
and processability, and PEG 92-94 has advantages as hydrogel. However, polymers are too soft
and weak. In order to improve the mechanical properties, various ceramics/polymers composite scaffolds 9s-99 have also been studied.
1.5. Specific aims of thesis
The goal of this thesis is to develop hydrogels with high mechanical strength and biological activity for tissue engineering applications. There are three chapters in this thesis that describe three separate projects which consistently aimed at developing strong cell-laden hydrogels.
The aim of the first project (Chapter 2) was to synthesize biodegradable, hydrophilic polymer that forms hydrogels with tunable mechanical properties and cell-adhesivity. From two starting monomers, glucose and malic acid, which are found in the human metabolic system, was synthesized the polymer by a polycondensation reaction. By the following modification
with methacrylate groups, the polymer became photocrosslinkable into hydrogels. By altering the ratio of the starting materials and the degree of methacrylation, several formulations were prepared and then characterized chemically and physically. Degradation, mechanical properties of the resulting hydrogels and cell adhesion and proliferation on them were examined.
The second project (Chapter 3) aimed at developing cell-laden strong hydrogels by using the double-network (DN) approach. It was concluded from the first project that it is better to use biomacromolecules with high molecular weights than to synthesize a polymer from monomers to prepare hydrogels with high mechanical strength. In addition, DN approach can develop hydrogels with higher strength than traditional single-network (SN) hydrogels. Thus, in this project, cell-laden DN hydrogels with high strength were developed from two
photocrosslinkable biomacromolecules, gellan gum (GG) and gelatin, by using a cell-compatible two-step photocrosslinking. The mechanical strength of the resulting DN hydrogels was measured and compared with that of SN hydrogels, and the parameters that affect the strength of the DN hydrogels were examined. The viability of the cells encapsulated in DN hydrogels was
measured to show the cell-compatibility of the DN formation process.
The aim of the last project (Chapter 4) was to develop cell-laden microgel-reinforced (MR) hydrogels from the same two polymers with the DN hydrogels developed in the previous project, which have better mechanical strength and biological properties in comparison to the DN hydrogels. By incorporating the stiff GG network into gelatin hydrogels as microgels, not as bulk hydrogels as for DN hydrogels, embedding GG networks with higher concentrations led to higher strength of the resulting hydrogels, and stronger cell-hydrogel interaction was possible. The mechanical properties of the MR hydrogels were compared to the DN hydrogels and the gelatin hydrogels with no microgels, and the effect of the formulation on the strength of MR hydrogels was investigated. The metabolic activity and osteogenic behavior of the encapsulated preosteoblasts were examined to prove high potential of the MR hydrogels as tissue scaffolds.
Chapter 2: Cell-adhesive and mechanically tunable glucose-based biodegradable hydrogels
The content of this chapter has been published in the following journal article: Shin H, Nichol JW, Khademhosseini A. Cell-adhesive and mechanically tunable glucose-based biodegradable hydrogels. Acta Biomaterialia 2011;7(1):106-114
2.1. Introduction
Synthetic biodegradable polymers are of great interest for various biomedical applications such as drug delivery and tissue engineering 100. For many biomedical applications, it is desirable to control the mechanical and biological properties of these materials . Previously, various synthetic biodegradable polymers have been made to improve the properties of biomaterials for various applications 102-109. However, these polymers are
generally hydrophobic greatly limiting the ability to encapsulate cells into the construct. Hydrogels, a class of biomaterials formed from hydrophilic polymers, are attractive for many reasons such as their biocompatibility and the fact that they contain similar water content and mechanical properties as natural tissues 110- .In particular, hydrogels from photocrosslinkable polymers can be injected into the body, encapsulate cells uniformly, and enable temporal and spatial control in the fabrication of complex structures 14' 5'10'11,13
Over the years, a number of synthetic hydrogels have been developed for biomedical applications. Poly(2-hydroxyethyl methacrylate) (PHEMA), poly(N-isopropylacrylamide) (PNIPAAm), poly(vinyl alcohol) (PVA) and their derivatives are vinyl monomer based synthetic polymers that have been studied for applications such as contact lenses, drug delivery, and tissue engineering 14-10. However, these hydrogels are nondegradable and their vinyl monomers and crosslinking molecules may be toxic 11. Poly(ethylene glycol) (PEG) is one of the most studied hydrophilic biomaterials and has been approved by the FDA for certain applications. While PEG hydrogels are inert and exhibit low toxicity, they are not biodegradable. To render PEG biodegradable, several methods have been developed such as copolymerization of PEG with biodegradable poly(a-hydroxy esters), such as poly(lactic acid) (PLA) and poly(glycolic acid) (PGA), or with peptides that are enzymatically degradable 1-14. Recently, a new hydrophilic biodegradable polymer, poly(xylitol citrate)methacrylate (PXCma) was
synthesized from non-toxic starting monomers: xylitol and citric acid 10. While the PEG based hydrogels include PEG macromers in their degradation products, PXCma hydrogels completely degrade into the original monomers, xylitol and citric acid that are endogenous to human metabolic system. However, despite its merits, PXCma was mechanically weak and not cell adherent.
In this study, we synthesized a hydrophilic biodegradable polymer, designated poly(glucose malate)methacrylate (PGMma), which can form hydrogels that degrade into the starting monomers, glucose and malic acid. Glucose is a metabolic intermediate, which is commonly available, inexpensive and could be used as an energy resource by cells when
released through degradation of the polymer. Malic acid is nontoxic, an ingredient in many foods and its anion is an intermediate in the citric acid cycle 125. The polymer form, poly(malic
acid), has been demonstrated in various biomedical applications 126,127. As in previous reports
on using polycondensation reactions with multifunctional monomer(s) to synthesize biodegradable elastomers or hydrogels, we used two hydrophilic, multifunctional monomers, glucose and malic acid, to form a randomly branched, hydrophilic; and hydrolyzable polyester, poly(glucose malate) (PGM) by polycondensation 102, 103, 108, 109. After the polycondensation
reaction, the remaining unreacted hydroxyl groups enabled further functionalization. To render the PGM photocrosslinkable, we functionalized the free hydroxyl groups of PGM with methacrylate groups by reacting PGM with methacrylic anhydride, as previously described for methacrylation of hyaluronic acid 128, 129. Finally, we used the resulting photocrosslinkable
PGMma to fabricate hydrogels through a light initiated crosslinking process. We characterized the properties of the resulting hydrogel as a function of the stoichiometric ratio of the starting monomers, the degree of methacrylation, and polymer concentration. Furthermore, cell adhesion tests showed that PGMma is cell-adhesive. Given its broad range of properties, PGMma may be useful for various tissue engineering applications or as a material in cell culture.
2.2. Materials and methods
HO 0 HO OH HO OH (1) 0 HOO + HOy OH 0 OH (2) UV Hydrogel . RO 0 0 RO OR 0 OR (3) j 0 ')IO~r(4) 0
OYO
RO OR 0 OR (5)Figure 2.1. General synthetic scheme of PGMma hydrogel. (1) glucose, (2) malic acid, (3) PGM, (4) methacrylic anhydride, (5) PGMma. PGM and PGMma is randomly branched polymer because R can be H, glucose, malic acid, or polymer chain.
All chemicals were obtained from Sigma-Aldrich. PGMma was synthesized as follows (Figure 2.1.). Two batches of PGMs with varying molar ratios of starting materials were synthesized. D-(+)-glucose and DL-malic acid were mixed in a round bottom flask with molar ratio of 1:1 for PGM1:1 and 1:2 for PGM1:2. They were heated and stirred under argon gas to 135*C. Under these conditions, malic acid melts and dissolves the glucose in the mixture. After glucose dissolved completely, vacuum was applied for five minutes and the resulting viscous intermediate material was cured at 900C for 2 days inside a vacuum oven. The resulting mixture was dissolved in distilled water, dialyzed by a membrane with molecular weight cutoff of 6-8 kD, and lyophilized. PGM macromers were methacrylated as previously described 129. Briefly, methacrylic anhydride was .reacted with PGM in distilled water on ice for 24 h. The pH of the solution was kept at 8 with 5 N NaOH. The solution was then dialyzed (MW cutoff 6k-8kDa) for 48 h, and lyophilized to yield PGMma. To modify the degree of methacrylation (DM), we added varying amounts of methacrylic anhydride (i.e. Iml, 2ml, and 4ml per Ig of PGM).
2.2.2. Characterization of PGMma polymers
IH-NMR spectra of PGM and PGMma polymers were obtained in D20 on a Varian 300 NMR spectrometer. The chemical composition of the polymers was calculated by the signal integrals of glucose, malic acid and methacrylate group. Molar ratio of glucose and malic acid in the polymers were calculated by the peaks at 3.2-4.5 ppm from glucose compared with peaks at 2.7-3.2 ppm from malic acid. DM was calculated by the peaks at 1.8-2.0 ppm from methacrylate group and the peaks from malic acid. It was defined as the number of methacrylate groups divided by the number of free hydroxyl groups prior to the methacrylation reaction. Since one hydroxyl group is always removed whenever either a glucose or malic acid monomer becomes attached to the PGM polymer, regardless of the location, the total number of free hydroxyl groups in the resulting PGM polymer will not vary based on the degree of branching. Therefore, the number of hydroxyl groups was counted as the number of glucose monomers multiplied by 3 plus the number of malic acid monomers because, regardless of how the polymer is branched, the number of hydroxyl groups in the resulting PGM structure will be the same as the simplified case where each glucose monomer has three remaining hydroxyl groups and each malic acid monomer has one remaining hydroxyl group. FT-IR analysis was performed on a Bruker Alpha FT-IR spectrometer. Molecular weight distribution was determined by gel permeation chromatography (GPC, Viscotek TDAmax) using PEG standard,
0.05M NaNO3 aqueous solution as eluentia and a 3x Viscotek GPMWxL column with triple
detection (refractive index, light scattering, and viscometer detector). By combining the data set obtained from three kinds of detectors, the absolute molecular weight was calculated with high accuracy independent of the degree of branching. Densities of polymers were measured with an Ultrapycnometer 1000 (Quantacrome Instruments).
2.2.3. Photopolymerization
PGMma polymer solutions were prepared by dissolving PGMma polymers at three different concentrations (10, 15, 20 wt%) in phosphate buffered saline (PBS) containing 0.05 wt% photoinitiator (Irgacure 2959). They were subsequently molded into disks (~8mm diameter,
~1mm thickness) and cured by exposure to light (320-500nm, ~4 mW cm-2 for 10min) (EXFO
OmniCure S2000).
2.2.4. Hydrogel Characterization
Sol content was determined by measuring the difference in mass of dried sample before
(mi) and after (mf) immersion in distilled water with agitation for 1 h. It was calculated as:
Sol content (%) = X 100 (1)
Mi
Hydration by mass was determined by measuring the difference in mass of sol-free hydrogels in relaxed state(mr) and in swollen state(m) after 24 h in PBS. mr was calculated by measuring the initial mass of hydrogel and subtracting sol content from it. Hydration by mass was calculated as:
Hydration by mass (%) = m x 100 (2)
mr
Crosslink density (n = p / M) and molecular weight between crosslinks (M) were calculated by the following equation for hydrogels ...:
pRT 2M 1 V (
I" = (1 - 4(a -a2)(-V -))
Me Ma2 C v,
n r
where t is the compression modulus of the hydrogel, R is the universal gas constant, T is temperature, p is the mass density, vs is the polymer volume fraction in the swollen state, Vr is the polymer volume fraction in the relaxed state, and a is the elongation ratio, which is related to the polymer volume fraction in the swollen state for isotropically swollen hydrogel:
a = vs3 (4)
Compression analysis of PGMma hydrogels was performed on an Instron 5542 mechanical tester. Hydrogel disks were prepared as described above and allowed to equilibrate in PBS for 24 h and then were compressed on the tester until failure at a rate of 0.2 mm min-1.
Compressive modulus was determined as the slope of the linear region in the 5-10 % strain range.
To analyze the degradation rate of the hydrogels, disks were fabricated as described above and incubated in PBS at 370C on an orbital shaker. PBS was replaced every 48 h. At each time point, samples were removed, lyophilized and weighed. Mass remaining was calculated by dried mass at each time point (mt) compared to initial dried mass (mo) using the following equation:
Mass remaining (%) x 100 (5)
When the hydrogel dissociated completely, we plotted this point as zero mass remaining. Thus the final time point signified in the degradation plot (Figure 2.5) occurred somewhat sooner than the true point at which mass would be actually zero.
2.2.5. Cell culture
NIH 3T3 fibroblasts were cultured in high glucose Dulbecco's Modified Eagle Medium (DMEM, Invitrogen) supplemented with 10% fetal bovine serum (FBS, Invitrogen), 100 U/ml penicillin (Invitrogen), and 100 pg/ml streptomycin (Invitrogen) in a 5% CO2 atmosphere at 37*C.
Cells were passaged approximately 2 times per week and media was exchanged every 2 days.
2.2.6. Cell adhesion and proliferation on PGMma hydrogels
Square hydrogel pieces (1cm x 1cm x 300pm) were made by crosslinking 15% (w/v) PGMma polymer in PBS, which was previously filtered through a 0.2pm filter for sterilization, on 3-(trimethoxysilyl)propyl methacrylate coated glass slides to prevent the gels from detaching from the glass slide in growth media. After soaking the gels in growth media for six hours, they were put in 4-well plates and each well of the plates was filled with 4ml of cell suspension containing 5 x 10⁵ cells ml-1. These plates were then incubated at 37*C and the hydrogel
viability kit (Invitrogen) and visualized under a fluorescent microscope. Confluence of the cells on the hydrogel films were determined by analyzing fluorescent images by using ImageJ
software. Three formulations of PGMma - PGMma1:1 medium DM, PGMma1:1 high DM, and PGMma1:2 medium DM - were tested with poly(ethylene glycol) diacrylate 4000 (PEGDA4000, molecular weight: 4000) for comparison. In addition, to test the addition of gelatin for enhancing biological properties of the gels, hydrogels were made by mixing gelatin methacrylamide (GeIMA) with PGMma1:2 medium DM (15% PGMma1:2 medium DM + 1% GelMA). Since gelatin is processed from collagen, it contains similar bioactive features as collagen . GelMA was prepared according to a method previously described .31 To better show the cell morphology, cells cultured on PEGDA4000 and PGMma1:1 medium DM were fixed and stained with Alexa Fluor 594-labelled phalloidin (Invitrogen) and DAPI to visualize F-actin filaments and cell nuclei respectively. Total cell number was quantified by counting DAPI stained nuclei.
2.2.6. Statistical analysis
All data are expressed as mean ± standard deviation. Statistical significance was measured by performing one-way or two-way ANOVA where appropriate (GraphPad Prism 5.02, GraphPad Software). Tukey's multiple comparison test and Bonferroni test were used with one-way and two-one-way ANOVA each to determine significance between specific treatments.
Differences were taken to be significant for p<0.05.
2.3. Results
2.3.1. PGMma polymer synthesis and characterization
To generate a hydrogel, we first synthesized the PGM polymer through bulk polycondensation reaction of D-(+)-glucose and DL-malic acid. Since every hydroxyl group of
(A) RO a a a n RO R 0 OR a b 8 7 6 5 4 3 2 1 0 ppm (B) d O= 0d
b 0 AY
RO OR 0 OR c b 8 7 6 5 4 3 2 1 0 ppm (C) 0. g 0.5-PGM 0.85 -0.8 -E.7 PGMmna 0.7 0.65 - ester group+-op4 vinyl group 0.61 3500 2500 1500 500 Wavenumber/ cm='Figure 2.2. (A) Representative 1H NMR spectrum of PGM. (B) Representative IH NMR spectrum of PGMma. (C) Representative FT-IR spectra of PGM and PGMma.
glucose and malic acid can react, the PGM polymer is randomly branched rather than linear (Figure 2.1. (3)). Two stoichiometric ratios of glucose to malic acid were made: PGM1:1 and
PGM1:2. Figure 2.2. (A) shows a representative 'H NMR spectrum of PGM1:1. The chemical composition of these two PGMs were determined by 1H NMR to be 1: 1.01 and 1: 1.97 (Table 1) as determined by the signal integral of glucose and malic acid. These chemical compositions were similar to the molar ratio of the starting materials. An FT-IR spectrum of PGM (Figure 2.2. (C)) confirmed ester bond formation with a peak at 1732cm-1. A broad band centered at 3388cm-1 was also detectable, most likely due to hydrogen bonded hydroxyl groups, while a small band centered at 2934cm-1 was detectable due to sp3-hybridized C-H bonds. The number average molecular weight (Mn), weight average molecular weight (Mw), and polydispersity index (PDI) determined by GPC with three types of detectors (refractive index, light scattering, and viscometer detector) are summarized in Table 2.1.
Polymer Composition M~(~1O4) M~(x1O4) PDI
Polymer Compositionby 'H NMR PGM1:1 1 :1.01 PGM1:2 1 :1.97 M. (x104) M" (X 104) PD g mol / g mo1 1.51 9.77 6.5 1.18 6.41 5.4
Table 2.1. Composition by 'H NMR and molecular weight distribut
Amount of
methacrylic Degree of
Polymer anhydride methacrylation
added per 1g (%) of PGM / mI PGMma1:1 low DM 1 16 PGMmaI:1 medium DM 2 28 PGMmaI:1 high DM 4 44 PGMmaI:2 low DM 2 23 PGMmaI:2 medium DM 4 28 ion of PGM.
Table 2.2. The amount of methacrylic anhydride added to PGM and the resulting degree of methacrylation of PGMma polymers.
Following polymerization of PGM, methacrylation was performed as described above to obtain PGMma. To achieve differences in DM, we systematically varied the amount of
methacrylic anhydride added to the reaction. The amount of methacrylic anhydride added and DM of each PGMma polymer determined by 1H NMR spectra (representative image in Figure 2.2. (B)) are summarized in Table 2.2. Low (16%), medium (28%), and high (44%) DM were obtained for PGMma1:1, and low (23%) and medium (28%) DM were obtained for PGMma1:2. A representative FT-IR spectrum of PGMma also confirmed methacrylation with a peak due to vinyl groups at 1596cm1. Average molecular weight and distribution determined using GPC and density measured with a pycnometer are summarized in Table 2.3.
M M Density of Crosslink Molecular
Polymer (x104) I (x1O ) I PDI polymer I density weight between
g mol1 g mol g cm mol m (X103) / g MOli
PGMmaI:1 low DM 1.01 2.58 2.5 1.98±0.02 391 5.06
PGMma1:1 medium DM 0.94 2.05 2.2 1.96±0.06 423 4.64
PGMmaI:1 high DM 0.83 1.87 2.2 1.98±0.08 496 3.99
PGMma1:2 low DM 1.14 2.27 2.0 1.85±0.01 324 5.71
PGMmaI:2 medium DM 0.96 1.99 2.1 2.01±0.04 435 4.61
Table 2.3. Physical properties of PGMma polymers and hydrogels. Crosslink density and molecular weight between crosslinks were calculated for 15% hydrogels.
2.3.2. Characterization of PGMma hydrogels
Physical properties were measured to characterize the resulting PGMma hydrogels. To measure the amount of the soluble fraction, including microgels that could diffuse out of the gel following crosslinking, the sol content of 15% (w/v) hydrogel of all formulations of PGMma polymers and PEGDA4000 was determined as described above. For PGMma1:1 medium DM, the sol content of 10% and 20% (w/v) hydrogels was measured as well. As seen in Figure 2.3. (A), as DM increased, sol content decreased. PGMma1:1 low DM exhibited the highest sol content, 29.6 ± 0.5%, while PGMma1:1 high DM exhibited the lowest sol content, 5.8 ± 1.1%. Sol content of the lowest DM hydrogel (PGMma1:1 low DM) was similar (p<0.05) to that of PEGDA4000. However, the polymer concentration in the hydrogel did not affect the sol content. The difference in sol content for different polymer concentrations in the hydrogel was not
significant (p<0.05) (Figure 2.3. (B)). Hydration by mass of sol-free PGMma hydrogels are summarized in Figure 2.3. (C) and (D). Hydration was also measured for 15% (w/v) hydrogel of every formulation of PGMma, in addition to 10% and 20% (w/v) for PGMma1:1 medium DM. As expected, as DM increased, hydration decreased. Among all the formulations, PGMma1:2 medium DM exhibited the highest hydration, 114.1 + 1.3%, while PGMma1:2 low DM exhibited the lowest hydration, 18.7 ± 0.5%. With respect to the concentration, the 20% hydrogel exhibited higher hydration than the other two concentrations, however, the difference between 15% and 20% hydrogels was not significant (p<0.05).
(B) * N./J II \c~) N
+
81 0 35 30 25 20 15 10 5 0 'V 'V N II -ii (D) X 140 120 100 80 60 40 20 0 N*j PGMma1 :mediumDM -T L S1 20 PGMma1:1 medium DM 10 15 20 Concentration (%)Figure 2.3. Sol content of (A) 15% (w/v) hydrogels of each PGMma formulation compared with PEGDA4000, and (B) PGMma1:1 medium DM hydrogels with different concentrations. Hydration by mass of (C) 15% (w/v) hydrogels of each PGMma formulation compared with PEGDA4000, and (D) PGMma1:1 medium DM hydrogels with different concentrations. (*) indicates significant difference
(p<0.05). (A) 4) 0 C) 35 30 25 20 15 10 5 0 (C) 0 0 -140 120 100 80 60 40 20 0 Nk 0 I
PGMma1:1 high DM 15% (w/v) medium DM low DM (A) 0C 0-7) 0 E E 0 U 0 14 0.12 0.1 0.08 0.06 0.04 0.02 0 300 250 200 150 100 50 020% * m-Hydrogels (B) 0.2 0.18 0 16 014 0.12 0.1 S0.08 S0.06 0.04 0.02 0 70 (D) (U 0 0 U 0 90 80 70 60 50 40 30 20 10 n PGMma1 1 20% medium DM 15% 10% 10 20 30 40 Strain (%) 50 60 *10% .15% 020% ** N4 1 N Hydrogels
Figure 2.4. Stress-strain curve of PGMma1:1 hydrogels (A) 15%(w/v) of each DM, (B) different polymer concentrations (10%, 15%, 20% (w/v)) of medium DM. (C) Compressive modulus of PGMma1:1 and PGMma1:2 hydrogels compared with that of PEGDA4000 hydrogel. (D) Compressive strain at failure of PGMma1:1 and PGMma1:2 hydrogels compared with that of PEGDA4000 hydrogel. (*) indicates significant difference (p<0.05).
To characterize the mechanical properties of PGMma hydrogels, compression analysis was performed using unconfined, uniaxial compression. Figure 2.4. (A) shows representative stress-strain curves of PGMma1:1 15% hydrogels with varying DM (low, medium, high), while panel (B) shows representative stress-strain curves of PGMma1:1 medium DM hydrogel with varying polymer concentration (10%, 15%, 20% (w/v)). Compressive modulus and compressive strain at failure of all formulations of PGMma hydrogels measured are shown in Figure 2.4. (C) and (D) together with those of 15% polymer concentration PEGDA4000 hydrogel for comparison. For both PGMma1:1 and PGMma1:2 with low DM, hydrogels could not be made from 10% polymer solution. Overall, the compressive modulus increased as DM increased or polymer concentration increased. For example, 15% hydrogels of PGMma1:2 low DM exhibited
0 10 20 30 40 50 60
Strain (%)
.10% m15%
*
--a compressive modulus of 1.8 ± 0.4kP--a, while 20% hydrogels of PGMm--a1:2 medium DM exhibited a modulus of 172.7 ± 36kPa. The compressive modulus of both PGMma1:1 high DM and PGMma1:2 medium DM was comparable to that of PEGDA4000. The compressive strain at failure generally decreased as DM increased or polymer concentration increased. However, the difference was not as great as that seen with the compressive modulus. For example, the compressive strain at failure of 15% PGMma1:1 high DM was not significantly different from that of the 20% hydrogel of the same polymer (p<0.05). The compressive strain at failure of PGMma hydrogels ranged from 37.5 ± 0.9% to 61.2 ± 1.1%, which shows PGMma was not as compressible as PEGDA4000, which exhibited compressive strain at failure values ranging from 65.7 ± 6.7% to 79.6 ± 1.6%.
2.3.3. In vitro degradation of PGMma hydrogels
(A) o1:1 lowDM o 1:1 medium DM (B)
120 A1 high DM X1:2 low DM 120 - 10% 015% A20%
o01:2 medium DIM 10 115 A2%
100 100 80 80 060 0 60 (A A (U0 0 40 0 40 A 20 20 0 ao 0 ,0 A 0 20 40 60 80 0 20 40 60 80
Time/ days Time/ days
Figure 2.5. Mass-loss over time of PGMma hydrogels in PBS at 37*C (A) 15% (w/v) of each formulation, (B) PGMma1:1 medium DM.
PGMma hydrogels were hydrolytically degradable in PBS (Figure 2.5). As shown in Figure 2.5. (A), PGMma polymers exhibited a broad range of degradation rates. For example, hydrogels with a low DM dissociated in 3 days, whereas those with high DM showed a much slower degradation rate (at least 80 days). The degradation rates of PGMma1:1 medium DM hydrogels with varying polymer concentrations (10%, 15%, 20% (w/v)) are shown in (B).