HAL Id: hal-01431989
https://hal.archives-ouvertes.fr/hal-01431989
Submitted on 11 Jan 2017
HAL is a multi-disciplinary open access
archive for the deposit and dissemination of
sci-entific research documents, whether they are
pub-lished or not. The documents may come from
teaching and research institutions in France or
abroad, or from public or private research centers.
L’archive ouverte pluridisciplinaire HAL, est
destinée au dépôt et à la diffusion de documents
scientifiques de niveau recherche, publiés ou non,
émanant des établissements d’enseignement et de
recherche français ou étrangers, des laboratoires
publics ou privés.
Origin of a depth-independent drag force induced by
stirring in granular media
François Guillard, Yoël Forterre, Olivier Pouliquen
To cite this version:
François Guillard, Yoël Forterre, Olivier Pouliquen. Origin of a depth-independent drag force induced
by stirring in granular media. Physical Review E : Statistical, Nonlinear, and Soft Matter Physics,
American Physical Society, 2015, 91, pp.22201 - 22201. �10.1103/PhysRevE.91.022201�. �hal-01431989�
Origin of a depth-independent drag force induced by stirring in granular media
Franc¸ois Guillard,*Yo¨el Forterre,†and Olivier Pouliquen‡
Aix-Marseille Universit´e, CNRS, IUSTI UMR 7343, 13453 Marseille, France (Received 3 October 2014; published 2 February 2015)
Experiments have shown that when a horizontal cylinder rotates around the vertical axis in a granular medium, the drag force in the stationary regime becomes independent of the depth, in contradiction with the frictional picture stipulating that the drag should be proportional to the hydrostatic pressure. The goal of this study is to understand the origin of this depth independence of the granular drag. Intensive numerical simulations using the discrete element method are performed giving access to the stress distribution in the packing during the rotation of the cylinder. It is shown that the rotation induces a strong anisotropy in the stress distribution, leading to the formation of arches that screen the hydrostatic pressure in the vicinity of the cylinder and create a bubble of low pressure.
DOI:10.1103/PhysRevE.91.022201 PACS number(s): 45.70.−n, 47.11.Mn, 47.57.Gc, 45.20.da
I. INTRODUCTION
Dragging a plow in soil [1,2], walking or riding on sand [3,4], and mixing grains with a stirrer [5,6] are examples of situations involving the displacement of an object in a granular medium. Understanding the forces exerted on the object and the flow around it are important issues that have been extensively addressed in fluid mechanics when the surrounding fluid is a Newtonian liquid, but these issues remain open in the case of a granular medium. One difficulty comes from the complex rheology of granular media, which belong to the yield stress fluid family. The transition between a static or flowing medium can be expressed using a friction criterion: flow is possible only when the shear stress reaches a critical value, i.e., when the shear stress is equal to the normal stress times a friction coefficient.
When an obstacle moves in a granular medium, a drag force develops, which has been studied in different configurations. The drag force has been measured for partially [2,7–10] or fully immersed [6,11–14] objects pulled in a granular medium, or when an object penetrates a granular medium [15–19]. One major result is that in the quasistatic regime at low speed, the drag can be described by a friction criterion: it is proportional to the average pressure around the object. In the case of an obstacle moving at a depth h in a granular packing, the drag therefore increases linearly with h. This linear dependence has been observed in many studies and is a robust result.
However, a recent study [13] shows that the situation is more complex in a rotating configuration, when the moving object travels again and again in the same path. In this study, the evolution of the drag force is measured on a horizontal cylinder, which rotates in a packing of grains around a vertical axis [Fig.1(a)]. During the first half-turn, the measured drag force increases linearly with the depth at which the cylinder is rotating, as expected from the classical frictional argument. However, after the first half-turn, the drag dramatically drops and reaches a stationary value, which is then independent of the depth. Everything happens as if the rotating cylinder no
*[email protected] †[email protected] ‡[email protected]
longer feels the weight of the column of grains above it. The continuous rotation of the cylinder leads to a pressure screening effect. This effect has been experimentally studied, and a scaling law for the stationary drag has been evidenced. However, the origin of the phenomenon and the existence of a structure in the packing that could induce such a pressure screening effect are still speculative. The purpose of this paper is to study the same geometry using discrete numerical simulations, which give access to the stress distribution within the packing, and to understand the physical origin of the depth-independent drag force.
The numerical method and the difficulties inherent to the three-dimensional configuration are described first. We then check that the simulations correctly reproduce the experimen-tally observed scaling for the drag force. In a second step, the pressure distribution and the stress anisotropy are analyzed, showing that during the rotation, a bubble of low pressure develops around the cylinder, induced by the redirection of the vertical stress through an arching phenomenon.
II. CONFIGURATION AND NUMERICAL METHOD The configuration of interest is shown in Fig. 1(a). A cylinder of diameter D and length L is put at a depth h in a packing of beads of diameter d and density ρg. The cylinder then rotates slowly around the vertical axis z experiencing a torque M. Assuming that each half of the cylinder expe-riences a force Fdrag/2, the drag force is then computed by Fdrag= 4M/L. The experiments in [13] have shown that, in this configuration, the drag force dramatically decreases after half a turn and reaches a stationary value after a few rotations. In this stationary state, the experiments reveal that the drag force is independent of the depth h and is given by the following scaling:
Fdrag≃ DL ρgL f (L/D). (1)
The drag is the product of the surface of the cylinder (DL) times a characteristic pressure (ρgL, ρ being the density of the granular medium) times a coefficient depending on the aspect ratio f (L/D).
To simulate this phenomenon with a discrete element method (DEM), we used the open source softwareLIGGGHTS
GUILLARD, FORTERRE, AND POULIQUEN PHYSICAL REVIEW E 91, 022201 (2015) h 3.3d 130d 50d 20d Fdrag 2 Fdrag 2 (a) 106 107 108 109 E(Pa) 10-7 10-6 10-5 10-4 10-3 τ (s) τ τcol (d) t n F Ft (b) Fn z n t kn kt (c) g
FIG. 1. (Color online) (a) Sketch of the configuration: a cylinder rotates around the vertical axis at a depth h in a granular packing. (b) Sketch of the force interaction used in the DEM simulation: δn
is the normal overlap, δtis the relative tangential displacement since
the beginning of the contact. (c) Contact force model. (d) Value of the time step τ used in the simulation as a function of Young’s modulus E. The dotted line τcol is the theoretical collision time
estimated by the formula τcol= 2.87( 2m
2(1−ν2)2
max(vrel) E2d)1/5[20].
particles, the interaction forces between the particles being described in Figs.1(b)and1(c). For two particles of diameter d and mass m separated by a distance r, the force is zero when r > d. For r < d, one can define the normal overlap δn= d − r and the tangential overlap δt, which is the relative tangential displacement of the particles since the beginning of the contact. The normal part of the force Fnand the tangential part Ftare given by
Fn = knδn+ γnvnrel,
Ft = ktδt+ γtvrelt if |Ft| < µg|Fn| ,
= µg|Fn| otherwise,
(2) in which vrel
n and vtrelare the normal and tangential components of the relative velocity of the particles at the contact point. The constant µg is the friction coefficient, and the parameters kn, kt, γn, and γtare functions of the overlaps δnand δt, and of the Young’s modulus E, the Poisson ratio ν, and the coefficient of restitution e of the beads [22,23]. Their expressions are given in Table I. The particles used in the simulation are monodispersed with diameter d = 1.5 mm and density equal to ρg = 2.5 g cm−3. For the material properties, we choose
a Poisson ratio equal to ν = 0.45, a coefficient of restitution e= 0.6, and a coefficient of friction µg= 0.5. For Young’s modulus E, different values have been used, as it turns out that stiff particles are necessary to reproduce the experimental observation. This point will be discussed later. Values for Young’s modulus are 5 MPa! E ! 1.5 GPa.
A major difficulty to simulate this configuration is the CPU computing time. The geometry is three-dimensional and the phenomenon has to be observed in a large enough container to avoid the Janssen effect, which requires a large number of particles. In our simulations, the height and diameter of the container are, respectively, 130 and 50 particle diameters, which represent a total of 350 000 particles. The intensive computations have been carried out on the parallel computers ofIDRIS.
The typical procedure for a simulation is as follows. Grains are first released from the top in the box under gravity. The box is filled up to the level h. The horizontal cylinder is then placed at this position before finishing the filling procedure up to the top of the container. The cylinder itself is discretized into triangles (32 facets on the perimeter, which makes 832 simulated triangles). The cylinder rotates at a constant angular speed equal to 0.5 rotation per second, which is faster than in the experiments (typically two rotations per minute) but remains in the quasistatic regime, the highest inertial number being of the order of 0.02.
The total simulation lasts approximately 12 s of real time, which corresponds to 20 rotations and is enough to reach the stationary regime. One run takes roughly one week on 32 processors for the highest Young’s modulus. From the simulations, one has access to all the interparticle forces, as well as velocities and positions of all particles. A postprocessing then provides the mean equivalent drag force experienced on the cylinder as well as the stress tensor σ at any location in the packing.
III. DRAG FORCE ON THE CYLINDER
The simulations were first performed with a stiffness E= 5 MPa, a value well below the experimental one but typically used in DEM simulations to minimize the compu-tation time. In many configurations, the use of artificially soft particles seems to have little or no effect on the results and often provides quantitative agreement with experimental measurements [24]. Unfortunately, this is not the case in our configuration. Results of the simulations computed with
TABLE I. Expressions and values of the coefficients in the contact force model used in the simulation. Here β =√ ln(e)
ln2(e)+π2, and m = ρgπ d
3/6 is the mass of each grain. Values are given for
E= 1.5 GPa, ν = 0.45, e = 0.6, and d = 1.5 mm.
Coefficient Particle-particle Value Particle-cylinder Value
expression expression kn/ √ δn= k∗n E 3(1−ν2) √ d 24 × 106N m−32 2E 3(1−ν2) √d/2 34 × 107N m−32 kt/√δn= kt∗ 31−ν2−νkn∗ 26 × 10 6N m−32 31−ν 2−νk∗n 37 × 10 6N m−32 γn/δn1/4 − ! 5 2β " mk∗ n 2.6 kg s−1m− 1 4 −√5β!√2mk∗ n 4.4 kg s−1m− 1 4 γt/δ 1/4 t − ! 5 3β " mk∗ t 2.7 kg s−1m− 1 4 − ! 10 3β !√ 2mk∗ t 4.6 kg s−1m− 1 4 022201-2
E = 5 MPa 1.541 51 61 71 81 0 0.5 1 1.5 2 2.5 3 Number of rotations 0 10 20 30 40 50 60 Fdrag DL ρ gL 1.6 2.1 2.6 3.1 3.6 4.1 First half-rotation h/L
(a)
E = 1.5 GPa 32 42 52 62 78 0 0.5 1 1.5 2 2.5 3 Number of rotations 0 10 20 30 40 50 60 Fdrag DL ρ gL 1.6 2.1 2.6 3.1 3.9 First half-rotation h/L(b)
FIG. 2. (Color online) Drag force as a function of the number of rotations for different depth h: (a) simulations with E = 5 MPa, (b) E = 1.5 GPa.
E= 5 MPa are shown in Fig.2(a), where the dimensionless drag force is plotted as a function of the number of rotations for different depths h of the cylinder.
For each curve, the drag force decreases after half a turn and reaches a stationary value. However, the drag in the stationary state depends on the depth h, which is in qualitative contradiction with the experiments. To understand the origin of this discrepancy, several tests have been performed, by changing the size of the system (the system was perhaps too small), by changing the boundary conditions (use of frictional or frictionless walls), or by adding in the simulation a central vertical rod (which is present in the experiments to hold the cylinder). None of these modifications improved the agreement. It turns out that the source of the discrepancy was the choice of a too low stiffness for the particles. This is shown in Fig.2(b), which gives the results of a series of simulations made in the same condition as in Fig. 2(a) but with Young’s modulus 300 times higher, E = 1.5 GPa. With stiffer particles, the drag force after the first half-turn exhibits a more pronounced decrease, and the stationary values are now identical for the different depths h [Fig.2(b)]. We therefore find in the DEM simulation the same striking observation as in
104 105 106 107 108 E∗ 0 10 20 30 40 50 Fdrag DL ρ gL First half-turn Steady state 106 107 E (Pa)108 109 First half-turn Steady state
FIG. 3. (Color online) Drag force during the first half-rotation (circles) and in the stationary state (squares) as a function of the dimensionless Young’s modulus. h/L = 3.9. Typical Young’s modulus for glass is E ∼ 70 GPa (E∗∼ 2 × 10⁹).
the experiment, i.e., a depth-independent drag on a rotating cylinder. This first result indicates that the drag reduction requires hard enough grains.
To more precisely determine the minimum stiffness nec-essary to obtain an agreement with the experiment, we performed the simulation at a fixed depth h/L = 3.7 but for different Young’s modulus E. Note that increasing the stiffness requires us to reduce the time step to properly solve the interaction between particles [see Fig. 1(d)], thus increasing the simulation time. The influence of E is plotted in Fig.3. The circles represent the drag force averaged over the first half-rotation as a function of the dimensionless Young’s modulus E∗= E/ρggd, whereas the squares represent the drag in the stationary regime. The stiffness has no influence on the initial drag force, but it strongly modifies the value in the stationary regime. The computed drag decreases when increasing E∗and reaches a plateau for E∗>106. This figure thus shows that, in order to find the experimental results, DEM simulations have to be performed with rigid enough particles, i.e., for E∗>106. All the results presented in the following are then performed with a Young’s modulus E = 1.5 × 10⁹Pa (E∗= 4 × 10⁷).
We can now more quantitatively compare the simulations and the experiments for E = 1.5 GPa. Toward that end, new experiments have been done to match as closely as possible the size of the container, the size of the cylinder, and the size of the grains between the experiments and numerical simulations. The comparison is made for cylinders with an aspect ratio L/D = 6 in simulations and L/D = 7.5 in exper-iments, and with a grain size d = 1.5 mm in simulations and d = 1.3 mm in experiments. The container has a diameter of 115d in experiments and 50d in simulations. The glass beads used typically have a Young’s modulus of 70 GPa, a Poisson ratio of 0.25, a restitution coefficient of 0.9, and a friction coefficient of 0.3. Before an experiment, the granular medium is vigorously stirred and slightly compacted by lateral taps on
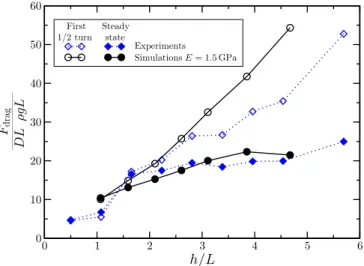
GUILLARD, FORTERRE, AND POULIQUEN PHYSICAL REVIEW E 91, 022201 (2015) Experiments Simulations E = 1.5 GPa 0 1 2 3 4 5 6 h/L 0 10 20 30 40 50 60 Fdrag DL ρ gL Experiments Simulations E = 1.5 GPa First
1/2 turn Steadystate
FIG. 4. (Color online) Drag force as a function of the depth h measured in experiments (diamonds) and simulations (circles), during the first half-turn (open symbols) and in the stationary state (filled symbols).
the container. The cylinder is then plunged at its position and the rotation is started. Figure4shows how the drag force during the first half-turn (open symbols) and during the stationary state (filled symbols) varies with the depth h of the cylinder in both the DEM simulations (circles) and in experiments (square). In this plot, the drag is made dimensionless using DL ρgLand the depth using L, the length of the cylinder. The figure shows a reasonable agreement between experiments and simulations for both the initial and the stationary drag. Using stiff enough particles in the simulations, it is thus possible to quantitatively reproduce the depth-independent drag observed when stirring a granular medium.
IV. DISCUSSION ON THE ORIGIN OF THE DEPTH-INDEPENDENT DRAG FORCE
We can now analyze in the simulations how the stress distributes in the packing, and try to understand the origin of the depth-independent drag phenomenon. Toward that end, the stress tensor σ is calculated at any point using the coarse-graining process proposed by Glasser et al. [25,26]. From the discrete positions xi of all the Np particles and the interparticle forces fij between particles i and j, the stress at a point x is computed by averaging over a sphere of radius R= 2d centered at point x: σ(x) = 1 2 N#p,Np i,j,i̸=j fij ⊗ xij W(xij,x), (3) where xij = xj − xiand W is the fraction of the contact vector xij inside the averaging region [25,26]. The stress tensor is computed on a grid of 10 × 10 × 40 points in the simulation space. To analyze the structure of the stress distribution attached to the cylinder, the stress tensor is then time-averaged in the frame rotating with the cylinder.
From the knowledge of the whole stress tensor, we first analyze the pressure distribution, the pressure P being defined from the trace of the stress tensor P = Tr(σ)/3. Figures5(a)
10 20 30 40 50 60 70 120 60 50 60 70 50 P/ρ gdg (a) 10 20 30 40 20 40 30 40 P/ρ gdg (b) 0.6 0.64 φ (c)
FIG. 5. (Color online) (a) Surfaces of constant pressure in the frame moving with the rotating cylinder during the first half-turn. (b) Same plot in the steady state. Only the central region is shown, the bottom and top disks indicating the actual size of the container. (c) Evolution of the volume fraction φ along the central vertical axis for both the first half-turn (dashed line) and the stationary state (solid line). h/L = 3.9.
and5(b)show the surfaces of constant pressure in the frame moving with the cylinder during the first half-turn [Fig.5(a)] and in the stationary state [Fig. 5(b)]. During the first half-turn, the pressure above the cylinder follows the hydrostatic distribution: it increases linearly with depth. In the vicinity of the cylinder, one observes a region of high (low) pressure at the front (back) of the rotating cylinder. The striking result shown in Fig.5(b)is that after several rotations, the pressure distribution is strongly modified. The level of pressure above the cylinder is much lower than during the first half-turn, and a bubble of low pressure has been created.
To further investigate the pressure distribution in the stationary regime, the variation of the pressure along the central axis Oz is plotted in Fig.6(a). The different curves correspond to simulations performed at different depths h of the cylinder, the position of the cylinder being indicated by a disk. At large depth (for h/L > 2), all the curves present a similar shape. The pressure first increases quasilinearly from the surface in a hydrostatic way, then drops to a minimum before increasing again when reaching the position of the cylinder. Below the cylinder, the pressure keeps increasing and eventually recovers the hydrostatic distribution far from the cylinder.
Two important points should be noted. First, the pressure at the level of the cylinder reaches a plateau when increasing the depth [the disks reach a plateau in Fig.6(a)]. The observation that the drag force becomes independent of the depth is then due to the change of the pressure level around the cylinder, which itself becomes independent of depth. Secondly, the size
↑
↑
↑
↑
↑
↑
0 2 4 6 z/L 0 1 2 3 4 P/ ρ gL h/L = 1.1 h/L = 1.6 h/L = 2.1 h/L = 2.6 h/L = 3.1 h/L = 3.9 h/L = 4.7 zdrop↑
1 2 3 4 5 h/L 0 0.5 1 1.5 (h − zdrop )/L (a) (b)FIG. 6. (Color online) (a) Pressure distribution along the vertical central axis Oz for different depths h of the cylinder. The disks indicate the pressure level at the vertical positions of the cylinders. (b) Scaled size of the low-pressure bubble over the cylinder, defined as the distance between the local minimum of pressure above the cylinder zdropand the position of the cylinder h, as a function of the
scaled depth h/L.
of the low-pressure bubble seems to be roughly constant. This can be seen by plotting the distance between the minimum of pressure and the cylinder for the different depths [Fig.6(b)]. The minimum is at a distance of the order of the length of the cylinder. From this analysis, we conclude that the continuous rotation of the cylinder changes the stress distribution by creating a bubble of low pressure above the cylinder whose extension is of the order of the length of the rotating object. In the stationary regime, regardless of its depth, the cylinder rotates in a region where the pressure is of order ρgL, which explains why the drag force also scales as ρgL [Eq. (1)]. This is also coherent with the experimental observation that the drag starts to saturate when the cylinder reaches a depth of the order of its length (h" L) [13].
To understand how such a low-pressure structure can develop and remain stable in the packing, we first investigate the solid volume fraction φ, looking for some low-density regions. The volume fraction at any point x is computed from the grain position by averaging in a sphere of radius R = 2d around x: φ(x) = 4 m 3π R3ρg Np # i=1 $ W(|xi− x|), (4)
where $W is the fraction of the volume of particle i inside the averaging region. Figure 5(c) shows the profile of the volume fraction along the Oz axis averaged during the first half-rotation and in the stationary state. The two distributions are almost indistinguishable, showing that the volume fraction around the cylinder remains roughly the same during the whole simulation. In particular, there is no evidence of a region of lower volume fraction above the cylinder in the stationary state. Therefore, the observed low-pressure bubble above the
) b ( ) a ( 20 100 90 80 70 60 50 40 30 z/d 20 100 90 80 70 60 50 40 30 z/d 45 0 40 30 20 10 P ρ gdg
FIG. 7. (Color online) Visualisation of the eigendirections of the stress tensor. The principal axes of the ellipsoids coincide with the principal direction of the stress tensor (see text), and their color gives the pressure. (a) First half-turn, (b) steady state.
cylinder cannot be explained by a change in the volume fraction during the rotations.
To go further, we analyze the anisotropy of the stress tensor and the orientation of its principal axes. Toward that end, at each point of the packing an ellipsoid is plotted, whose axes give the orientation of the principal axes of the local stress tensor (Fig.7). The ellipsoid at a point O is computed from the local stress tensor σ as the set of points M such that the vectorOM is equal to
OM = σP· n, (5)
where the unit vector n describes a sphere of radius 1. Using this visualization, the three orthogonal directions of the long, medium, and small axes of the ellipsoids give, respectively, the major, medium, and minor principal directions of the stress tensor. The normalization with the pressure provides ellipsoids of the same mean size, which help in visualizing the variation of the principal directions in the packing. However, in order to get the information about the intensity of the local stress, the ellipsoids in Fig.7are colored according to the pressure value. Figure7(a)shows the structure of the stress tensor averaged during the first half-rotation. In this initial state, the major axes are mainly oriented vertically along the gravity, except close to the end of the rotating cylinder, where the major axes seem to align in the horizontal plane following the direction of rotation. The picture is dramatically different in the stationary state after a few rotations, as shown in Fig.7(b). The main observation is the formation of an archlike structure, with the ellipsoids above the cylinder tilted toward the sides. This change of direction in the major axis of the stress tensor explains why the hydrostatic stress is redistributed away from the cylinder, and that a region of low pressure develops just above the cylinder. At a large depth below the cylinder, the major direction approaches again the vertical. From this analysis, one can then conclude that, as suggested by Guillard et al. [13], the continuous rotation of the cylinder induces an anisotropic structure in the packing, with the formation of arches that screen the hydrostatic pressure.
In a wide container such as in the experiments, the low-pressure central region must be balanced by an overlow-pressure
GUILLARD, FORTERRE, AND POULIQUEN PHYSICAL REVIEW E 91, 022201 (2015)
far away from the rotating cylinder to satisfy the vertical force balance. However, in the simulations, the diameter of the container is only 2.5 times the cylinder length, and part of the stress redistribution is carried by the side walls (typically in the steady state once the bubble is formed, 45% of the total mass of the grains above the cylinder is carried by the walls). Yet it is important to emphasize that side walls are not at the origin of the pressure screening effect: experiments carried out for a large range of container diameter to cylinder length ratio exhibit the same depth-independent drag phenomenon [13].
V. CONCLUSION
In conclusion, we have performed intensive DEM simula-tions of a cylinder rotating in a granular medium. To recover the experimental scaling and the observations that the drag force on the cylinder becomes independent of the depth in the stationary regime, the simulations have to be done with very stiff particles, much stiffer than those classically used in molecular-dynamics simulations. This indicates that the phenomenon exists in the limit of rigid particles, and is weaker with soft particles. Having access to the averaged stress tensor, we have been able to show that the rotation of the cylinder induces a redirection of the principal directions of the stress away from the cylinder, which can be qualified as an arching phenomenon. This anisotropy creates a bubble of low pressure above the cylinder, at a value of the order of ρgL. The cylinder
moves in this low-pressure region, which explains why the drag force is dramatically low and independent of depth. This self-screening effect is reminiscent of what is observed close to the exit of a silo, where a similar pattern for the stress distribution is found [27]. The principal stress axes are redirected away from the outlet, leading to a low-pressure region above the exit and a flow rate that is independent of the depth. An interesting point is that in the case of the silo, the structure arises from a macroscopic mean flow, and the redistribution of the stress can be captured within a continuous description based on a frictional rheology [27,28]. However, modeling the depth-independent drag observed when stirring a granular medium seems more challenging. The difference between the first half-turn and the stationary state means that the structure takes time to form, and that some kind of memory in the texture has to be taken into account, which is not included in the simple continuous description used for the silo.
ACKNOWLEDGMENTS
This work has been supported by the Agence Nationale de la Recherche (ANR) through the program ANR Blanc RSC 08-BLAN-0048-CSD2 and by the Labex MEC ANR-11-LABX-0092 and A*MIDEX ANR-11-IDEX-0001-02. The numerical simulations have been performed using the HPC resources from GENCI-IDRIS (Grand ´Equipement National de Calcul Intensif, Grant 2012-96212).
[1] K. Wieghardt,Annu. Rev. Fluid Mech. 7,89(1975).
[2] B. Percier, S. Manneville, J. N. McElwaine, S. W. Morris, and N. Taberlet,Phys. Rev. E 84,051302(2011).
[3] R. D. Maladen, Y. Ding, C. Li, and D. I. Goldman,Science 325,
314(2009).
[4] C. Li, T. Zhang, and D. I. Goldman,Science (New York, NY)
339,1408(2013).
[5] R. Soller and S. A. Koehler,Phys. Rev. E 74,021305(2006). [6] T. A. Brzinski III and D. J. Durian, Soft Matter 6, 3038
(2010).
[7] R. Albert, M. A. Pfeifer, A.-L. Barab´asi, and P. Schiffer,Phys. Rev. Lett. 82,205(1999).
[8] I. Albert, P. Tegzes, B. Kahng, R. Albert, J. G. Sample, M. Pfeifer, A.-L. Barab´asi, T. Vicsek, and P. Schiffer, Phys. Rev. Lett. 84,5122(2000).
[9] N. Gravish, P. B. Umbanhowar, and D. I. Goldman,Phys. Rev. Lett. 105,128301(2010).
[10] D. J. Costantino, J. Bartell, K. Scheidler, and P. Schiffer,Phys. Rev. E 83,011305(2011).
[11] I. Albert, J. G. Sample, A. J. Morss, S. Rajagopalan, A.-L. Barab´asi, and P. Schiffer, Phys. Rev. E 64, 061303
(2001).
[12] Y. Ding, N. Gravish, and D. I. Goldman,Phys. Rev. Lett. 106,
028001(2011).
[13] F. Guillard, Y. Forterre, and O. Pouliquen,Phys. Rev. Lett. 110,
138303(2013).
[14] F. Guillard, Y. Forterre, and O. Pouliquen, Phys. Fluids 26,
043301(2014).
[15] M. B. Stone, R. Barry, D. P. Bernstein, M. D. Pelc, Y. K. Tsui, and P. Schiffer,Phys. Rev. E 70,041301(2004).
[16] F. Zhou, S. G. Advani, and E. D. Wetzel,Phys. Rev. E 69,061306
(2004).
[17] G. Hill, S. Yeung, and S. Koehler, Europhys. Lett. 72, 137
(2005).
[18] A. Seguin, Y. Bertho, P. Gondret, and J. Crassous,Phys. Rev. Lett. 107,048001(2011).
[19] H. Katsuragi and D. J. Durian,Phys. Rev. E 87,052208(2013). [20] L.D. Landau and E.M. Lifshitz, Theory of Elasticity, Course of
Theoretical Physics Vol. 7 (Pergamon, London, 1959). [21] C. Kloss, C. Goniva, A. Hager, S. Amberger, and S. Pirker,
Progr. Computat. Fluid Dyn. 12,140(2012). [22] H. Hertz, J. Reine Engew. Math. 92, 156 (1882).
[23] P. A. Cundall and O. D. L. Strack,Geotech. 29,47(1979). [24] L. E. Silbert, D. Ertas¸, G. S. Grest, T. C. Halsey, D. Levine, and
S. J. Plimpton,Phys. Rev. E 64,051302(2001).
[25] B. J. Glasser and I. Goldhirsch,Phys. Fluids 13,407(2001). [26] B. Andreotti, Y. Forterre, and O. Pouliquen, Granular Media:
Between Fluid and Solid (Cambridge University Press, Cambridge, 2013).
[27] K. Kamrin,Int. J. Plast. 26,167(2010).
[28] L. Staron, P.-Y. Lagree, and S. Popinet,Phys. Fluids 24,103301
(2012).