HAL Id: hal-00296799
https://hal.archives-ouvertes.fr/hal-00296799
Submitted on 13 Jan 2006
HAL is a multi-disciplinary open access
archive for the deposit and dissemination of
sci-entific research documents, whether they are
pub-lished or not. The documents may come from
teaching and research institutions in France or
abroad, or from public or private research centers.
L’archive ouverte pluridisciplinaire HAL, est
destinée au dépôt et à la diffusion de documents
scientifiques de niveau recherche, publiés ou non,
émanant des établissements d’enseignement et de
recherche français ou étrangers, des laboratoires
publics ou privés.
Exploitation of cloud top characterization from
three-channel IR measurements in a physical PMW rain
retrieval algorithm
F. Torricella, E. Cattani, V. Levizzani
To cite this version:
F. Torricella, E. Cattani, V. Levizzani. Exploitation of cloud top characterization from three-channel
IR measurements in a physical PMW rain retrieval algorithm. Advances in Geosciences, European
Geosciences Union, 2006, 7, pp.19-23. �hal-00296799�
SRef-ID: 1680-7359/adgeo/2006-7-19 European Geosciences Union
© 2006 Author(s). This work is licensed under a Creative Commons License.
Advances in
Geosciences
Exploitation of cloud top characterization from three-channel IR
measurements in a physical PMW rain retrieval algorithm
F. Torricella, E. Cattani, and V. Levizzani
National Research Council, Institute of Atmospheric Sciences and Climate, Bologna, 40129, Italy
Received: 12 November 2005 – Revised: 19 December 2005 – Accepted: 20 December 2005 – Published: 13 January 2006
Abstract. Rainfall intensity estimates by passive microwave
(PMW) measurements from space perform generally better over the sea surface with respect to land, due to the problems in separating true rain signatures from those produced by sur-faces having similar spectral behaviour (e.g. snow, ice, desert and semiarid grounds). The screening procedure aimed at recognizing the various surface types and delimit precipita-tion is based on tests that rely on PMW measurements only and global thresholds. The shortcoming is that the approach tries to discard spurious precipitating features (often detected over the land-sea border) thus leading to no-rain conserva-tive tests and thresholds. The TRMM mission, with its long record of simultaneous data from the Visible and Infrared Radiometer System (VIRS), the TRMM Microwave Imager (TMI) and rain profiles from the Precipitation Radar (PR) al-lows for unambiguous testing of the usefulness of cloud top characterization in rain detection.
An intense precipitation event over the North Africa is analysed exploiting a night microphysical RGB scheme ap-plied to VIRS measurements to classify and characterize the components of the observed scenario and to discriminate the various types of clouds. This classification is compared to the rain intensity maps derived from TMI by means of the Goddard profiling algorithm and to the near-surface rain in-tensities derived from PR. The comparison allows to quantify the difference between the two rain retrievals and to assess the usefulness of RGB analysis in identifying areas of pre-cipitation.
1 Introduction
Rainfall intensity estimates by passive microwave (PMW) measurements from space perform generally better over the sea surface with respect to land, due to the problems in sep-arating true rain signatures from those produced by surfaces Correspondence to: F. Torricella
having similar spectral behavior (e.g., snow, ice, desert and semiarid grounds).
The initial screening procedure of a typical rain retrieval algorithm aimed at recognizing the various surface types and delimiting precipitation is based on tests that rely on PMW measurements only and on global derived thresholds. The shortcoming of this approach is well known: trying to discard spurious precipitating features leads to no-rain conservative tests and thresholds.
The use of other spectral regions to detect and character-ize cloudy (and potentially precipitating) pixel areas can only be discouraged by the unavailability of time-space coinci-dent multi-spectral measurements. The characterization of the cloud field by using time coincident – colocated visible (VIS) and infrared (IR) measurements prior to the applica-tion of the rain intensity retrieval algorithm can improve the selection of probably precipitating pixels.
The Tropical Rainfall Measurement Mission (TRMM) with its long record of coincident VIS, near infrared (NIR) and IR measurements taken by the Visible and Infrared Ra-diometer System (VIRS) and MW observations (from the TRMM Microwave Imager – TMI) complemented by the availability of validation rain data of the precipitation radar (PR) for a subset of observations, optimally allows for testing the usefulness of cloud top characterization in rain detection.
2 The study period
Summer 2002 was characterized by several extreme meteo-rological events in Europe and the Mediterranean area. Let us mention only the well known severe weather event that led to flooding in central Europe, most notably Germany, the Czech Republic and Austria, during the first half of August 2002. The event analyzed in this work took place several days after the central European disaster, on 22 to 29 August, pouring heavy rain in Italy, and causing local floods in Mal-lorca and important floods in Algeria, with tens of casual-ties, hundreds of homeless families, and severe social and
20 F. Torricella et al.: Exploitation of cloud top characterization from three-channel IR measurements
11
F
IGURE1. METEOSAT-7 IR pictures for the study area. The selected slots are the nearest to
the TRMM overpasses shown in Fig. 2, namely, from left to right, 23 August 22:00 UTC; 24
August 00:00 UTC; 24 August 23:00 UTC; 25 August 22:00 UTC.
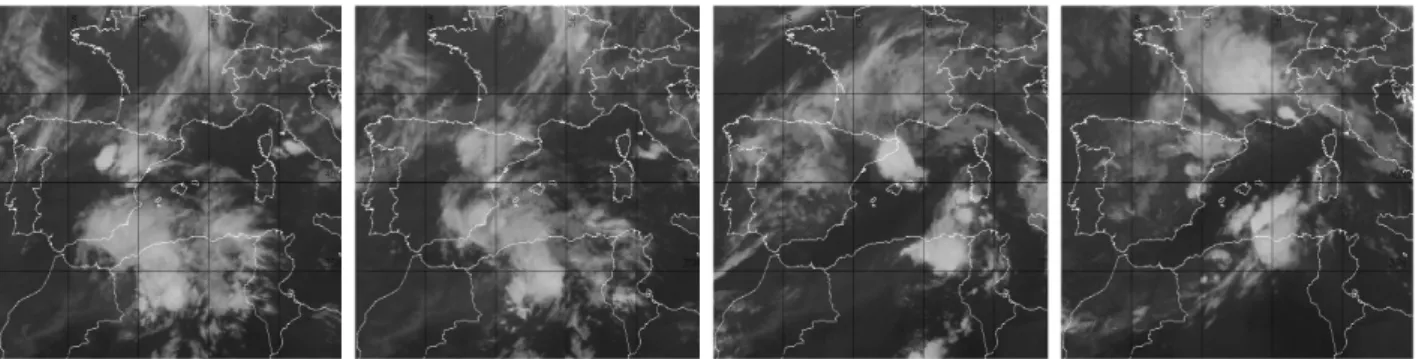
Fig. 1. METEOSAT-7 IR pictures for the study area. The selected slots are the nearest to the TRMM overpasses shown in Fig. 2, namely,
from left to right, 23 August 22:00 UTC; 24 August 00:00 UTC; 24 August 23:00 UTC; 25 August 22:00 UTC.
economical damages. Torrential rains provoked heavy flood-ing in eastern Algeria, killflood-ing at least 10 people. Numerous buildings in the area were partially submerged.
Despite the significant duration of the event, characterized by several peaks of precipitation in different regions of Al-geria, its sampling by TRMM instruments does not allow to properly follow the time evolution of the cloud systems. Moreover, due to the characteristics of the TRMM orbit, the whole western Mediterranean area was imaged only at night-time, preventing a full exploitation of multispectral VIRS measurements.
The analysis of METEOSAT-7 IR images (Fig. 1) helps following the time evolution of the cloud field during one of the rain peaks, on 23, 24 and 25 August, characterized by the presence of strong convective cells over northeastern Spain, notably over Catalonia, Sardinia, central Italy, Balearic Is-lands and the north African coast. The movement during the three days span from northern Morocco to Tunisia with the development of very cold and active convective cells during both day- and nighttime.
3 Rain analysis from TMI and PR
The rain maps for the TRMM overpasses over the area for 23, 24 and 25 August are shown in Fig. 2. They are selected to be centered over Algeria and be characterized by heavy pre-cipitation. All the TRMM passes over the area occurred at nighttime (from 22:30 to 00:30 UTC, local time being ∼300 later) during the three days. The rain intensity is retrieved from TMI measurements by means of the Goddard Profiling Algorithm version 6 (GPROF, Kummerow et al., 2001; Mc-Collum and Ferraro 2003). All the TRMM data and products are obtained from the Distributed Active Archive Center of the Goddard Earth Sciences Data and Information Services Center of National Aeronautics and Space Administration. They are the version 6 reprocessed products 2A25 (precip-itation radar rainfall rate and profile), 2A12 (hydrometeor profile), and 1B01 (calibrated radiance).
The GPROF algorithm calculates instantaneous rainfall rate estimates from the weighted average of rainfall rates
from different vertical hydrometeor profiles created from nu-merical cloud models, primarily the Goddard Cumulus En-semble model. Radiative transfer calculations for the fre-quencies and resolutions of a particular sensor are done to produce a library of vertical profiles with the associated brightness temperatures. The profiles used for estimation are chosen and given weights based on the proximity of the ob-served microwave radiances to those of the library of pro-files. Then, in addition to a surface rainfall estimate, the es-timated profiles can be used to estimate latent heating pro-files for model assimilation. The physical concept of the GPROF algorithm is most effective over oceans, where the low and predictable oceanic emissivity results in informa-tion about ice and liquid hydrometeors over the range of mi-crowave frequencies. On the other hand, the high and vari-able land surface emissivity makes the information from the low frequency channels ambiguous, so that the ice scatter-ing at higher freqencies is currently the most useful way to estimate rainfall over land.
We considered the geographical area 25–40 N and 5 W– 20 E and rain data were re-projected over a 0.1◦×0.1◦ reg-ular lat-lon grid. For each grid point the average rain rate from TMI and PR data were computed. At each grid point, 4 to 5 PR pixels and about 2 TMI pixels contributed to the av-erage rain intensity value. Overall, PR detected 10 878 rainy pixels in the selected geographical area (out of which 1154 classified as convective) and TMI detected 5496 rainy pixels. The scatter-plot in Fig. 3 reports the gridded rain intensity data of the whole event (38 orbits) derived from PR (x-axis) and TMI (y-axis). Depicted in blue are the values for all the rainy grid points (defined as grid mesh where PR detected at least one rainy pixel), and in red the subset of grid points clas-sified by PR as convective (i.e. grid points where more than half PR pixels were classified as convective). The observa-tion of rain maps and the scatter plot leads to the following remarks:
– in the common area of the swaths of the two
instru-ments (widths: 878 km TMI, 247 km PR) TMI detected smaller rain areas than PR;
F. Torricella et al.: Exploitation of cloud top characterization from three-channel IR measurements 21
12
F
IGURE2. Rain intensity maps (surface rain in mm h
-1) retrieved from TMI measurements
(top) and from PR (bottom). Left to right: 23 August 22:50 LT; 24 August 00:27 LT; 24
August 23:40 LT; 25 August 22:50 LT.
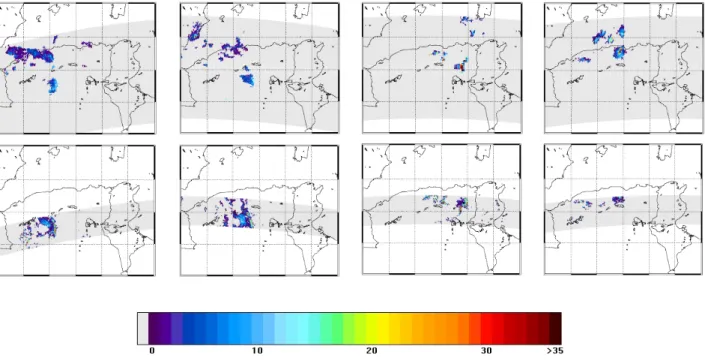
Fig. 2. Rain intensity maps (surface rain in mm h−1)retrieved from TMI measurements (top) and from PR (bottom). Left to right: 23 August 22:50 LT; 24 August 00:27 LT; 24 August 23:40 LT; 25 August 22:50 LT.
– TMI overestimated light to medium rain intensities
(beamfilling effect) and missed many rainy pixels;
– high rain intensities are in general underestimated by
TMI;
– the majority of undetected rain areas (i.e. cases in which
PR detect rain and the TMI algorithm revealed no pre-cipitation) are classified by PR as convective;
– there are undetected rainy areas all over the rain
inten-sity range, from 0 up to 25 mm h−1.
4 Microphysical characterization of the cloud field
The RGB technique is a widely used method (Rosenfeld and Lensky, 1998; Kerkmann et al., 2004) that provides a rela-tively simple rendering of multispectral satellite information for the meteorological scenario interpretation.
The optimum coloring of the RGB image composites rely on the proper selection of the satellite sensor channels and the enhancement of the individual colors. The channel se-lection must be driven by the particular phenomenon (low or high clouds, dust, smoke etc.) to be emphasized in the satel-lite image. At the same time, the proper color enhancement requires the conversion from radiances to brightness temper-atures (IR channels) or reflectances (VIS/NIR channels), se-lection of the display mode (inverted or not inverted), stretch-ing of the dynamic range of the satellite data, and gamma correction.
The TRMM VIRS brightness temperatures at 3.75, 10.8 and 12 µm were used to product RGB images to describe
13 FIGURE 3. Scatter plot of the gridded rain intensity as derived from PR (x axis) and from TMI (y axis). The surface rain intensities derived from the two instruments have been re-projected onto a regular lat-lon grid with resolution 0.1° x 0.1°. Blue symbols: all rainy pixels; red symbols: convective pixels.
Fig. 3. Scatter plot of the gridded rain intensity as derived from PR
(x-axis) and from TMI (y-axis). The surface rain intensities derived from the two instruments have been re-projected onto a regular lat-lon grid with resolution 0.1◦×0.1◦. Blue symbols: all rainy pixels; red symbols: convective pixels.
the characteristics of the convective systems occurred dur-ing the study period. The adopted scheme, so-called night microphysical, was already applied to MSG SEVIRI images (Kerkmann et al., 2004), and is particularly recommended to emphasize the presence of high clouds during the night. Ac-cording to this representation scheme the brightness temper-ature differences between 12 and 10.8 µm [BT(12)–BT(11)] are associated to the red beam with a recommended value
22 F. Torricella et al.: Exploitation of cloud top characterization from three-channel IR measurements
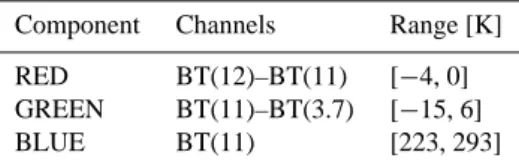
Table 1. Main features of the adopted night microphysical non
in-verted display.
Component Channels Range [K] RED BT(12)–BT(11) [−4, 0] GREEN BT(11)–BT(3.7) [−15, 6] BLUE BT(11) [223, 293]
range from –4 to 0 K. They are sensitive to the cloud opti-cal thickness and are characterized by small values for high cloud optical thickness. The brightness temperature differ-ences between 10.8 and 3.75 µm [BT(11)–BT(3.7)] with its recommended range [−15, 6] K, depend on the cloud opti-cal thickness, phase and particle size and are associated to the green beam in the RGB representation. Small or posi-tive values are observed when an opaque scene (such as thick clouds or the surface) fills the field of view of the sensor. Pos-itive differences occur over extended clouds due to the lower cloud emissivity at 3.75 µm (Ackerman et al., 1998). Finally, the brightness temperatures at 10.8 µm BT(11) in the recom-mended range from 223 to 293 K are a proxy for surface or cloud top temperatures and are represented by blue shades. For the VIRS RGB images the non-inverted display mode was selected, i.e. black corresponds to low signals and white to high signals. Table 1 reports the features of the adopted display scheme.
By using the described approach the maps shown in Fig. 4 have been produced for the four orbits of Fig. 2. Even if this kind of method requires an interpretation of the color shades, which is to some extent subjective and non-quantitative, it is apparent that in this case several categories of targets can be clearly detected in all the orbits, as follows:
– Desert soil in pink, characterized by small values of
BT(12)–BT(11) and small values of BT(11)–BT(3.7), BT(11) ranging from 286 to 291 K.
– Sea surface in blue: BT(12)–BT(11) in the range [−2, −1] K, negative BT(11)–BT(3.7) in the range [−3,−1] K, BT(11)>293 K.
– Overshooting cloud tops in light green: small
val-ues of BT(12)–BT(11)> −1 K, high positive valval-ues of BT(11)–BT(3.7)≥6 K, BT(11)≤223 K.
– Cumulonimbus in orange: small BT(12)–BT(11)≥
−1 K, BT(11)–BT(3.7)< −10 K, BT(11)≤230 K.
– Dissipating cumulonimbus in dark red: BT(12)–BT(11)
in the range [−3,−1] K, high negative values BT(11)– BT(3.7)≤ −15 K, BT(11) in the range [230, 245] K.
– Cirrus in dark blue: BT(12)–BT(11)≤ −2 K, high
neg-ative values of BT(11)–BT(3.7)≤ −15 K, BT(11) be-tween 230 and 260 K.
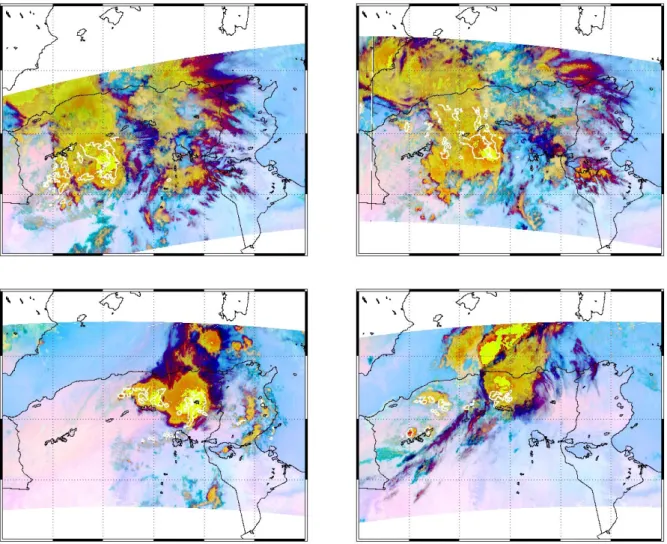
In the RGB maps (Fig. 4) the white contour lines encom-pass areas where PR detected rain with intensity greater than 2 mm h−1. Rainy areas are mainly correlated with light green
shadows, or appear to be near the green spots. In some in-stances, isolated small precipitation areas appear also to be connected with the margins of the cloud field and to be char-acterized by not so bright green shadow.
5 Conclusion and outlook
Rain intensity maps were derived from TMI MW measure-ments by means of the physical GPROF version 6 algorithm. These rain data were compared to the near-surface rain in-tensity retrieved from PR measurements that was considered a reference data set. The swaths of the two instruments are quite different, so that direct comparison is restricted to the narrowest PR swath.
Visual inspection reveals that the main features of the pre-cipitation field are well reproduced in the TMI data, but many small areas of precipitation go undetected, both isolated rainy pixels and areas connected with the border of the main pre-cipitating area.
A systematic comparison conducted for all the 38 orbits during the study period helps in quantifying the differences between the two rain retrievals. Some of these differences can be due to the different resolution of the instruments (re-member that the GPROF algorithm uses the low frequency channels, having ground spatial resolution as coarse as 30 km at 19 GHz, to be compared to the resolution of PR, 4.5 km). Moreover, the screening procedure that selects the possibly raining pixels is affected by well known shortcomings and limitations that often imply an underestimation of the rainy areas.
We analysed data of the co-located VIRS measurement to produce a classification of the components of the scenario and to discriminate the various types of clouds. This kind of analysis is useful for detecting cloudy areas probably associ-ated with precipitation.
Due to the orbital characteristics of TRMM the whole se-vere event was imaged by the instruments only during the night, and this prevented the use of VIS and NIR channels, most useful for quantitative estimates of the cloud top char-acteristics (in terms of optical thickness and effective radius). Nevertheless, the adopted qualitative RGB channel com-bination scheme allowed for some useful comments to be de-rived.
– Thick clouds are clearly delineated by the
green-orange-red areas, while cold but non-precipitating thin clouds are characterized by blue tones.
– The precipitating areas detected by PR (encompassed
by white contour lines in Fig. 4) are mainly connected with the light green color, characteristic of overshooting cloud tops, especially in the areas of maximum precip-itation. Smaller precipitations areas on the downwind
F. Torricella et al.: Exploitation of cloud top characterization from three-channel IR measurements 23
14
F
IGURE4. RGB display scheme results for the orbits of Fig. 2. White contour lines
encompass areas where PR detected a rain intensity greater than 2 mm h
-1.
Fig. 4. RGB display scheme results for the orbits of Fig. 2. White contour lines encompass areas where PR detected a rain intensity greater
than 2 mm h−1.
side of the cells do not strictly correlate with the green shade.
– The rainy areas outside the PR swath, detected by TMI
also correlate with the green shade, but probably TMI does not properly detect rainy areas over the coast (see the area off the Algeria coast on orbit 22:50 on 25 Au-gust).
Acknowledgements. Support from EUMETSAT under contract “A microphysical retrieval package for cloud-aerosol interactions using MSG SEVIRI” is gratefully acknowledged. MSG SEVIRI imagery is provided by the EUMETSAT’s Archive.
Edited by: V. Kotroni and K. Lagouvardos Reviewed by: anonymous referee
References
Ackerman, S. A., Strabala, K. I., Menzel, W. P., Frey, R. A., Moeller, C. C., and Gumley, L. E.: Discriminating clear sky from clouds with MODIS, J. Geophys. Res., 103, 32 141–32 157, 1998.
Kerkmann, J., Lutz, H. J., K¨onig, M., Prieto, J., Pylkko, P., Roesli, H. P., Rosenfeld, D., Schmetz, J., and Zwatz-Meise, V.: MSG channels interpretation guide. Weather, surface conditions and at-mospheric constituents, http://oiswww.eumetsat.org/WEBOPS/ msg interpretation/index.html, 2004.
Kummerow, C., Hong, Y., Olson, W. S., Yang, S., Adler, R. F., McCollum, J. R., Ferraro, R., Petty, G., and Wilheit, T. T.: The evolution of the Goddard Profiling Algorithm (GPROF) for rain-fall estimation from passive microwave sensors, J. Appl. Meteor., 40, 1801–1820, 2001.
Mc Collum, J. R. and Ferraro, R.: Next generation of NOAA/NESDIS TMI, SSM/I, and AMSR-E microwave land rainfall algorithms, J. Geophys. Res., 108(D8), 8382, doi:10.1029/2001JD001512, 2003.
Rosenfeld, D. and Lensky, I. M.: Satellite-based insights into pre-cipitation formation processes in continental and maritime con-vective clouds, Bull. Amer. Meteor. Soc., 79, 2457–2476, 1998.