Design of a Model
Piezoelectric Micro
F
Trans-Alaska
Pipeline for Testing of
'ower
Generator for the
Pipeline System
by
Mike M. Lah
SUBMITTED TO THE DEPARTMENT OF MECHANICAL ENGINEERING IN PARTIAL FULFILLMENT OF THE REQUIREMENTS FOR THE DEGREE OF
BACHELOR OF SCIENCE IN MECHANICAL ENGINEERING AT THE
MASSACHUSETTS INSTITUTE OF TECHNOLOGY MAY 2007
C·3oo
@ 2007 Mike M. Lah. All rights reserved.
The author hereby grants to MIT permission to reproduce and to distribute publicly paper and electronic copies of this thesis document in whole or in
part in any medium now known or hereafter created.
Signature of Author: Certified by: Accepted by: MASSACHUSETTS INSTrTrTE OF TECHNOLOGY JUN 2 12007 LIBRARIES
bepartment of MechamŽal Eineering
May 11, 2007
Sang-Gook Kim
Associate Prosor of Mechanical Engineering sis Supervisor
o3n H. Lienhard V
Pr sor of Mechanical Engineering
Chairman, Undergraduate Thesis Committee lRIi•HfVEs
Design of a Model Pipeline for Testing of
Piezoelectric Micro Power Generator for the
Trans-Alaska Pipeline System
by
Mike M. Lah
Submitted to the Department of Mechanical Engineering on May 11, 2007 in Partial Fulfillment of the
Requirements for the Degree of Bachelor of Science in Engineering as Recommended by the Department of Mechanical Engineering
ABSTRACT
In order to provide a reliable corrosion detection system for the Trans-Alaska Pipeline System (TAPS), a distributed wireless self-powered sensor array is needed to monitor the entire length of the pipeline at all times. Such a sensor faces two primary challenges: a method to provide power for the sensor, and a method to detect corrosion. This project has two goals: to build a model of the TAPS as a test bed for a piezoelectric micro power generator (PMPG), and to use the model to explore corrosion detection methods (perhaps by analyzing changes in the vibration spectrum), for use in the sensor array. To miniaturize the TAPS while maintaining its vibration spectrum, we will specify the dimensions of the model to have the same natural frequency, turbulent flow, and vortex induced vibrations as the
actual pipeline. The model will serve as a test bed for various PMPG designs, and also serve as a starting point for exploring methods to detect corrosion in pipes. The primary vibration mode was found to be due to the natural frequency of the pipe, which was 20.2 Hz for the TAPS. Experimentally, we
found the frequency to be in a range from 12-19 Hz. PMPG devices for use
in the TAPS should be tuned to this frequency range. Thesis Supervisor: Sang-Gook Kim
Table
of Contents
1 INTRODUCTION ... ... 4
2 BACKG RO U N D ... ... 9
2.1 PIEZOELECTRIC DEVICES... ... 9
2.2 M ODELING THE TA PS ... 10
3 DESIGNING THE MODEL PIPELINE ... 12
3.1 NATURAL FREQUENCY CHARACTERISTICS OF TAPS ... 12
3.2 DIMENSIONING THE MODEL PIPELINE ... 14
3.3 REYNOLDS NUMBER CONSIDERATIONS... 15
3.4 VORTEX INDUCED VIBRATION CONSIDERATIONS... 15
3.5 M ODEL PIPELINE DESIGN ... ... 16
4 EXPERIMENTAL METHODS ... 18
4.1 M ODEL PIPELINE SETUP... 18
4.2 MATHEMATICAL ANALYSIS USING FOURIER TRANSFORMS ... 19
5 RESULTS AND ANALYSIS ... 21
6 CONCLUSIONS ... 26
1
Introduction
As technology moves forward, people are able to build larger and more complex structures. From skyscrapers more than a hundred stories high to pipes that travel hundreds of miles, these new enormous structures
introduce new maintenance challenges. Maintenance and inspection by hand is labor intensive and prohibitively expensive, so some sort of electronic sensor array is required. Wired arrays would only introduce a new problem in maintaining the wired connections, so a wireless sensor array is required. However, wireless sensors require portable power, and batteries have a
finite capacity, and would eventually need to be replaced. As the size of the
network grows, simple maintenance like battery replacement becomes very costly, or practically impossible. A device that can generate its own power is required to make a wireless sensor array possible.
One proposed solution currently under research by many groups, including the Micro & Nano Systems Laboratory at MIT, is a piezoelectric
micro power generator (PMPG). Arman Hajati is working with Professor
Sang-Gook Kim on developing a PMPG that will generate parasitic energy from vibration in the environment. With a wireless sensor node that can generate its own electricity via PMPG, a large scale wireless sensor array is possible. One potential application of such a sensor array is the Trans-Alaska Pipeline System.
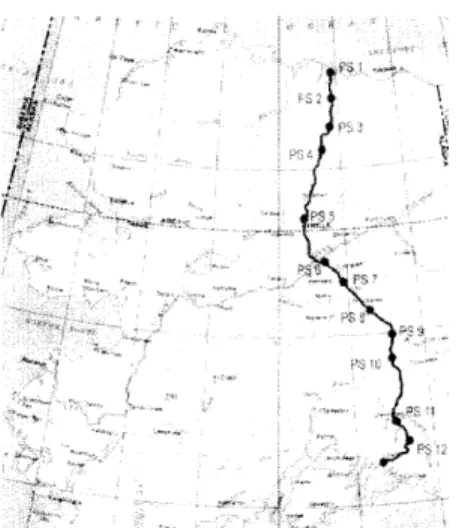
The Trans-Alaska Pipeline System (TAPS) was built in the mid-70s to transfer oil from Prudhoe Bay to the nearest ice-free port, a distance of
nearly 800 miles. Figure 1 shows the path taken by the TAPS through
Alaska.
Figure 1. Map of the Trans-Alaska Pipeline
System' (TAPS). The length and remoteness of the pipeline presents special challenges to the design of inspection and leak prevention systems
The pipeline faces many environmental challenges, including extreme cold and multiple stream, river, and mountain crossings.
Maintenance includes visual inspections and the use of pipeline
inspection gauges ("pigs", used for "pigging"). Pigs are large plugs that are pulled through the pipe for cleaning and gathering information about pipe condition. The edges of the pig clear away sludge and build-up from the interior of the pipe, and "smart pigs" contain ultrasound devices to collect
1 Trans-Alaska Pipeline System. Wikipedia. Retrieved February 7, 2007, from http://en.wikipedia.org/wiki/Trans-Alaska_PipelineSystem
detailed information on the condition of the pipe walls. Figure 2 shows a cutaway view of a pig in a pipe.
Figure 2. A cutaway view ot a pipeline inspection gauge (pig)
in a pipe2. While pigs are effective pipe cleaners, they cannot be used regularly on the entire pipeline
While pigging is an effective tool in detecting corrosion, it is very expensive and many parts of the pipeline are unpiggable, making cleaning and
monitoring impossible for long stretches.
Leaks caused by corrosion can be very small and difficult to detect. A leak in 2006 that some estimate to have spilled over 700,000 gallons
(making it the second worst oil spill in history) was only a quarter inch across. It was discovered not by inspections or pigging, but by a worker who happened to hear the sound, and went to investigate. The terrible result of such a leak is shown in Figure 3.
2 Pipeline inspection gauge. Wikipedia. Retrieved February 7, 2007, from
http://en.wikipedia.org/wiki/Pipeline_Inspection_Gauge
Figure 3. A worker supervises a pump cleaning up oil after a leak went undetected3. Only a relatively small amount of oil is visible; most of the oil is under the surface and soaked into the
snow
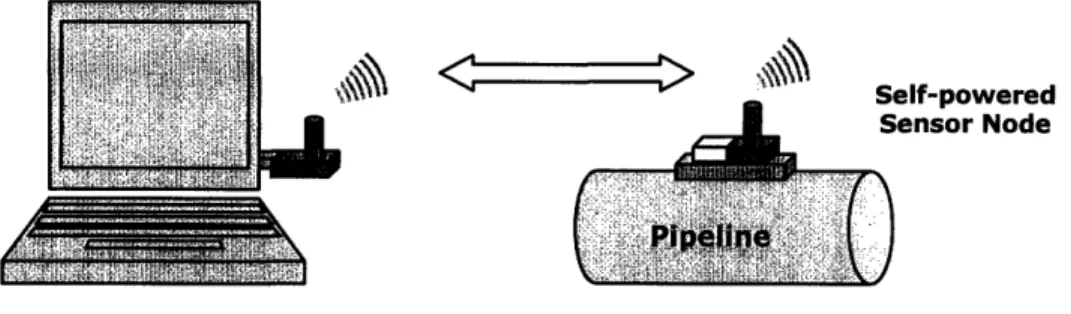
A system of monitoring the entire length of the pipeline at all times is
necessary to prevent further disasters from happening. A proposed solution is a distributed wireless self-powered sensor array that will monitor the entire length of the pipeline at all times, allowing better detection of leaks. The PMPG under research will power the wireless sensor node. A simple
diagram of the proposed sensor is shown in Figure 4.
3 Associated Press (2006, March 6). Alaska pipeline spill amount debated. MSNBC. Retrieved
MW N K "" melf-powered
ensor Node
Base Station
Figure 4. The proposed sensor will sit on the pipe and transmit data wirelessly to a base station4
This project will focus on first building a model pipeline with the same vibration characteristics as the real pipeline as a test bed for the PMPG. Once the PMPG is successfully tested, we will use the model pipeline to explore corrosion detection methods, starting with analyzing the effect of sludge accumulation (a precursor to corrosion) on the vibration spectrum of the pipe.
4 Kim, Sang-Gook. "MEMS Energy Harvesting Device for Self-Powered Wireless Corrosion
2 Background
2.1 Piezoelectric Devices
Piezoelectric materials develop a voltage differential when they undergo strain, and this property is used to generate current in the PMPG. The PMPG is essentially a very small piece of piezoelectric material with a mass at one end to increase the strain in reaction to vibration, as shown in Figure 5. As shown in Figure 6, it can be modeled as a cantilevered beam with a mass at the end.
$-+-+-f+
Figure 5. A simplified model of the Piezoelectric Micro Power Generator5 (PMPG). As the PMPG vibrates, the mass will cause the piezoelectric material
to deflect, generating power
Basic Model
ii
ZSino)t
inot
Figure 6. The cantilever beam and mass model of the PMPG system. The beam models the piezoelectric material, and the mass increases the reaction to vibration6
s Choi, W.J. Jeon, Y., Jeong, J-h, Sood, R. and Kim, S.G. "Energy Harvesting MEMS Device based on thin Film Piezoelectric Cantilevers." Cambridge, MA. MIT.
I I
I I
I I
The system has a specific natural frequency that generates the maximum amount of strain in the beam, and consequently, the maximum amount of power. Therefore to have the most efficient PMPG, we would like to
dimension the PMPG so that its natural frequency is similar to the natural frequency of vibration in the pipeline. To test and improve the design of the
PMPG, we will build a model pipeline that has the same vibration spectrum of the actual TAPS.
2.2 Modeling the TAPS
The vibration spectrum of the pipeline can be modeled as a
combination of three things: natural frequency from the geometry of the pipeline, turbulent flow, and vortex induced vibrations (VIV). We must model each of the three components accurately to create an accurate test bed. The natural frequency is a function of the geometry and material properties of the system. Turbulent flow and vortex induced vibrations are related to the Reynolds number and Strouhal number respectively. The challenge is to balance the accuracy of these factors when modifying properties of the model that affect two or even all three factors.
We predict that the vibration spectrum of the pipe will be dominated by natural frequency effects. The turbulent flow and vortex induced
6 Hajati, Arman. "Analysis and Design of a High Energy Density Piezoelectric Micro Power
vibrations will excite the pipe, causing it to vibrate at the natural frequency. Therefore, it is most important to model the natural frequency accurately, with the turbulent flow and vortex induced vibration as a secondary
consideration.
We have not yet determined how to best detect corrosion in the pipeline. It has been noted that sludge accumulation in the pipe may be a precursor to corrosion. Currently, the best way to detect sludge
accumulation or corrosion is by the use of smart pigs, which use ultrasound to gather information about pipe thickness. We will explore how the
vibration spectrum of the pipe changes as sludge is accumulated in the pipe, and other possibilities for corrosion detection mechanisms.
3 Designing the Model Pipeline
The first step is to complete the analysis on vibration modes in the TAPS and determine the materials and dimensions of a model pipeline that will best fit the natural frequency of the TAPS.
3.1 Natural Frequency Characteristics of TAPS
The TAPS can be modeled as a series of beams simply supported at two ends, as seen in Figure 7 below:
I
I
Figure 7. A simply supported beam with distance I between supports
The natural frequency f, for bending in such a simply supported system is given by Equation 17,
f.xfl E. g (1)
2r w -14
where Kn is a constant of natural frequency, E is the modulus of elasticity, I
is the area moment of inertia, g is the acceleration due to gravity, w is the
7 Young, Warren C. and Richard G. Budynas. Roark's Formulas for Stress and Strain, Seventh ed. New York: McGraw-Hill, 2002.
load per unit length, and I is the length of the beam (in this case, pipe) between supports. The TAPS can be modeled as a simply supported beam,
so the value for K, is 9.87. The area moment of inertia I for a pipe can be
calculated by Equation 2,
I=r(ro 4
- 4) (2)
4
where ro is the outer radius, and r, is the inner radius. The load per unit length w can be calculate by Equation 3,
w= r(ro2 - r2).
p.g
(3)
where p is the density of the material.
The TAPS is made of steel, which determines the physical constants of
E and p. A summary of values for the physical and geometric constants of
the TAPS is given in Table 1 below:
Table 1. Physical and geometric constants of the TAPS used in determining the natural frequency of the pipe
Symbol Description Value
K, Constant (for simply supported beam) 9.87
E Modulus of elasticity for steel 200 GPa
g Gravitational acceleration 9.81 m/s 2
/ Average length of pipe between supports 18.288 m
p Density of steel 7800 kg/m 3
ro Outer radius of pipe .6096 m
ri Inner radius of pipe .5966 m
Using the values in Table 1 with Equations 1, 2, and 3, we calculate the
3.2 Dimensioning the Model Pipeline
We would like the model pipeline to have the same natural frequency as the TAPS. This involves choosing a material and dimensions so that the pipe will vibrate at the same frequency while fitting in the available lab space and keeping costs to a reasonable amount.
We decided on copper as a material because copper tubing is
reasonably priced, readily available, and has a high E to p ratio. If we plug
Equation 3 into Equation 1, we can see that the natural frequency increases
as the E to p ratio increases.
Considering limited lab space and cost, we ran calculations in Mathcad to determine the dimensions of a copper pipe that would have the same
natural frequency as the TAPS while keeping I and ro to a minimum. A shorter length between supports takes up less space, and a smaller pipe costs less. A thinner pipe also has a higher natural frequency for the same length. Table 2 below gives a summary of the dimensions we chose to most closely model the natural frequency of TAPS with copper pipe:
Table 2. Physical and geometric constants of the model used to closely match the natural frequency of TAPS
Symbol Description Value
Kn Constant (for simply supported beam) 9.87
E Modulus of elasticity for copper 130 GPa
g Gravitational acceleration 9.81 m/s 2
/ Average length of pipe between supports 3.691 ft (1.125 m)
p Density of copper 8930 kg/m 3
ro Outer radius of pipe .5" (1.27 cm)
3.3 Reynolds Number Considerations
The Reynolds Number is the ratio of inertial forces to viscous forces in a fluid, and is described by Equation 4,
Re = (4)
where p is the density of the fluid, V is the fluid velocity, D is the diameter of the pipe, and p is the dynamic fluid viscosity. For the TAPS, the Reynolds Number is about 300,000 to 400,000. For our model, using water as a
working fluid and a sprinkler pump, we have p=1 g/cm3, V=41.2 m/s, D=.45
in, and p/=1 Pa.s. The Reynolds Number for our model system is about 4.617 x 10⁹, meaning that the flow in the model system is sufficiently
turbulent. Additional turbulence in the model enables easier measurements of vibration during the experiment.
3.4 Vortex Induced Vibration Considerations
We hypothesized that the vibration spectrum of the pipe will be dominated by natural frequency effects, and that Reynolds Number and Vortex Induced Vibration (VIV) would be secondary considerations. That is, the pipe will be excited by the turbulent flow in the pipe (Reynolds Number and VIV), and vibrate primarily at the frequency dictated by the geometry (natural frequency). Therefore, we have omitted VIV considerations from our model, and predict it will still be sufficiently accurate to test the PMPG.
3.5 Model Pipeline Design
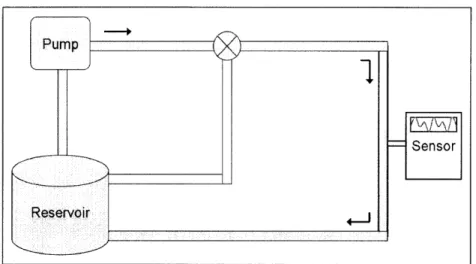
One of the important considerations in the actual setup will be
vibration isolation of the pipe test section from the pump. When the pump is running, it may be difficult to determine what vibrations are from the fluid flow, and what vibrations are due to the pump. Our proposed solution is to decouple the vibration of the pump from the pipe test section by using
flexible tubing throughout the setup. We will also include a bypass loop (controlled with a T-valve) as in Figure 8 below to allow us to run the pump without sending any fluid through the pipe test section. By running the system without sending fluid through the pipe test section, we can measure the vibration spectrum due to the pump vibration, which will hopefully be negligible (Figure 8.1). We can then run the fluid through the pipe test section, measure the vibration spectrum due to fluid flow, and subtract the part of the spectrum due to the pump vibration (Figure 8.2).
Figure 8.1. By running the system through a feedback loop, we can isolate the portion of the vibration spectrum due to the pump vibration
Figure 8.2. When running the system through the pipe test section, we can measure the vibration spectrum due to the fluid flow. Subtracting the vibration spectrum from the previous step isolates the vibration spectrum due
4 Experimental Methods
4.1 Model Pipeline Setup
A picture of the model pipeline setup is shown in Figure 9:
Figure 9: The experimental setup, which follows Figure 8 above. The picture on the left shows the pump, reservoir (gray bin full of water), and valve, with connecting tubes. The
picture on the right shows the pipe test section, and a computer (running Logger Pro) connected to the LabPro module, which is connected to the accelerometer (mounted to the
pipe with green tape).
This closely matches with Figure 8 above. The pump is a Flotec FP5172-08
1.5 horsepower, and the pipe is a 5' long piece of copper pipe with .5" OD and .45" ID. The pipe is supported at two points that section off the
appropriate length, which is easily adjustable for different experiments. The pipe supports are grounded to the bench to eliminate any vibration that might occur between the support and ground. Measurements are taken with a PC running Logger Pro, connected to a Vernier LabPro with a 3-axis
accelerometer. The accelerometer is firmly mounted to the pipe with tape, centered between the supports, where the highest amplitude of deflection is.
Before measurements are made, we first confirm that when the pump is turned off, there is little to no measurable ambient vibration. Then, two measurements are taken. First, when the pump is turned on and water is being diverted back to the reservoir (not through the pipe), there should be little measurable (but probably significant) vibration in the pipe. Second, when the pump is turned on and water is being sent through the pipe, we can measure the vibration spectrum due to the fluid flow in the pipe. By performing some mathematical analysis, we can convert an acceleration over time measurement to a power over frequency distribution. Then we can subtract the first measurement from the second measurement, isolating the vibration due to fluid flow in the pipe.
4.2 Mathematical Analysis using Fourier Transforms
The data we gather from the pipeline will be in the form of a single complex waveform. We are interested in the relative contributions from
individual frequencies, that is, we would like to know which frequencies at which levels compose the vibration spectrum. A Fourier Transform is a
mathematical technique to decompose a function into the individual
relationship between a series of pure notes (the frequency components) and a musical chord (the function itself)8.
The Fourier Series for a function x in terms of a variable t is given by:
x(t) = ao + cos-- nt + b, sin-nt T (5)
T
where T is the period of the function x(t). The function x(t) (the total signal) is equal to a sum of sines and cosines (the individual frequencies we are interested in). The Fast Fourier Transform (FFT) is an optimized algorithm for calculating the Fourier Series quickly. We will use the FFT function included in Mathcad to perform our analysis.
8 Fourier transform. (2007). Retrieved May 11, 2007, from
5 Results and Analysis
We took two measurements, one when pumping the fluid through the feedback loop, and one when pumping the fluid through the pipe. We converted the raw acceleration function using a FFT to get a power over frequency plot that shows which frequencies have the greatest contribution to the frequency spectrum of the pipe.
Figure 10 on the next page shows the data for the tests we ran while
Figure 10. When running the fluid through the feedback loop, there is pipe at 60 and 105 Hz due to the pump vibration
vibration in the
The data shows that when the pump is running and no fluid is flowing through the pipe, there is a small amount of vibration being transmitted from the pump to the pipe through the bench. The frequency of these vibrations is approximately 60 and 105 Hz.
Figure 11 on the next page shows the data for the tests we ran while pumping water through the pipe test section:
Feedback Loop Trial 1 Acceleration Power Spectrum
0.08 0.06 Pi 0.04 0.02 -0 20 40 60 80 100 120 140 160 180 200 i-Af Frequency (Hz)
Feedback Loop Trial 2 Acceleration Power Spectrum
0.1 0.08 0.06 0.04 0 . I I I I I I I I 0.02 0 20 40 60 80 100 120 140 160 180 200 i.Af Frequency (Hz)
Pipe Test Section Trial I Acceleration Power Spectrum
Pi
0 20 40 60 80 i.Af Frequency (Hz)
Pipe Test Section Trial 2 Acceleration Power Spectrum
0.0( 0.0( Pi00 0.00 0 20 40 60 80 i.Af Frequency (Hz) 100 120 140 100 120 140
Figure 11. When running the fluid through the pipe test section, we can ignore the vibration at 60 and 105 Hz, which were found to be due to the pump vibration
With this data, we must first disregard the peaks at 60 and 105 Hz, because those are due to the pump vibration, as found by the previous test. The significant frequencies in the pipe vibration spectrum are around 15, 55, and
120 Hz. The vibration around 120 Hz is in a narrow band and low intensity, so it may not be useful in consideration for a PMPG.
We will take a closer look at the frequency bands around 15 and 55 Hz
in Figure 12:
Pipe Test Section Trial I Pipe Test Section Trial 2
Acceleration Power Spectrum Acceleration Power Spectrum
0.004 - 0.0(14 -iý Pi ig Pi . . . I , . .00, 0 5 10 15 20 25 0 0 5 10 15 20 25 30 i-Af i-Af Frequency (llz) Frequency (Hz)
Pipe Test Section Trial I Pipe Test Section Trial 2
Acceleration Power Spectrum Acceleration Power Spectrum
0.003 - 0.003
-Pi 0.002 - Pi 0.002
-4 45 50 55 60 65 70 410 45 50 55 60 65 70
i-Af i-Af
Frequency (Hz) Frequency (Hz)
Figure 12. A closer look at the two main frequency bands at 15 and 55 Hz. Each band is composed of a range of frequencies
We can see there is a band of frequencies from about 12-19 Hz, and another
band from about 52-60 Hz (keeping in mind that the large spike at 60 Hz is due to pump vibration).
We hypothesize that the lower band is due to the natural frequency of the pipe. The observed frequency could be lower than the predicted
frequency of 20 Hz because of a variety of factors. We could have a modeling error, where the setup is not accurately modeled by a simply
supported system. The pipe could be bouncing on the supports slightly, that
the supports. This would cause unknown effects on the frequency spectrum, which could possibly be the drop in frequency.
The upper band at 52-60 Hz is more difficult to explain. It could come from a tertiary vibration mode in the pipe (three times the natural
frequency), however, there is no significant magnitude of a secondary mode. Further research must be done to determine the source of this vibration.
6 Conclusions
With our model of the TAPS, we have determined that the frequency spectrum of the TAPS is likely dominated by the natural frequency effects,
which causes a majority of the vibrations at 12-19 Hz. We can assert that a
PMPG tuned to resonate in this frequency range can likely generate enough energy to power a wireless sensor for use in the TAPS.
Following successful testing of the PMPG on the model test bed to confirm the feasibility of the PMPG, and if the project is to move forward into development, we recommend a research expedition to Alaska to measure the vibration spectrum first-hand. Such a trip would be useful for two reasons. First, we have observed that the natural frequency of the system can vary significantly from the calculated value due to small variations in the system, and our model is not guaranteed to be accurate. Second, due to these variations, there can be large differences in the natural frequency from section to section (due to changes in the length between supports), so a PMPG that accepts a larger band of frequencies may be necessary.
Our model has provided a starting point for developing a PMPG for use in the TAPS, and with further research, the requirements for such a device will become clearer. Hopefully, this project can move forward towards creating a deployable system that can help maintain the TAPS for generations to come.
7 Works
Cited
Associated Press (2006, March 6). Alaska pipeline spill amount debated.
MSNBC. Retrieved February 7, 2007, from
http://www.msnbc. msn.com/id/11696601/
Choi, W.J. Jeon, Y., Jeong, J-h, Sood, R. and Kim, S.G. "Energy Harvesting MEMS Device based on thin Film Piezoelectric Cantilevers." Cambridge,
MA. MIT.
Fourier transform. (2007). Retrieved May 11, 2007, from
http ://en.wikipedia.org/wiki/Fourier_transform
Hajati, Arman. "Analysis and Design of a High Energy Density Piezoelectric Micro Power Generator." Cambridge, MA. MIT.
Kim, Sang-Gook. "MEMS Energy Harvesting Device for Self-Powered Wireless Corrosion Monitoring Device." Fall 2006. Cambridge, MA. MIT.
Pipeline inspection gauge. Wikipedia. Retrieved February 7, 2007, from http://en.wikipedia.org/wiki/PipelineInspection_Gauge
Trans-Alaska Pipeline System. Wikipedia. Retrieved February 7, 2007, from http://en.wikipedia.org/wiki/Trans-Alaska_Pipeline_System
Young, Warren C. and Richard G. Budynas. Roark's Formulas for Stress and Strain, Seventh ed. New York: McGraw-Hill, 2002.