Title
:
Exchange Membrane Fuel Cell Electrode Assembly
Auteurs:
Authors
:
Vikram Devaraj, Luis Felipe Lopez, Joseph J. Beaman et Serge
Prudhomme
Date: 2015
Type:
Article de revue / Journal articleRéférence:
Citation
:
Devaraj, V., Lopez, L. F., Beaman, J. J. & Prudhomme, S. (2015). Model-Based Control of a Continuous Coating Line for Proton Exchange Membrane Fuel Cell Electrode Assembly. International Journal of Chemical Engineering, 2015. doi:10.1155/2015/572983
Document en libre accès dans PolyPublie
Open Access document in PolyPublieURL de PolyPublie:
PolyPublie URL: https://publications.polymtl.ca/3618/
Version: Version officielle de l'éditeur / Published versionRévisé par les pairs / Refereed Conditions d’utilisation:
Terms of Use: CC BY
Document publié chez l’éditeur officiel
Document issued by the official publisherTitre de la revue:
Journal Title: International Journal of Chemical Engineering (vol. 2015)
Maison d’édition:
Publisher: Hindawi Publishing Corporation
URL officiel:
Official URL: https://doi.org/10.1155/2015/572983
Mention légale:
Legal notice:
Ce fichier a été téléchargé à partir de PolyPublie, le dépôt institutionnel de Polytechnique Montréal
This file has been downloaded from PolyPublie, the institutional repository of Polytechnique Montréal
Research Article
Model-Based Control of a Continuous Coating Line for Proton
Exchange Membrane Fuel Cell Electrode Assembly
Vikram Devaraj,
1Luis Felipe Lopez,
1Joseph J. Beaman,
1and Serge Prudhomme
2 1Department of Mechanical Engineering, University of Texas at Austin, Austin, TX 78712,USA2D´epartement de Math´ematiques et de G´enie Industriel, ´Ecole Polytechnique de Montr´eal, Montr´eal, QC, Canada Correspondence should be addressed to Vikram Devaraj; [email protected]
Received 16 October 2014; Accepted 19 December 2014 Academic Editor: Bhaskar Kulkarni
Copyright © 2015Vikram Devaraj et al. This is an open access article distributed under the Creative Commons Attribution License, which permits unrestricted use, distribution, and reproduction in any medium, provided the original work is properly cited. Themost expensive component of a fuel cell is the membrane electrode assembly (MEA), which consists of an ionomer membrane coated with catalyst material. Best-performing MEAs are currently fabricated by depositing and drying liquid catalyst ink on the membrane; however, this process is limited to individual preparation by hand due to the membrane’s rapid water absorption that leads to shape deformation and coating defects. A continuous coating line can reduce the cost and time needed to fabricate the MEA, incentivizing the commercialization and widespread adoption of fuel cells. A pilot-scale membrane coating line was designed for such a task and is described in this paper. Accurate process control is necessary to prevent manufacturing defects from occurring in the coating line. A linear-quadratic-Gaussian (LQG) controller was developed based on a physics-based model of the coating process to optimally control the temperature and humidity of the drying zones. The process controller was implemented in the pilot-scale coating line proving effective in preventing defects.
1. Introduction
The direct methanol fuel cell (DMFC) is one of the most researched proton exchange membrane (PEM) fuel cell systems. Their low operating temperature and high energy density make them an attractive alternative for the electronic device market [1]. In spite of these advantages the adoption and commercialization of DMFC fuel cells have been slow mainly because of the high manufacturing costs of the membrane electrode assembly (MEA), the most expensive component of direct methanol fuel cells.
Thecatalysts used in the MEA consist of either platinum or platinum alloys, which are historically expensive materials. In addition to the cost of materials, manufacturing of MEAs is still performed with techniques developed for small-scale manufacturing, resulting in high production costs. It would greatly benefit the fuel cell industry if alternative materials and cost-effective defect-free large-scale manufacturing tech-niques were developed for the MEA [2].
In PEM fuel cells, the catalyst layer is very thin (in the order of a few microns thick) and is too delicate to be manufactured separately from other components of the
cell. This layer is usually formulated as liquid ink and can be deposited by a variety of coating techniques. Among these techniques, coating the catalyst layer directly on the PEM exhibits best performance and durability, in addition to having the fewest manufacturing steps. It can be done in a single process per electrode side [3,4].
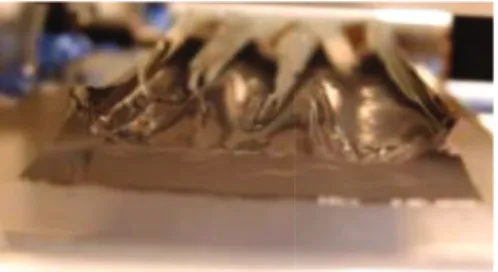
Although direct catalyst coating of PEM is advantageous with respect to performance, it is the most challenging process among existing methods. The most significant issue is the water absorption of Nafion, the most common PEM used in DMFCs. The tendency to absorb water causes the PEM to swell and distort, causing wrinkles when the coating is applied on it.Figure 1shows the wrinkles that are formed when ink is applied directly using a tape-casting process.
Thisswelling tendency is the main challenge in fabrica-tion of MEA by the direct catalyst coating process. Nafion can swell up to 70% larger than its original volume when exposed to moisture. The wrinkles appear when the direct catalyst coated PEM is dried [5]. The wrinkling of Nafion is the single largest reason for coating defects and the major reason preventing large-scale manufacturing, and thus the widespread adoption of fuel cells [6]. It drives the total cost of
Volume 2015, Article ID 572983, 11 pages http://dx.doi.org/10.1155/2015/572983
Figur e 1:Nafion membrane exhibiting distortion upon contact with liquid ink.
the MEA up because of wasted catalyst and membrane, both expensive components in a DMFC, in addition to thwarting the fabrication of larger area fuel cells.
These difficulties in manufacturing have forced the coat-ing of the PEM to be done by hand in small batch processes [7]. Small pieces of the membrane are held down with a vacuum table and the coating is directly sprayed or brushed on. This process is repeated until the desired thickness of the catalyst layer is achieved.
To improve and automate the fabrication of the MEA, it is critical to understand the behavior of the membrane during a typical coating process, which includes exposure to transient, nonuniform water, heat, and mechanical stress conditions [8]. Many investigators have modeled the membrane in a fuel cell operating environment [9–11], but there are fewer models that attempt to model the membrane in a manufacturing environment. Among the existing models, many are steady-state models (not suitable for process control) and most of them ignore the relationship between swelling and the mem-brane’s water content. In addition, water transport within the membrane is often ignored as well [12–14]. Silverman et al. [8] was one of the first researchers that attempted a transient, nonuniform model describing water transport, stress, and swelling in a membrane in a manufacturing environment.
The contribution of this paper is two-fold. First, it describes a pilot-scale continuous coating line for Nafion membranes that was designed for controlled water absorp-tion and desorpabsorp-tion. Humidity and temperature are con-trolled throughout the process to prevent wrinkles. Second, it presents a low-order model of the swelling and drying phe-nomena and its application in a linear-quadratic-Gaussian (LQG) controller to prevent swelling defects. This approach proved effective in preventing wrinkles and holds potentials for application in large-scale manufacturing, as discussed at the end of this article.
2. Pilot-Scale Membrane Coating Line
A pilot-scale coating line was designed to accept rolls of uncoated Nafion, advance them to a preswelling section, to a coating section, and finally to a drying section in a continuous fashion. The motivation for this design was that a significantly lower number of coating defects have been observed when the PEM is preswelled or saturated with water prior to coating [15,16]. Once the membrane is fully saturated with water, it
cannot absorb any more and its water content stays constant. Preswelling by immersion in water is used in this application for rapid diffusion into the membrane.
Themanufacturer’s recommended storage conditions for Nafion are 50% relative humidity at 23∘C. It is desired
that the coated membrane is brought to these temperature and humidity conditions before it is stored [17]. However, if the ambient temperature and humidity were set at the recommended storage conditions, it would require a coating line that would have to be either extremely long or slow.
Previous work concluded that during the drying of the freshly coated saturated membrane the coating rehydrates the membrane, keeping it fully hydrated as long as water is present in coating. Even when using some potentially harsh drying conditions to remove water from the freshly coated membrane, no undesirable effects have been reported in the membrane’s shape as it remains hydrated by the wet coating [8]. This result suggests that it is possible to employ two-stage drying, where a first stage rapidly removes the water from the coating and a second stage that brings the membrane to the recommended storage conditions.
Previous research on two-stage drying has shown that controlling the time spent in a hot/dry zone and the timing of the transition from the hot and dry zone to a second, cooler zone is extremely important. Transitioning too early results in the coating not being completely dry, while transitioning too late would mean that the membrane is over-dried [8].
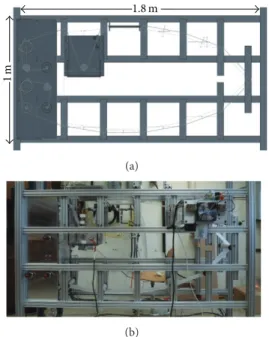
A pilot-scale membrane coating line for producing catalyst-coated membrane in a continuous fashion was designed, constructed, and tested. The pilot plant was designed to accommodate Nafion ionomeric membrane available in 10 cm wide roll form. An overview of the pro-posed pilot scale membrane coating line is shown inFigure 2. It should be noted that the Nafion web moves in a clock-wise direction through the machine. In this machine, both uncoated and coated rolls of Nafion are stored in the left most chamber.
Thismachine has the capability to change independently the unwind and rewind tensions in the web. There is a traction roller that friction-feeds the membrane web and advances it through the machine at a set velocity. The membrane web is supported throughout the machine by aluminum idle rollers. In addition to this, the machine has a preswelling section and seven independent temperature-humidity controllable drying chambers. Although a doctor blade is employed to coat ink, it can be changed to any other method of ink application in future designs. Since this line deals with aqueous swelling and wet coating of ionomeric membranes, most of the critical components were procured and built to withstand prolonged moisture exposure.
2.1. Uncoated and Coated Membrane Storage. Since it is best to store the coated and uncoated Nafion rolls at the recommended storage conditions, it is essential to have a start and end block, that is, temperature and humidity controlled, as shown inFigure 3. This can prevent damage to the roll when left in the machine for extended periods of time. A stand-alone PID controller is used to control
1.8m
1m
(a)
(b)
Figure 2: Overview of the membrane coating machine.
Figure 3: Coated and uncoated membrane roll storage.
the humidity and temperature of the start block. This section has a dedicated heater, humidifier, and supply of dry air to control the temperature and humidity.
2.2. Web Tension and Velocity. Pneumatically actuated expanding chucks secure the rolls of coated and uncoated Nafion. On one side of the storage chamber there are two brushed DC motors mounted on the side that apply opposing torques for the unwind and rewind chucks. These torques translate as tensions in the web during manufacturing. To measure the unwind and rewind tensions in the web during manufacturing, there are two tension transducers (polished rollers inFigure 3). There is another brushed DC motor that is geared to a rubber traction roller for moving the Nafion at a controlled speed. This traction roller is positioned just in
Figur e 4: Two DC motors employed to apply unwind and rewind torques to the chucks. The third motor drives the traction roller.
Figure 5: The preswelling tank.
front of the chuck on which the coated Nafion roll is gripped. Figure 4shows the three DC motors.
2.3. Design of the Preswelling Section. The design of the preswelling section is critical for the performance of the coat-ing line. It is the first location in the process workflow where wrinkles become permanent. The wrinkling model developed by Devaraj [18] was used to set the design parameters of the swelling tank and associated rollers, shown inFigure 5.
In the preswelling section of the machine, a piece of Nafion, equilibrated at 50% RH and 23∘C, is dunked in liquid
water. The membrane immediately changes shape and starts to buckle at the membrane-water-air interface. This elastic buckling propagates along the direction of web motion before vanishing after some distance from the membrane-water-air interface. Idler rollers are used to support the membrane and to manipulate the direction of the web throughout the entire coating process. Buckling due to the sudden swelling will become permanent only after it passes over the idler rollers.
Nafion enters the swelling tank from the top on the leftside and leaves the tank on the right side. There is an idler roller made from polycarbonate that is submerged in water. The formation of permanent wrinkles depends on
the distance between the submerged roller and the roller on the top left, the level of water above the submerged roller, and the force used to pull the web through the preswelling section. Due to space constraints on the machine, the distance between the two rollers was set to 0.32 meters.
Simulation results of the wrinkling model for different water levels in the tank suggest that too little water in the tank will cause permanent deformations at the submerged roller and too much water in the tank may cause permanent deformations at entry roller. This means that the membrane-water-air interface must be at a minimum distance from both the rollers to prevent permanent defects. Based on the simulations that were performed for a 0.32 × 0.1m web, the preferred water height in the tank was defined at 0.19 m above the submerged roller.
2.4. Ink Application. As mentioned before, a doctor blade coating system is used to apply the coating on the membrane. This coating is applied on a flat PTFE-coated glass plate to reduce friction. A peristaltic pump feeds the wet catalyst ink into the doctor blade and helps maintain a uniform head of ink. The ink flow rate may be adjusted with the peristaltic pump depending on doctor blade gate height, coating speed, and so forth.
When Nafion exited the swelling tank, some droplets of water were found to cling onto the membrane’s top and bottom surfaces. This interferes with uniform coating application, so a wiping step was added before coating. A simple absorbency-based pad was used to wipe the surface droplets of water.
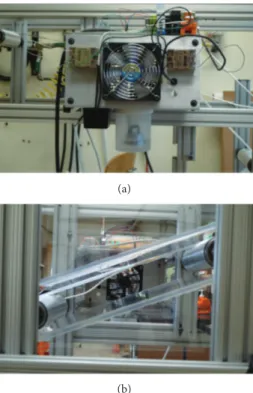
2.5. Humidity and Temperature Controlled Drying Zones. The membrane-coating pilot scale line has seven independently controllable temperature-humidity drying zones. Although in this paper we used only two distinct zones to test the effectiveness of a model-based controller, the seven zones were constructed to accommodate future research.Figure 6 shows a drying zone, viewed from the upstream and down-stream sides.
Each drying zone dries a span of web that is approxi-mately 30 cm long. Each zone forces heated humidified air in the transverse direction and contains an axial blower, a resistive heater, an ultrasonic humidifier, and water reservoir. The temperature and humidity of the eight zones can be controlled independently using PID controllers.
3. Modeling the Membrane
Swelling and Coating
Computational modeling was used to study the physical processes involved in the coating of the MEA and for process optimization. This was made possible by the 3-dimensional multiphysics model developed by Devaraj [18]. The model includes water transport, heat transfer, and solid mechanics in a set of differential equations that are solved for water content in the membrane 𝑚0; temperature 𝑇; and strain
𝜀. The model, although accurate, is not suitable for real-time applications due to its high computational cost and
(a)
(b)
Figur e 6: Upstream (a) and downstream (b) of a temperature-humidity controlled drying zone.
a simplified version of it is required for process control purposes.
3.1.Reduced-Order Membrane Swelling Model. The reduced-order swelling model is a simplified version of the high-fidelity model developed by Devaraj [18]. This model includes only water transport and heat transfer processes. A rectangu-lar piece of membrane with length 𝑙, width 𝑤, and thickness 𝑡 is considered. In this model, 𝑉 is the volume of the membrane and 𝐴 is the surface area over which drying is considered. Thewater content of the membrane, represented by 𝑚0, is defined as the number of moles of water per unit mass of the membrane. The lumped water transport equation for 𝑚0 is
derived as 𝜌02𝜌𝑚 𝜌0+ 𝑀0𝜌𝑚𝑚2 0 d𝑚0 d𝑡 = −𝐴𝑉𝛼𝑐(𝑐0− 𝑐0,eq) , (1) where 𝜌0 is the density of water, 𝜌𝑚 is the dry density of
membrane, 𝑀0is the molar mass of water, and 𝛼𝑐is the mass
transport barrier determined for a concentration driving force [19]. Here, 𝑐0 is the concentration of water calculated
with 𝑐0= 𝑚0𝜌𝑚/1+𝜀Vand 𝜀V= 𝑚0𝑀0𝜌𝑚/𝜌0. The membrane’s
water concentration at equilibrium 𝑐0,eqis obtained from a
thermodynamic model [20].
A reduced-order differential equation describes the evo-lution of the membrane temperature 𝑇 considering heat transfer due to convection and advection, as described by
𝜌𝑐𝑝d𝑇 d𝑡 = −
𝐴
where 𝜌 and 𝑐𝑝refer to the effective density and specific heat
of the membrane, respectively. It should be noted that 𝜌 and 𝑐𝑝 depend on the water content of the membrane. In this equation, ℎ refers to the convection heat transfer coefficient for the membrane’s drying conditions, 𝑇surris the temperature
of the surroundings, and 𝑞stis the heat of sorption obtained from vapor sorption experiments [21].
3.2. Modeling the Coating. A zero-dimensional model was developed for the coating on the membrane assuming that it is applied uniformly and is itself homogenous. As water dries from it, the volume change due to the water lost needs to be considered. The model is defined by the lumped mass-transfer and heat-mass-transfer governing equations. The system is solved for water content, expressed as molality in the coating 𝑚0𝑐and the temperature of the coating 𝑇𝑐.
Thefuel cell coating considered here consists mainly of water with some ionomer, catalyst, and negligible amounts of alcohol. Although some ionomer is present in the coating, that will absorb and hold water, its relative concentration compared to the other components is low and it is ignored in the model. Additionally, since the coating has such a high water content, it is assumed that the membrane remains fully hydrated until all liquid water from the coating is lost. The coating acts like a reservoir of water that can move into the membrane or evaporate into the surrounding air. This assumption is implemented in the shared boundary condition when the membrane swelling and coating models are combined allowing us to piecewise consider, first, the drying of the coating with the membrane remaining saturated and then the drying of the membrane itself.
Since the coating is about 95% water by volume, the volume changes resulting from evaporation are significant and need to be addressed. It should be noted that when coating molality 𝑚0𝑐 goes to zero, the coating is completely dry of liquid water. The lumped water transport governing equation for 𝑚0𝑐is given by
𝜌2 0𝜌𝑠 𝜌0+ 𝑀0𝜌𝑠𝑚20𝑐 d𝑚0𝑐 d𝑡 = − 𝐴𝑐 𝑉𝑐𝛼coat(𝑐0𝑐− 𝑐0𝑐,surr) , (3)
where 𝜌𝑠is the density of the dry coating, 𝐴𝑐is the area over which the drying is considered in the coating, and 𝑉𝑐is the volume of the coating. The parameter 𝛼coatis the mass transfer
coefficient for the coating and 𝑐0𝑐,surr is the surrounding’s
liquid water concentration. The parameter 𝑐0𝑐,surr was set to
zero in the simulations because it is assumed that the water content in the surrounding air is always negligible compared to the amount of water present in the coating. An extra term will be added to the differential equation to account for water transport to the membrane when both systems are studied together.
The water concentration of the coating is defined as 𝑐0𝑐=
𝑚0𝑐𝜌0𝜌𝑠/(𝜌0 + 𝑀0𝑚0𝑐𝜌𝑠). The density of the dry coating is calculated based on the mass and volume of carbon black and Nafion.
The mass transfer coefficient 𝛼coat is assumed to be dependent on temperature and Reynolds number of the moving air that is used for drying the coating. It is obtained
from convection mass transfer correlations [22]. For a cross flow with a turbulent boundary layer, the mass transfer coefficient 𝛼coatcan be modeled as
𝛼coat= 0.037D𝐿 0,air 𝑐 ( 𝐿𝑐V ]𝑎 ) 4/5 ( ]𝑎 D0,air) 1/3 , (4) where D0,air and ]𝑎, respectively, refer to the diffusion
coefficient of water in air and kinematic viscosity of air. All these properties are evaluated at the coating’s temperature. 𝐿𝑐
is the length of the coating in the direction of air flow and V is the air’s free stream velocity.
Convection and advection are the two modes of heat transfer included in the lumped differential equation, where the coating’s temperature is referred to as 𝑇𝑐:
𝜌coat𝑐𝑝,coat𝑉𝑐d𝑇d𝑡𝑐
= −𝐴𝑐[ℎcoat(𝑇𝑐− 𝑇surr) + ℎ𝑓𝑔𝛼coat(𝑐0𝑐− 𝑐0𝑐,surr)] , (5) where 𝜌coatand 𝑐𝑝,coatrefer to the effective density and specific
heat of the coating, respectively. It should be noted that 𝜌coat and 𝑐𝑝,coat depend on the water content of the coating.
ℎcoatrefers to the convection heat transfer coefficient for the
coating, 𝑇surris the temperature of the surroundings, and ℎ𝑓𝑔
refers to the heat of vaporization of water as given in [22]. Determination of the effective density of the coating requires considering the masses and volumes of the dry coating as well as the water present in it 𝜌coat = 𝜌0(𝜌𝑠 +
𝑀0𝑚0𝑐𝜌𝑠)/(𝜌0 + 𝑀0𝑚0𝑐𝜌𝑠). The effective specific heat of coating can be computed with a weighted average of the specific heat of the dry coating and the water.
Theconvection coefficient for heat transfer is calculated as follows [22]: ℎcoat =0.037𝑘𝑎 𝐿𝑐 ( 𝐿𝑐V ]𝑎 ) 4/5 (𝑐𝑝,𝑎𝜇𝑎 𝑘𝑎 ) 1/3 . (6)
3.3. Combining the Membrane Swelling and Coating Drying Models. During the preswelling process the Nafion mem-brane is completely saturated with water or some other solu-tion. This is represented in the model as a set of appropriate initial conditions. In the proposed approach, the problem is simplified by considering only a single sided coating.
As mentioned before, the coating is assumed to be a reservoir of water for the membrane as long as there is water present in it. This means that the membrane stays hydrated as long as the coating is wet and starts to lose water only after all the liquid water has completely dried from the coating. Hence, the model decomposes the membrane coating process into two steps. In the first, it tracks the water content in the coating and in the second, it solves for the water coating in the Nafion membrane, while solving for temperature 𝑇 in both cases. It should be noted that the membrane and coating are assumed to be at the same temperature, which means 𝑇𝑐and
𝑇are one and the same. In other words, the model solves for 𝑚0𝑐and 𝑇𝑐while the coating is still wet and for 𝑚0and 𝑇 as
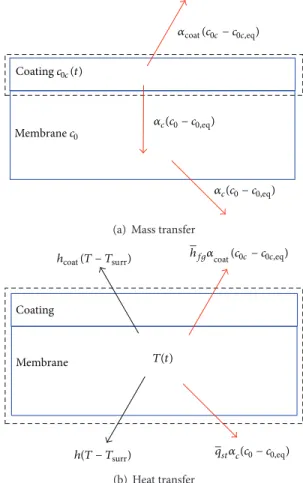
3.3.1.Coating Is Wet. When the coating is wet, two different control volumes are used for the heat and mass transfer analysis. In the case of water transport only the coating is included in the analysis, while for heat transfer both the coating and the membrane are included. The various fluxes used to solve for water content in the coating are shown in Figure 7. The convection mass transfer from the top of the coating is accounted for, and it is considered that water is lost from the saturated Nafion membrane from the bottom. Although water is lost from the bottom surface of Nafion, it is replenished from the coating instantaneously keeping the membrane water concentration constant.
As explained above, the model ignores the variation in the water content of Nafion membrane while the coating is wet, assuming that it remains saturated but account for the water lost from the coating to Nafion membrane while the coating is drying:
𝑉𝑐 𝜌02𝜌𝑠
𝜌𝑠+ 𝑀0𝜌𝑠𝑚0𝑐 d𝑚0𝑐
d𝑡
= −𝐴𝑐[𝛼coat(𝑐0𝑐− 𝑐0𝑐,surr) + 𝛼𝑐(𝑐0− 𝑐0,eq)] .
(7) In the heat transfer equation, a term is added to account for the water lost to the membrane:
𝑉eff𝜌eff𝑐𝑝,effd𝑇d𝑡
= −𝐴eff[2ℎ (𝑇 − 𝑇surr) + ℎ𝑓𝑔𝛼coat(𝑐0𝑐− 𝑐0𝑐,surr)
+𝑞st𝛼𝑐(𝑐0− 𝑐0,eq)] .
(8)
In the above equation, it can be seen that heat loss due to convection is considered from the top of the coating and bottom of the Nafion membrane. The heat loss associated with advection is also considered from the top of the coating and bottom of the membrane. Since the convection heat loss has the same driving force (𝑇 − 𝑇surr)for top and bottom of
the system, it is combined and expressed as 2ℎ. The terms 𝜌effand 𝑐𝑝,effrefer to the coating-membrane system’s density
and specific heat capacity, respectively. It should be noted that convection heat transfer coefficient ℎ is the considered to be identical as the amount of heat lost due to convection is the same from the membrane and the coating due to identical drying conditions.
3.3.2. Coating Is Dry. After the molality of water in the coating 𝑚0𝑐has approached zero, the membrane will begin to
lose water. Hence, the combined equations described in this section solve for 𝑚0and 𝑇. The now dry coating is modeled
to be a porous structure and the water loss through the coating is modeled as diffusion through a porous media (see Figure 8).
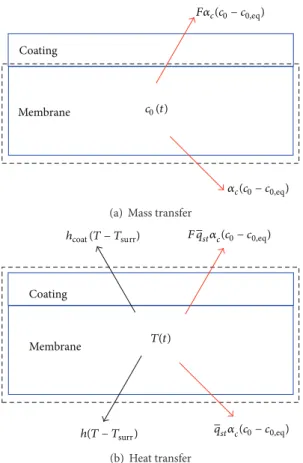
The mass transfer equation that describes the water transport is given by 𝑉 𝜌02𝜌𝑚 𝜌0+ 𝑀0𝜌𝑚𝑚2 0 d𝑚0 d𝑡 = −𝐴 [𝐹𝛼𝑐(𝑐0− 𝑐0,eq) + 𝛼𝑐(𝑐0− 𝑐0,eq)] , (9) Coating c0c(t) 𝛼coat(c0c− c0c,eq) Membrane c0 𝛼c(c0− c0,eq) 𝛼c(c0− c0,eq)
(a) Mass transfer
Coating hfg𝛼coat(c0c− c0c,eq) Membrane qst𝛼c(c0− c0,eq) h(T − Tsurr) T(t) hcoat(T − Tsurr) (b) Heat transfer
Figur e 7: Fluxes used in heat and mass transfer when coating is wet.
where 𝐹 is the effective diffusion coefficient factor defined by 𝐹 = 𝜀𝑡𝛿/𝜏, in which 𝜀𝑡, 𝛿, and 𝜏 are the porosity, constrictivity,
and tortuosity, respectively. It should be noted that these constants can be calculated experimentally for the dry coating and are dimensionless. Values of 𝐹 are necessarily less than 1, and this shows reduced flux due to the presence of porous media between the membrane and air.
Heat transfer is described with 𝜌eff𝑐𝑝,effd𝑇d𝑡 = −𝐴𝑉eff
eff
[2ℎ (𝑇 − 𝑇surr) + 𝐹𝑞st𝛼𝑐(𝑐0− 𝑐0,eq)
+𝑞st𝛼𝑐(𝑐0− 𝑐0,eq)] .
(10) The lumped zero-dimensional model presented in this paper is able to track the water content and temperature of the coating by solving for water molality and coating tem-perature. The zero-dimensional membrane swelling model and the zero-dimensional coating drying model must be combined for use in modeling an MEA manufacturing design and control strategy. Since this model is defined for a fully saturated membrane on which the coating is applied, it can be solved in two steps: the first step that tracks the molality of water in the coating along with the system’s overall temperature that is valid when the coating is still wet and a second step that tracks the Nafion membrane’s molality along
Coating
c0(t)
Membrane
𝛼c(c0− c0,eq)
F𝛼c(c0− c0,eq)
(a) Mass transfer
Coating
Membrane
qst𝛼c(c0− c0,eq)
h(T − Tsurr)
T(t)
hcoat(T − Tsurr) Fqst𝛼c(c0− c0,eq)
(b) Heat transfer
Figur e 8: Fluxes used in heat and mass transfer when coating is dry.
with the system temperature that is valid after the coating has dried.
4. Linear-Quadratic-Gaussian Controller
The model presented in the previous section is far from perfect, and neither will be the measurements taken from the process. A linear-quadratic-Gaussian (LQG) approach, a combination of a Kalman Filter and a linear quadratic regulator (LQR), is chosen for real-time control under uncer-tainties. The model is converted from a Lagrangian reference frame to an Eulerian reference frame, and method of lines is applied to convert the resulting partial differential equations into a set of ordinary differential equations. These differential equations are used to obtain the nominal operating condi-tions, and then these conditions are used to linearize the system. The linearized state-space model is used to design the linear quadratic regulator and Kalman filter.It should be remembered that the modeling of the drying process had been divided into two distinct processes; in the first only the coating’s water content is computed during drying and in the second the water content in the membrane is tracked when the system is brought to storage condi-tions. This two-staged drying is implemented in the control strategy. The region where only the coating loses water is referred to as zone one and the region in which the membrane dehydrates is referred to as zone two. The proposed approach
intents to control the transition between the two zones, so that the transition happens when the coating becomes just dry. A more general description of the process would be given by a moving boundary problem where the transition between the wet coating model to the dry coating model is determined by the physics of the process. In this simplified model, it is assumed that the transition between the models is determined by the dimensions of the machine. Developing the equations necessary to implement control for the two drying zones is discussed; however, the development of the LQG controller is shown only for the first zone and is not repeated for the second zone because of the similarity in procedure.
4.1. Equations for Model-Based Control (Zone 1). The equa-tions presented in the previous section do not account for the movement of the web through the first drying zone. However, the moving web causes a gradient in the water content and the temperature of the membrane along the direction of motion. Inclusion of the material derivative, instead of the temporal one, results in(11). In this model, it is assumed that the only component of the velocity vector is in the direction of the coating line: 𝜌2 0𝜌𝑠 𝜌0+ 𝑀0𝜌𝑠𝑚2 0𝑐 [𝜕𝑚0𝑐 𝜕𝑡 + V𝑥 𝜕𝑚0𝑐 𝜕𝑥 ] = −𝐴𝑐
𝑉𝑐 [𝛼coat(𝑐0𝑐− 𝑐0𝑐,surr1) + 𝛼𝑐(𝑐0− 𝑐0,eq1)] ,
𝜌eff𝑐𝑝,eff[ 𝜕𝑇 𝜕𝑡 + V𝑥 𝜕𝑇 𝜕𝑥] = −𝐴eff 𝑉eff
[2ℎ (𝑇 + 𝑇surr1) + ℎ𝑓𝑔𝛼coat(𝑐0𝑐− 𝑐0𝑐,surr1)
+𝑞st𝛼𝑐(𝑐0− 𝑐0,eq1)] .
(11)
Methods of lines is used to convert the system of partial differential equations to a set of ordinary differential equa-tions. Application of method of lines involves the construc-tion of a numerical soluconstruc-tion for the spatial derivatives, which are discretized while the time variable is left continuous. A finite-difference method is used to divide the control volume into an equispaced grid, and then a first-order backward difference is used for the discretization:
(d𝑚0𝑐 d𝑥 )𝑥=𝑖≈ 𝑚0𝑐|𝑥=𝑖− 𝑚0𝑐|𝑥=𝑖−1 Δ𝑥1 , (d𝑇 d𝑥)𝑥=𝑖≈ 𝑇|𝑥=𝑖− 𝑇|𝑥=𝑖−1 Δ𝑥1 . (12)
In these equations, the subscripts 𝑥 = 𝑖 and 𝑥 = 𝑖 − 1 indicate the position on the grid and Δ𝑥1= 𝑙1/𝑛with 𝑙1being
the grid length and 𝑛 referring to the number of elements used in the discretization of the first drying zone (seeFigure 9).
Web motion direction
x = 1 x = 2 x = 3 x = n − 1 x = n
l1
Figur e 9: Finite difference grid applied to the web in the first drying zone.
When method of lines is implemented, a system of ordinary differential equations is obtained for mass transfer:
𝜌2 0𝜌𝑠 𝜌0+ 𝑀0𝜌𝑠𝑚2 0𝑐 [d𝑚0𝑐|𝑥=𝑖 d𝑡 + V𝑥𝑚0𝑐|𝑥=𝑖Δ𝑥− 𝑚0𝑐|𝑥=𝑖−1 1 ] = −𝐴𝑐
𝑉𝑐 [𝛼coat(𝑐0𝑐𝑥=𝑖− 𝑐0𝑐,surr1) + 𝛼𝑐(𝑐0− 𝑐0,eq1)] ,
𝑖 = 2, 3, . . . , 𝑛. (13)
Similarly, for the heat transfer equations, consider 𝜌eff𝑐𝑝,eff[d𝑇|d𝑡𝑥=𝑖 + V𝑥𝑇|𝑥=𝑖Δ𝑥− 𝑇|𝑥=𝑖−1
1 ]
= −𝐴eff
𝑉eff
[2ℎ (𝑇|𝑥=𝑖+ 𝑇surr1) + ℎ𝑓𝑔𝛼coat(𝑐0𝑐𝑥=𝑖− 𝑐0𝑐,surr1)
+𝑞st𝛼𝑐(𝑐0− 𝑐0,eq1)] , 𝑖 = 2, 3, . . . , 𝑛.
(14) The system of ordinary differential equations describes the dynamics of the molality of the water and the coating temperature of the membrane-coating assembly at the grid points. The equations are coupled and solved together. It should be noted that the values of 𝑚0𝑐|𝑥=1 and 𝑇|𝑥=1 are
required as boundary conditions. These values are deter-mined at the first zone’s entry and are known because they correspond to the ink’s composition and preswelled membrane’s temperature.
By changing 𝑐0𝑐,surr1, 𝑐0,eq1, and 𝑇surr1, the evolution of
the various molalities and temperatures can be modified. This can be achieved by changing the temperature 𝑇surr1and
water activity 𝑎0,surr1of the drying zone. Unfortunately, those
values cannot be modified instantaneously, because of their relatively slow response. As explained before, PID controllers, embedded in LabView, are used to control the heaters and humidifiers that affect the drying zone. However, the set points of the PID controllers can be modified instantaneously and can be used as the line’s inputs in the process controller. Because there will be a lag between a change in the PID set points and the actual change in zone temperature and water activity, it is necessary to model the relationship between the set points and the actual values in the zone.
Web motion direction
l2
x = n + 1 x = n + 2 x = n + 3 x = n + m − 1 x = n + m
Figur e 10: Finite difference grid applied to the web in the second drying zone.
A first-order response is assumed for the drying zone’s temperature and water activity for a change in the respective set points: d𝑎0,surr1 d𝑡 = −𝛼zone1(𝑎0,surr1− 𝑎0,sp1) , d𝑇surr1 d𝑡 = −ℎzone1(𝑇surr1− 𝑇sp1) , (15) where 𝛼zone1 and ℎzone1 denote the mass and heat transfer
coefficients for the first frying zone and are obtained by matching them to fit actual experiments. The zone’s set points are given by 𝑎0,sp1and 𝑇sp1.
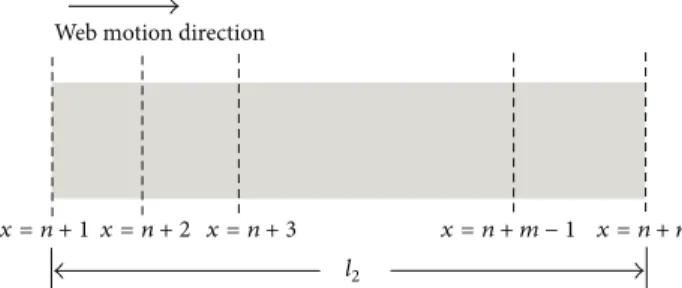
A similar procedure is followed to obtain the differential equations for the second zone:
𝜌2 0𝜌𝑚 𝜌0+ 𝑀0𝜌𝑚𝑚2 0[ d𝑚0|𝑥=𝑖 d𝑡 + V𝑥𝑚0𝑐|𝑥=𝑖Δ𝑥− 𝑚0𝑐|𝑥=𝑖−1 2 ] = −𝐴 𝑉[𝐹𝛼𝑐(𝑐0𝑥=𝑖− 𝑐0,eq2) + 𝛼𝑐(𝑐0𝑥=𝑖− 𝑐0,eq2)] , 𝑖 = 𝑛 + 1, 𝑛 + 2, . . . , 𝑛 + 𝑚, 𝜌eff𝑐𝑝,eff[ d𝑇|𝑥=𝑖 d𝑡 + V𝑥 𝑇|𝑥=𝑖− 𝑇|𝑥=𝑖−1 Δ𝑥2 ] =𝐴eff 𝑉eff [2ℎ (𝑇|𝑥=𝑖− 𝑇surr2) + 𝐹𝑞st𝛼𝑐(𝑐0𝑥=𝑖− 𝑐0,eq2) +𝑞st𝛼𝑐(𝑐0𝑥=𝑖− 𝑐0,eq2)] , 𝑖 = 𝑛 + 1, 𝑛 + 2, . . . , 𝑛 + 𝑚, (16)
where subscript 2 refers to the quantities in the second zone. Thenumbering of the grid points begins at 𝑥 = 𝑛+1 and ends at 𝑥 = 𝑛 + 𝑚. In these equations Δ𝑥2 = 𝑙2/𝑚, where 𝑙2is the
length and 𝑚 is the number of elements in the second drying zone (seeFigure 10).
4.2. Process Controller. The proposed model is able to describe the system based on a state vector x, inputs u, and measurements y, defined as shown in (17). Although the web velocity V𝑥 could be controlled to optimize the use of
Nafion, a fixed velocity of 2 mm/s is used in the pilot-scale line. A 1200 Series laser displacement sensor from Laser-View Technologies was used to measure the total thickness
at the end of the first drying zone. The measurement is used to infer the coating molality 𝑚0𝑐|𝑥=𝑛. An infrared type-T
thermocouple, purchased from Omega, is used to measure 𝑇|𝑥=𝑛. A SHT15 digital temperature and humidity sensor is used to measure the zone’s water activity 𝑎0,surr1 and
temperature 𝑇surr1: x = [ [ [ [ [ [ [ [ [ [ [ [ [ [ 𝑚0𝑐𝑥=2 ... 𝑚0𝑐𝑥=𝑛 𝑇|𝑥=2 ... 𝑇|𝑥=𝑛 𝑎0,surr1 𝑇surr1 ] ] ] ] ] ] ] ] ] ] ] ] ] ] , u = [𝑎0,sp1 𝑇sp1] , y = [ [ [ [ 𝑚0𝑐𝑥=𝑛 𝑇|𝑥=𝑛 𝑎0,surr1 𝑇surr1 ] ] ] ] . (17) In the first zone, the nominal operating conditions were chosen such that the water molality of the coating at the exit 𝑚0𝑐|𝑥=𝑛is just above zero. The coating was applied with
the doctor blade and had an applied wetting thickness of 50 microns. A length of 𝑙1 = 0.62m was determined for the
drying length. The nominal setpoints were defined as 𝑎0,sp1=
0.45 and 𝑇sp1 = 323K. The set of nonlinear differential
equations were linearized about these nominal conditions and then discretized for a constant time step to obtain
𝛿x (𝑘 + 1) = A𝛿x (𝑘) + B𝛿u (𝑘) ,
𝛿y (𝑘) = C𝛿x (𝑘) . (18)
In a scale-up industrial implementation of this model-based control approach, more sensors can be added to improve accuracy. It should be noted that laser thickness measurement sensors have been historically more expensive when compared to thermocouple-based temperature sensors. As a practical consideration, it is recommended to design a system using more inexpensive temperature measurements and less of the more expensive thickness measurements as an indirect method of measuring the molality.
The cost function used in the design of the optimal controller is denoted by J:
J = ∑∞
𝑘=1
𝛿y𝑇(𝑘) Q
𝑟𝛿y (𝑘) + 𝛿u𝑇(𝑘) R𝑟𝛿u (𝑘) . (19)
Theinput that minimizes the cost function is given by
u (𝑘) = u0−K𝑟𝛿x (𝑘) , (20)
in which K𝑟 is the gain matrix. The system is defined as an infinite horizon optimization problem and K𝑟 can be computed offline. In this application, both the output-weighting matrix and the input-output-weighting matrix, Q𝑟and R𝑟, are defined as diagonal matrices.
4.3. Estimator. The LQR has been designed based on the assumption of full state feedback. However, measurements
are limited and they are corrupted with noise. A discrete-time Kalman filter is used to “blend” the predictions from the model and the actual measurements into an optimal estimate of the state variables, denoted by 𝛿̂x.
Inclusion of the process and measurement noise (w(𝑘) and k(𝑘), resp.) in the system equations yields
𝛿x (𝑘 + 1) = A𝛿x (𝑘) + B𝛿u (𝑘) + w (𝑘) ,
𝛿y (𝑘) = C𝛿x (𝑘) + k (𝑘) . (21)
These noise terms are modeled as Gaussian processes that are uncorrelated with each other and in time. Matrices Q𝑘
and R𝑘are known as the state and measurement covariance
matrices, respectively: E [w (𝑘) w (𝑘 + 𝑔)𝑇] = {Q𝑘, if 𝑔 = 0 0, otherwise E [k (𝑘) k (𝑘 + 𝑔)𝑇] = {R𝑘, if 𝑔 = 0 0, otherwise. (22)
The estimate of the state vector 𝛿x(𝑘) using all measure-ments available up to time 𝑘 − 1 is given by 𝛿̂x(𝑘 | 𝑘 − 1). When the new set of measurements y(𝑘) becomes available, the state estimate is updated to 𝛿̂x(𝑘 | 𝑘) using the Kalman gain K𝑘:
𝛿̂x (𝑘 | 𝑘 − 1) = A𝛿̂x (𝑘 − 1 | 𝑘 − 1) + B𝛿u (𝑘) ,
𝛿̂x (𝑘 | 𝑘)
= 𝛿̂x (𝑘 | 𝑘 − 1) + K𝑘[𝛿y (𝑘) − C𝛿̂x (𝑘 | 𝑘 − 1)] .
(23)
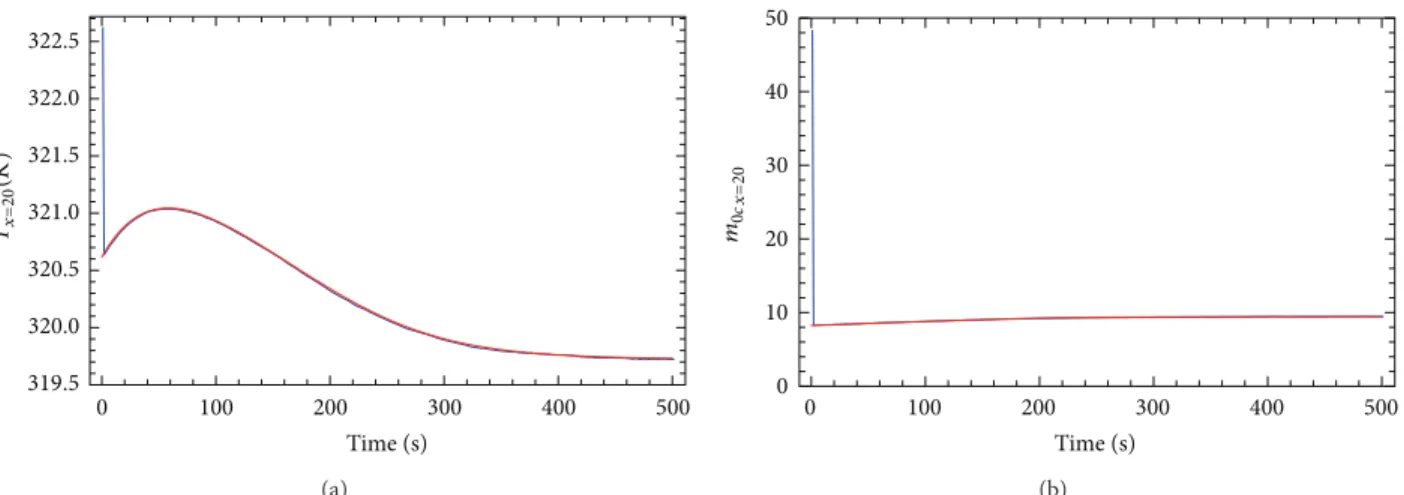
In the sequential estimation problem the Kalman gain needs to be computed at every iteration. These gains are known to converge to a steady state value if the system is observable. In this application a suboptimal approach was followed using the steady state Kalman gain 𝐾 instead of the time-varying one. Simulations show that the proposed controller and estimator are able to drive the system to desired operating conditions, even when uncertainty is present in the system. These simulations were performed using 20 grid points, when the system’s initial condition was deviated from the nominal value, in addition to the estimates displaced from the actual value of the state variables. A plot highlighting the evolution of the some of the states is shown in Figures11and 12.
5. Implementation
Wolfram Mathematica was used to compute the matrices A,
B, C, K𝑟, and K𝑘. However, interaction with the pilot-scale
coating line was achieved through LabView. The performance of the LQG controller was tested in the pilot-scale coating plant by coating and drying long pieces of Nafion at the conditions discussed in the paper. Wrinkle-free coated PEMs were obtained, as shown inFigure 13.
0 100 200 300 400 500 319.5 320.0 320.5 321.0 321.5 322.0 322.5 Time (s) Tx= 20 (K) (a) 0 10 20 30 40 50 0 100 200 300 400 500 Time (s) m0c x= 20 (b) Figur e 11:States (red) and estimates (blue) at the first drying zone’s exit.
0 100 200 300 400 500 Time (s) Tx= 10 (K) 303.5 304.0 304.5 305.0 305.5 (a) 0 100 200 300 400 500 Time (s) 90 91 92 93 m0c x= 10 (b) Figur e 12:States (red) and estimates (blue) at the first drying zone’s mid point.
Figur e 13: Photograph showing nonideal coating of Nafion (left) next to drying controlled by a model-based LQG (right).
6. Conclusions
Theultimate aim of this work was to develop an automated, continuous, and low-cost MEA fabrication process for PEM fuel cells. A roll-to-roll membrane coating process was selected for its ability to make the entire process continuous. The ionomeric polymer membrane, a key component of a PEM fuel cell, has been shown to rapidly absorb water from
the liquid ink during direct coating. This rapid absorption of water results in swelling that deforms the membrane which in turn causes wrinkling manufacturing defects. This paper hypothesized that a model-based optimal control strategy would be beneficial to the MEA fabrication result-ing in reducresult-ing the number of manufacturresult-ing defects. The controller was implemented in the pilot machine showing promising results and strongly suggesting further develop-ment of this method.
While this work was primarily focused on application to Nafion due to its current commercial popularity, other ionomeric polymer membranes are available and the perfor-mance of these other ionomeric membranes in this process is currently unknown and should be investigated. For cost considerations, the coating formulations used to test this process did not contain any catalyst and future research should be done to test the validity of the presented models with actual catalyst containing ink.
Also, in the optimal control strategy that was imple-mented, only the drying zone’s water activity and temperature were controlled. Controlling additional variables including line speed and web tensions may yield additional flexibility and benefit when scaling up this process for industry.
Finally, the proposed process control strategy can be used in conjunction with statistical process control techniques. Statistical process control can be used to determine the likelihood of defect-free membranes based on admissible error bands for process parameters. The combination of both approaches would potentially eliminate the need for postproduction quality control.
Conflict of Interests
The authors declare that there is no conflict of interests regarding the publication of this paper.
Acknowledgment
The authors gratefully acknowledge funding for this work from the Office of Naval Research (ONR) through MURI grant no. N00014-07-1-0758.
References
[1] K. Joon, “Fuel cells—a 21st century power system,” Journal of Power Sources, vol. 71, no. 1-2, pp. 12–18, 1998.
[2] V. Mehta and J. S. Cooper, “Review and analysis of PEM fuel cell design and manufacturing,” Journal of Power Sources, vol. 114, no. 1, pp. 32–53, 2003.
[3] A. Lindermeir, G. Rosenthal, U. Kunz, and U. Hoffmann, “On the question of MEA preparation for DMFCs,” Journal of Power Sources, vol. 129, no. 2, pp. 180–187, 2004.
[4] Q. Mao, G. Sun, S. Wang et al., “Comparative studies of configurations and preparation methods for direct methanol fuel cell electrodes,” Electrochimica Acta, vol. 52, no. 24, pp. 6763–6770, 2007.
[5] B. P. Ladewig, R. B. Knott, A. J. Hill et al., “Physical and elec-trochemical characterization of nanocomposite membranes of nafion and functionalized silicon oxide,” Chemistry of Materials, vol. 19, no. 9, pp. 2372–2381, 2007.
[6] B. M. Koraishy, Continuous manufacturing of direct methanol fuel cell membrane electrode assemblies [Ph.D. thesis], The University of Texas at Austin, Austin, Tex, USA, 2010. [7] H. Tsuchiya and O. Kobayashi, “Mass production cost of PEM
fuel cell by learning curve,” International Journal of Hydrogen Energy, vol. 29, no. 10, pp. 985–990, 2004.
[8] T. J. Silverman, J. P. Meyers, and J. J. Beaman, “Dynamic thermal, transport and mechanical model of fuel cell membrane swelling,” Fuel Cells, vol. 11,no. 6, pp. 875–887, 2011.
[9] Z. Liu, Z. Mao, and C. Wang, “A two dimensional partial flooding model for PEMFC,” Journal of Power Sources, vol. 158, no. 2, pp. 1229–1239, 2006.
[10] T. E. Springer, T. A. Zawodzinski, and S. Gottesfeld, “Polymer electrolyte fuel cell model,” Journal of the Electrochemical Society, vol. 138, no. 8, pp. 2334–2342, 1991.
[11] S. J. Paddison and K. S. Promislow, Eds., Device and Materials Modeling in PEM Fuel Cells, vol. 113of Topics in Applied Physics, Springer, 2009.
[12] D.-C. Huang, P.-J. Yu, F.-J. Liu et al., “Effect of dispersion solvent in catalyst ink on proton exchange membrane fuel cell performance,” International Journal of Electrochemical Science, vol. 6, no. 7, pp. 2551–2565, 2011.
[13] R. Solasi, Y. Zou, X. Huang, K. Reifsnider, and D. Condit, “On mechanical behavior and in-plane modeling of constrained PEM fuel cell membranes subjected to hydration and tempera-ture cycles,” Journal of Power Sources, vol. 167, no. 2, pp. 366–377, 2007.
[14] R. Solasi, Y. Zou, X. Huang, and K. Reifsnider, “A time and hydration dependent viscoplastic model for polyelectrolyte membranes in fuel cells,” Mechanics of Time-Dependent Mate-rials, vol. 12, no. 1, pp. 15–30, 2008.
[15] I.-S. Park, W. Li, and A. Manthiram, “Fabrication of catalyst-coated membrane-electrode assemblies by doctor blade method and their performance in fuel cells,” Journal of Power Sources, vol. 195, no. 20, pp. 7078–7082, 2010.
[16] C. H. Hsu and C. C. Wan, “An innovative process for PEMFC electrodes using the expansion of Nafion film,” Journal of Power Sources, vol. 115, no. 2, pp. 268–273, 2003.
[17] DuPont, “Product information: Dupont nafion pfs membranes,” 2004.
[18] V. Devaraj, Modeling, design, development, and control of a pilot-scale continuous coating line for proton exchange membrane fuel cell electrode assembly [Ph.D. thesis], University of Texas at Austin, Austin, Tex, USA, 2012.
[19] M. B. Satterfleld and J. B. Benziger, “Non-Fickian water vapor sorption dynamics by nafion membranes,” The Journal of Physical Chemistry B, vol. 112, no. 12, pp. 3693–3704, 2008. [20] J. P. Meyers and J. Newman, “Simulation of the direct methanol
fuel cell: II. Modeling and data analysis of transport and kinetic phenomena,” Journal of the Electrochemical Society, vol. 149, no. 6, pp. A718–A728, 2002.
[21] D. J. Burnett, A. R. Garcia, and F. Thielmann, “Measuring moisture sorption and diffusion kinetics on proton exchange membranes using a gravimetric vapor sorption apparatus,” Journal of Power Sources, vol. 160, no. 1, pp. 426–430, 2006. [22] T. L. Bergman, A. S. Lavine, F. P. Incropera, and D. P. DeWitt,
Fundamentals of Heat and Mass Transfer, Wiley, 7th edition, 2011.
International Journal of
Aerospace
Engineering
Hindawi Publishing Corporationhttp://www.hindawi.com Volume 2014
Robotics
Journal ofHindawi Publishing Corporation
http://www.hindawi.com Volume 2014
Hindawi Publishing Corporation
http://www.hindawi.com Volume 2014
Active and Passive Electronic Components
Control Science and Engineering Journal of
Hindawi Publishing Corporation
http://www.hindawi.com Volume 2014
Hindawi Publishing Corporation
http://www.hindawi.com Volume 2014
Hindawi Publishing Corporation http://www.hindawi.com
Journal of
Engineering
Volume 2014
Submit your manuscripts at
http://www.hindawi.com
VLSI Design
Hindawi Publishing Corporation
http://www.hindawi.com Volume 2014
Hindawi Publishing Corporation
http://www.hindawi.com Volume 2014
Shock and Vibration
Hindawi Publishing Corporation
http://www.hindawi.com Volume 2014
Civil Engineering
Advances inAcoustics and VibrationAdvances in
Hindawi Publishing Corporation
http://www.hindawi.com Volume 2014
Hindawi Publishing Corporation
http://www.hindawi.com Volume 2014 Electrical and Computer Engineering
Journal of
Advances in OptoElectronics
Hindawi Publishing Corporation
http://www.hindawi.com Volume 2014
The Scientific
World Journal
Hindawi Publishing Corporation
http://www.hindawi.com Volume 2014
Sensors
Journal of Hindawi Publishing Corporationhttp://www.hindawi.com Volume 2014
Modelling & Simulation in Engineering
Hindawi Publishing Corporation
http://www.hindawi.com Volume 2014
Hindawi Publishing Corporation
http://www.hindawi.com Volume 2014 Chemical Engineering
International Journal of Antennas and Propagation
International Journal of
Hindawi Publishing Corporation
http://www.hindawi.com Volume 2014
Hindawi Publishing Corporation
http://www.hindawi.com Volume 2014
Navigation and Observation
International Journal of
Hindawi Publishing Corporation
http://www.hindawi.com Volume 2014