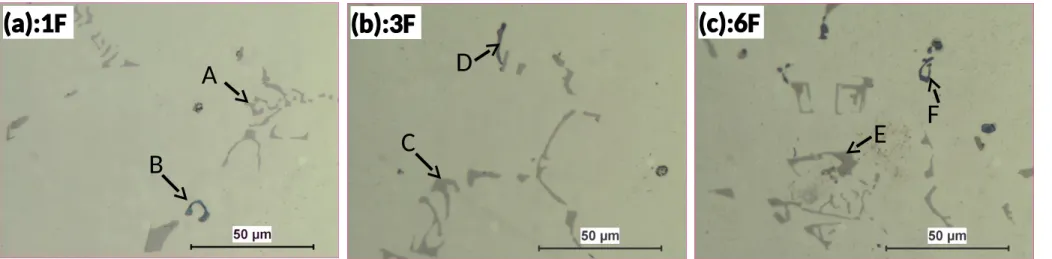
Figure 1 As-cast microstructures of experimental alloys
(a):1F (b):3F (c):6F
A
B C
D
E F
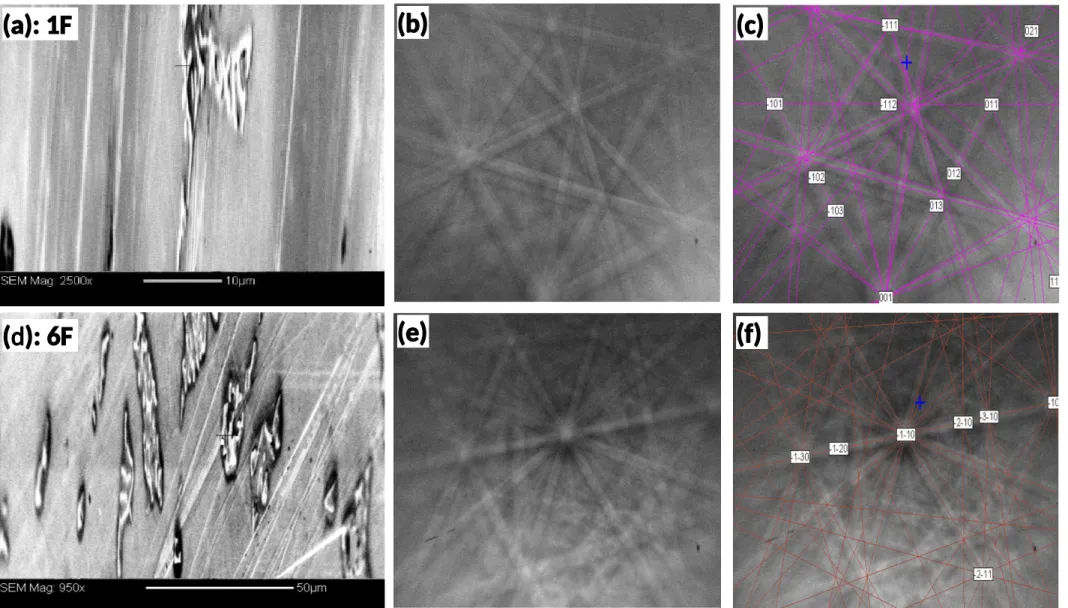
Figure 2 - Intermetallics, EBSD patterns and simulated results for Alloys 1F and 6F:
(a), (b) and (c) is for α-Al(MnFe)Si from Alloy 1F ( MAD = 0.205); and (d), (e) and (f) is for Al6(MnFe) from Alloy 6F ( MAD = 0.347)
(a): 1F
(e) (f) (b) (c)
d ( ): 6F
Figure 3 – SEM backscatter images (a and c) and element mapping for Si distribution (b and d) in intermetallics in Alloys 1F and 6F
(b):1F-Si
d
( ):6F-Si (a):1F
(c):6F
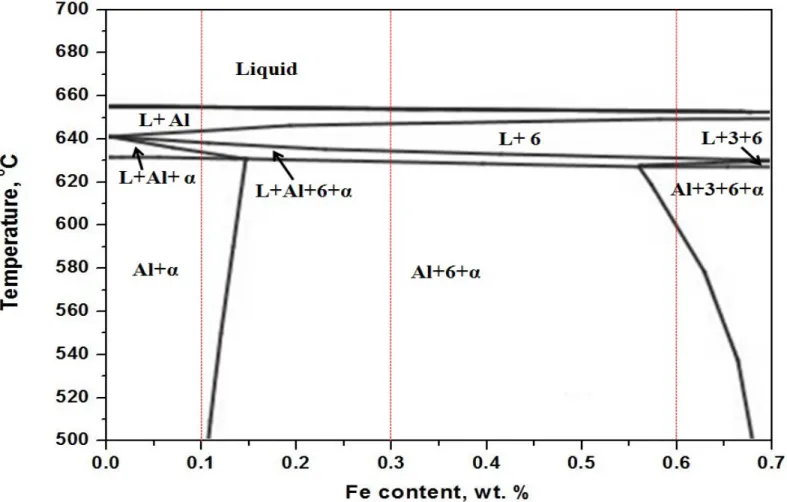
Figure 4 - Simulated Al-Mn-Mg-Fe-Si phase diagram using Thermo-Calc:
L-Liquid; α-Al15(MnFe)3Si2; 6-Al6(MnFe); 3-Al3(MnFe)
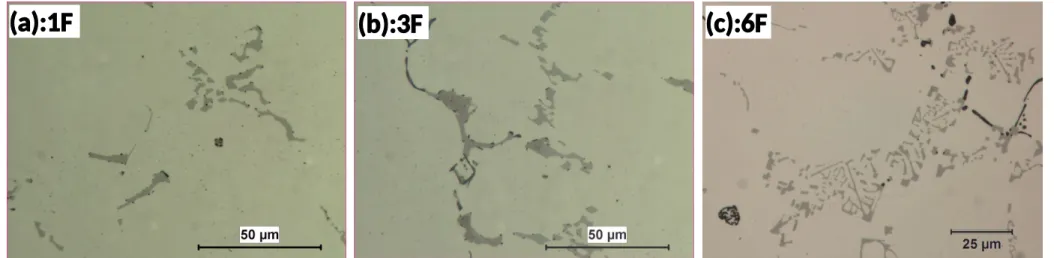
Figure 5 - Microstructures of experimental alloys after 648K (375°C)/48 h (before etched)
(a):1F (b):3F (c):6F
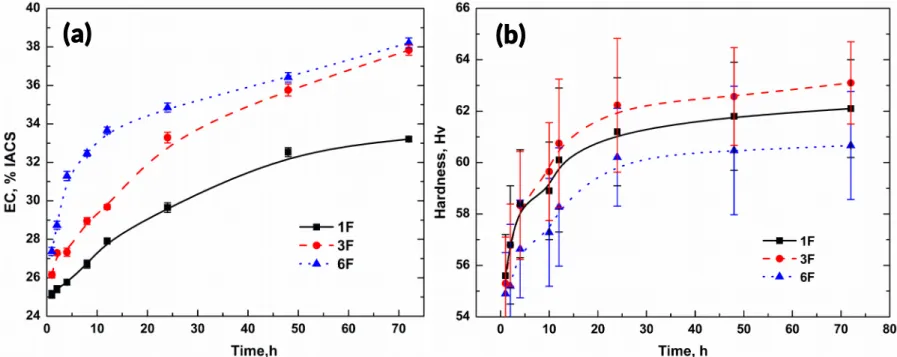
Figure 6 - Evolution of EC (a) and microhardness (b) during the precipitation treatment
(a) (b)
Figure 7 - Microstructure of experimental alloys after 648K (375°C)/48h (after etched)
(a):1F (b):3F (c):6F
PFZ PFZ
PFZ r d
Dispe soi s
r d Dispe soi s
r d
Dispe soi s
Figure 8 - TEM images of dispersoids in experimental alloys after 648K (375°C)/48h
(a): 1F (b):3F (c):6F
μ 0.5 m μ
0.5 m 0.5 mμ
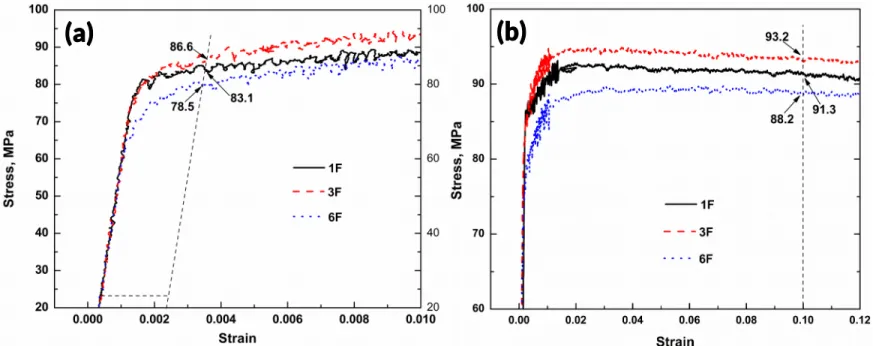
Figure 9 - Evolution of compression strengths at 573K (300°C) after 648K (375°C)/48h:
(a) YS at 0.002 strain and (b) compression strength at 0.1 strain
(a) (b)
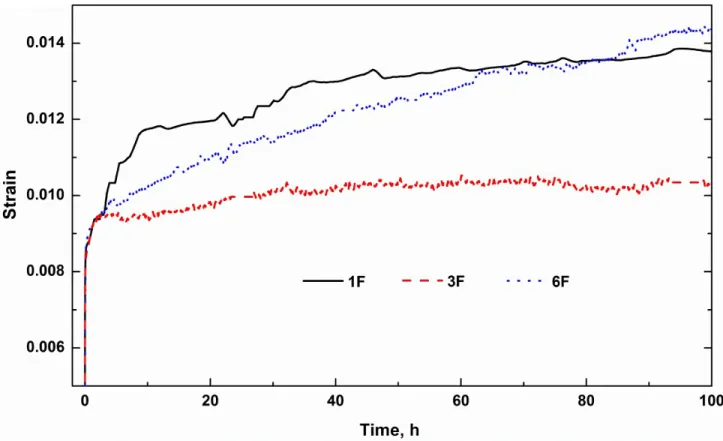
Figure 10 - Creep curves of experimental alloys at 573K (300°C) after 648K (375°C)/48h