HAL Id: inserm-00540490
https://www.hal.inserm.fr/inserm-00540490
Submitted on 3 Dec 2010
HAL is a multi-disciplinary open access
archive for the deposit and dissemination of
sci-entific research documents, whether they are
pub-lished or not. The documents may come from
teaching and research institutions in France or
abroad, or from public or private research centers.
L’archive ouverte pluridisciplinaire HAL, est
destinée au dépôt et à la diffusion de documents
scientifiques de niveau recherche, publiés ou non,
émanant des établissements d’enseignement et de
recherche français ou étrangers, des laboratoires
publics ou privés.
A model-based reconstruction method for 3-D rotational
coronary angiography.
Lizhe Xie, Yining Hu, Jean-Claude Nunes, Jean-Jacques Bellanger, Marc
Bedossa, Limin Luo, Christine Toumoulin
To cite this version:
Lizhe Xie, Yining Hu, Jean-Claude Nunes, Jean-Jacques Bellanger, Marc Bedossa, et al.. A
model-based reconstruction method for 3-D rotational coronary angiography.. Conference proceedings : ..
Annual International Conference of the IEEE Engineering in Medicine and Biology Society. IEEE
En-gineering in Medicine and Biology Society. Annual Conference, Institute of Electrical and Electronics
Engineers (IEEE), 2010, 1, pp.3186-9. �10.1109/IEMBS.2010.5627181�. �inserm-00540490�
Abstract— This paper presents a model-based reconstruction
method of the coronary tree from a few number of projections in rotational angiography imaging. The reconstruction relies on projections acquired at a same cardiac phase and an energy function minimization that aims to lead the deformation of the 3D model to fit projection data whereas preserving coherence both in time and space. Some preliminary results are provided on simulated rotational angiograms.
I. INTRODUCTION
oronary X-ray angiography remains the gold standard for the diagnostic and treatment guidance of lesions of the coronary arteries. Both currently rely on the choice of angiographic views and the operator's 3-D mental perception of the coronary tree, derived from analysis of 2-D projections. The objective is to view as much of the coronary tree as possible, while at the same time minimizing vessel overlap and foreshortening of vessel segments in areas of interest. Thus, rapid, online 3D coronary reconstruction would be helpful to improve the operator decision making as the procedure safety and outcome. However, cardiac reconstruction remains yet a challenging problem due to the motion of the structures. Different approaches have been considered for the reconstruction of coronary arteries [1]. Firstly, ECG gated reconstruction methods seek to solve the problem of cardiac motion by using only the projections corresponding to a same phase of the cardiac cycle [2]-[4]. Secondly, an alternative approach consists to go through a first estimate of the motion of the coronary arteries throughout the cardiac cycle to incorporate it into the tomographic reconstruction. Several methods have been developed making use of either iterative [5]-[6] or filtered back projection [7]-[8] methods. This kind of method involves parameterized the motion vector field in the 4D space (3D+T) and relies on computer vision techniques to
This work was supported by the French agency for research (ANR) under Grant 09FA388-01 and by the National Basic Research Program of China under Grant #2010CB732503.
L. Xie, Y. Hu and L. Luo are with the Laboratory of Image Science and Technology (LIST), South East University, C-210096 Nanjing, China J.C. Nunes, J.J. Bellanger, M. Bedossa and C. Toumoulin are with the French National Institute for Health and Medical Research (INSERM), U642, Rennes F-35000,France, and with the Laboratoire Traitement du Signal et de l’Image (LTSI), Université de Rennes 1, Rennes F-35000, France (corresponding author : phone : 33 2 23 23 57 22, fax : 33 2 23 23 69 17, e-mail : [email protected]).
C. Toumoulin, Y. Hu, L. Xie and L. Luo are also with the Centre de Recherche en Information Biomédicale Sino-Français (LIA CRIBs), Rennes, F-35000, France.
M. Bedossa is with the Interventional Cardiology Department, CHU Rennes, F-35000, France
extract the coronary tree on all the projections and track the vessel centerline throughout the 3D volume space. Thirdly, the third approach relies on the identification of a 3D coronary model from projections corresponding to one single cardiac phase. It makes use of 2D vessel segmentation, matching methods and epipolar constraints to reconstruct the artery centerlines in the 3D space. This process is known to be difficult and time consuming. New methods as in [9] propose a 3D modeling process guided by a 3D front propagation that combines projections to select the voxel and compute the front orientation.
This paper addresses the ill-posedness of the reconstruction by incorporing a priori knowledge about the structures and their deformations. This knowledge is given by a 3D parametric model of the coronary tree (including centerlines and edges). This model is projected onto the image projections and deformed in the 3D space to best fit projection data. This deformation process is described as a minimization of an energy function, which includes 2 regularization terms to constraint the deformation to be smooth both in the 3D space and in time. Section II.A presents notation and the model structure. Section II.B describes the model-based reconstruction process and section III provides preliminary results on simulated data.
II. METHOD
Rotational angiographic system allow to acquire a series of image projections of the left or right coronary tree during a single injection of dye contrast under different angles (caudal, cranial, axial) on a rotation time of 4-6 seconds (corresponding to about four/six cardiac cycles). Because of the motion, only projections associated with a same cardiac phase can be considered in the reconstruction process.
A. Preliminaries and notations
Let NT, the total duration of the acquisition run (with T the duration of a cardiac cycle and N the number of cardiac cycle). We note ft the reconstructed volume at time t (t NT) and assume that the time dependant volume ft is
T-periodical:ftTft. f is observed through a finite number t of projections Ytj at regular instants t jT S
j / , j
1,...,NS
, where S represents the number of projections in one cardiac cycle. Hence the sequence (ftj)j is S-periodical and we can rewrite tj j sf f )
( , with s = j Mod(S), fs denoting the volume at phase
s
of the cardiac cycle.Y1, Y2 …, YNT are supposed to be the gated projection
images acquired at angles 1, 2,…, NT respectively. We define
A model-based reconstruction method for 3-D Rotational Coronary
Angiography
Lizhe Xie, Yining Hu, Jean-Claude Nunes, Jean-Jacques Bellanger, Marc Bedossa, Limin Luo,
Christine Toumoulin
then byY , the projection images associated with the same s
cardiac phase s.
The proposed method considers that a 3D model of the coronary tree is available. This model can be built of different ways: (1) from a volume acquired on a MSCT scan at end-diastolic phase (corresponding to the rest phase of the heart), (2) from a first ECG gated reconstruction of the coronary tree selecting the phase s for which the projections will be of higher quality. A segmentation stage is performed to extract centrelines and contours, then the corresponding 3D vascular tree, is modelled as a directed graph Gs [ ,L Rs s], s being the phase of the cardiac cycle to which the 3D coronary tree is associated. L represents the set of centrelines with a set s
of n nodes and R the radius associated to each node. The nodes are classified into two categories: bifurcation node B and s
sampling nodes V between two bifurcation nodes s s i
b and bsj. We define then a 3D vessel segment is,j [Vis,j,Ris,j] (with
s s
j i, G
) that contains a set of ni,j nodes located between two neighbouring bifurcation nodes b and is b such that:sj
Vi,sj[vis,j(1),vis,j(2),...,vis,j(k),...,vis,j(ni,j)],
and Ris,j[ris,j(1),ris,j(2),...,ris,j(k),...,ri,sj(ni,j)].
Sampling nodes are indexed related to the vessel segment j
i,
(in the next sections, we will simplify notations and will write vs(k) instead of vis,j(k) and ( )r k instead of s
, ( )
s i j
r k ).
We assume the radius R and the voxel number ni,jin each centreline do not change over time. The topology of the coronary tree remains also the same throughout the cardiac cycle (same number of bifurcation points). The volume model
As is then built from the s j i,
. We defined M the operator such that the volume As at phase s can be expressed by:
, ( ) s s i j A M (1) B. Model-based reconstruction
The objective is to recover the 3D object f from its s projections Y such that Y Pf where P denotes the tomographic cone-beam projector. Due to the heart motion, we use only the projections Y associated with the same phase s of s
the cardiac cycles. In consequence, the reconstruction leads to inconsistencies in the inverse problem. We propose a model-based iterative reconstruction method that allows estimating a volume fˆ by iteratively deforming a coronary s
tree model A to fit projection data Y . This deformation s
process is described as a minimization of an energy functional, which includes 2 regularization terms to constraint the deformation to be smooth both in the spatial and temporal 3D spaces: 1 1 2 ˆs argmin ( ,s s) ( )s ( s , s) d sp t f s f E Y f E f E f f
(2)withfinitials . EA d (Y,f) is the data fidelity term and provides
the distance between the projected 3D tree and the input image
projections: 2 2 ) ( ) , ( s s s s d Y f Y P f E (3) ) ( sf sp
E imposes a smoothness onto the displacement field of nodes vs(k)related to the neighbouring nodes in the 3D space and also onto the radius r(k) to provide a regularization on the vessel edge changes:
2 2 ) 1 ( ) ( ) (f k k E s s s sp (4) ) , 1 (fs fs t
E acts in the temporal space on the sampling nodes ) (k vs : 2 2 1 1, ) ( ) ( ) (f f v k v k Et s s s s (5) 1
and2 represent the regularization coefficients that control the elasticity of the deformation. The optimisation is carried out using a gradient descent algorithm:
)] , ( ) ( ) ( ( [ * ) ( ) ( 1 2 1 2 2 1 s s t s sp s s q q s q s f f E f E f P Y (6) where q is the iteration and q the gradient step. The steepest gradient descent was preferred to Newton and conjugated gradients which induce larger size of the matrix.
III. RESULTONSIMULATEDPROJECTIONS The reconstruction algorithm was evaluated on a sequence of simulated projections, generated from a 3-D dynamic model of the coronary artery tree. This latter one was built from patient data acquired on a GE 64-slice CT scanner.
A sequence of 20 binary volumes representing the coronary artery tree was reconstructed every 5% of the RR interval. Each volume was then processed to build a directed graphGs[Ls,R]
is,j . The centrelines were modelled by a B-spline whose control points corresponded to the nodesv(k). For each line segment, we associated a value of radius r(k) to each node v(k) applying a linear decreasing function g(r) from the proximal to the distal part of the segment (TABLE I). A dynamic sequence of volumes A was then rebuilt from its sgraphsG . s
TABLE I
3D CORONARY ARTERY MODEL: DIAMETER RANGE FOR EACH BRANCH.
Left coronary artery
Branches Diameter (mm)
Control point number
Left Main artery (LM) [4.5 mm – 4 mm] 7 Left Anterior Descending artery
(LAD)
[4 mm – 1 mm] 83 Circumflex artery (LCx) [4 mm – 2 mm] 23 Lateral first diagonal (D1) [3 mm – 2 mm] 8 Lateral Second Diagonal (D2) [3mm – 2 mm] 11
We simulated then the rotational angiography acquisition process i.e. a continuous rotation of the C-arm system around this 3-D dynamic model to compute a series of image projections using the Siemens Axiom System imaging protocol [10]: four second run, angular coverage of 120°, primary angle increment of 1.5°, secondary angle : 0° axial, frame time : 33 images/s, start and end gantry arm positions: 60° RAO - 60° LAO, rotation speed of 30°/s. A sequence of 80 projections was generated; the projection size and resolution were 2562 and
0.28 mm2 respectively. Each volume As of the dynamic sequence was projected four times during the acquisition. The projection operator P was computed following [11].
A. Overall process
The steepest gradient descent algorithm leads to provide an initial model A which is close to the final solution to avoid its convergence towards a local minimum. Due to the cardiac amplitude motion which may be important at some phases (for instance at systolic and diastolic phases) and because the structures are thin (maximum diameter is 5 mm), the projected 3D model may not overlap the coronary tree on the image projections. To overcome this problem, we assigned a larger diameter to each branch of the 3D model: for each sampling node v of each centreline, the diameter was set to a constant k
value dc = 5 mm. We rebuilt then the volume Adc and used this
volume as initial model for the reconstruction of a set of volumes in which the coronary artery tree slightly changes (i.e. the motion is small on the considered phases). The sequence was divided into 4 subsets (a same model was used to initiate the reconstruction of 5 volumes (related to 5 successive phases). For each subset, we considered a different initial model. Except the first one which was chosen in the original sequence of volumes As, the other initial models were built from the trees
s
fˆ estimated at the last phase of the previous subsets (TABLE
II). The model-based reconstruction algorithm is the following:
Algorithm Sequence Reconstruction
Given the graph 1dc[V1,Rdc]and the input model A 1dc
Initialize parameter 105, 125.6 and 20.4 1 dc dc A A , sd = 1, sf = 5; while (sd <S) and (sf <S) for (s =sd; s<sf; s=s+1) f s Adc; repeat for (s = sd; s< sf ; s=s+1) calculate
1
1 2 ( ,s s) ( )s ( s , s) sp t E E Y f E f E f f update displacement via a gradient descent step : (s)q1(s)q *E Endfor until convergence ; ˆsf dc dc A f , sd = sf+1, sf = sf + 5; Endwhile End
The gradient step which is constant is determined heuristically. In order to validate the results, besides visual inspection, we computed two different error measures: the first one represents a 3D overlapping measure between the reconstructed volume fˆ and its corresponding ground truth s
(given by As):
) ( ) ˆ ( ) ( ) ˆ ( 1 , ˆ s s s s s s A Sup f Sup A Sup f Sup A f (7)where Sup(fˆs) characterizes the set of voxels such that fˆ is s
equal to 1. The second measure provides the mean relative error on the estimated radii ˆr k of all points
ˆv k for each segment
of the reconstructed tree fˆ : s
ˆ 1 ˆ ( , ) k r k r k MRE R R n r k
(8)The initial 3D model A deforms to fit the projections Ydc s associated with the phase s. The resulting 3D tree fˆ is built s
from the displacement of the nodes v k and the modification
of the radii r k of the initial model
A . No correspondence dchas been established between the estimated volume fˆ and the s
ground truth As. Thus, for each estimated radius at each node
ˆv k , we look for the closest voxel on the centrelines of the ground truth As. If the closest voxel is located between two
sampling nodes (v k ,
v k
1
), this latter one (notedv k )
and its local radius r k is interpolated. We compute then the
mean relative error between estimated radii ˆr k on
fˆ and sthe interpolated radii r k on
A . sTABLE II
INITIAL MODEL DEFINITION Initial Model
(dc relates to the enlarged diameter)
Reconstruction of the trees at successive phases in the range [sd – sf] : fˆsd fˆsf 1 dc dc A A f ˆ1 fˆ5 5 ˆ dc dc f A f ˆ6 fˆ10 10 ˆ dc dc f A ˆf11fˆ15 15 ˆ dc dc f A fˆ16fˆ20
Initial models used in the reconstruction of the 3D coronary tree sequence. Adc
means that the branch diameter of the model is initially set to dc (dc = 5 mm). The tree fˆsf estimated at phase
f
s is used to initiate the reconstruction of the next volumes. The new model is rebuilt with a larger branch diameter.
B. Parameter setting and reconstruction results
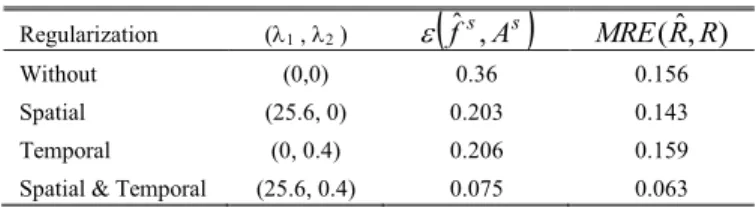
We studied the behavior of the algorithm according to the regularization coefficients 1 and 2 for the reconstruction of all
the volumes of a sequence. We applied a greedy algorithm to evaluate the impact of each regularization term. We first set (1,
2) = (0,0), we then evaluated separately the spatial and
temporal regularizations. We have reported in TABLE III, the values of 1 and 2 that minimized the reconstruction errors
f ,ˆs As
andMRE( RRˆ, ). We chose then the regularizer that provided the best result i.e. the spatial one, and performed a second series of test with 1 = 25.6, making vary 2. We
obtained the best accuracy of the reconstruction (92.5%) for (1 , 2) = (25.6, 0.4). Order of magnitude of 1 and 2 are
notably different since 1 and are different. TABLE III
ACCURACY OF THE RECONSTRUCTION
Regularization (1 , 2 )
f ,ˆs As
MRE( RRˆ, )Without (0,0) 0.36 0.156 Spatial (25.6, 0) 0.203 0.143 Temporal (0, 0.4) 0.206 0.159 Spatial & Temporal (25.6, 0.4) 0.075 0.063 Only values of i providing the minimum error for each of the situations
(without regularizer, with spatial only, temporal only, spatial + temporal regularizers) are reported here. Displayed errors are mean values computed for the set of the volumes of the sequence.
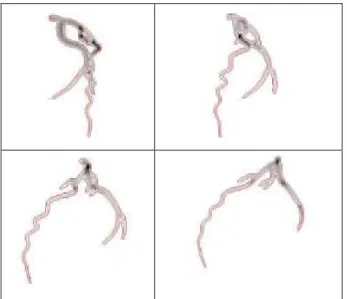
Fig. 1:A result of the coronary reconstruction from 4 projections at phase 11 (corresponding to angles RAO 43.5°, RA0 13.5°, LAO 17.5°, LAO 47.5°). An example of the reconstruction result is given in Fig.1. It used the four projections associated with the phase 11 (Fig. 2). The estimated 3D tree at phase 11 was then projected on each image projection to visually evaluate the quality of the reconstruction. The projected edges appear superposed in red color in Fig.2. Fig. 3 displays the 3D central axis of the model before and after its deformation.
IV. CONCLUSION
We briefly introduced a model-based iterative reconstruction method for the coronary artery tree from a limited number of projections. The evaluation of the method was carried out on simulated projections, which were built from patients data acquired on a MSCT scan. They provide a relevant ground truth for evaluating the algorithm in a highly deformable environment. Preliminary results show a good accuracy (~ 92 %) in the reconstruction of the coronary artery tree throughout the cardiac cycle. This method assumes a preliminary segmentation stage has been performed, which was ideal. Further work will relax these assumptions (section II.A) in particular on the topology of the structure to take into account the segmentation errors (missing branches in some projection images, difference in the branch length between the model and image projections, etc.).
a) b)
Fig. 3: Superposition between the 3-D centerlines of the ground truth volume
A11(in blue color) and (in red color): a) the initial model A, b) the reconstructed
11
ˆf (points in red color shows the location of 3D control points after deformation of the model A).
Fig. 2: 4 projections at phase 11 (respectively corresponding to angles RAO 43.5°, RA0 13.5°, LAO 17.5°, LAO 47.5°). The projections Ys (s = 11) appear
in grey levels. The edges of the re-projected 3D tree appear superposed in red color on the projections.
REFERENCES
[1] Schoonenberg G., Neubauer A., Grass M., Three-Dimensional coronary visualization, Part 2 : 3D reconstruction, Cardiology Clinics, Advances in coronary Angiography, 27(3), 2009, 453-465
[2] Rasche V., Movassaghi B., Grass M., et al. Automatic selection of the optimal cardiac phase for gated three-dimensional coronary X-ray angiography, Acad. Radiol., 2006, 13, 630–40.
[3] Zhou J., Bousse A., Yang G.., Bellanger J.-J., Luo L., Toumoulin C., Coatrieux J.L, A blob-based tomographic reconstruction of 3D coronary trees from rotational X-ray angiography, SPIE Médical imaging, San Diego, CA USA, 16-21 février 2008, pp 6913-94, N°6913.
[4] Hansis E., Schäfer D., Dössel O., et al. Evaluation of iterative sparse object reconstruction from few projections for rotational coronary angiography, IEEE T-MI, 2008, 27(11), 1548–55
[5] Bousse A., Zhou A., Yang G., Bellanger J.-J., Toumoulin C., Motion Compensated Tomographic Reconstruction of Coronary Arteries in Rotational Angiography, IEEE T-BME, 56(4), 1254-1257, 2009 [6] Blondel C., Malandain G., Vaillant R., and Ayache N., Reconstruction
of coronary arteries from a single rotational X-ray projection sequence, IEEE T-MI, 25, 2006, 653–663,
[7] Schäfer D., Borgert J., Rasche V., et al. Motion compensated and gated cone beam filtered backprojection for 3D rotational angiography. IEEE T-MI 2006, 25(7), 898–906.
[8] Rohkohl C., Lauritsch G., Prümmer R.,Hornegger J., Interventional 4-D Motion Estimation and Reconstruction of Cardiac Vasculature without Motion Periodicity Assumption, Springer-Verlag Berlin Heidelberg, MICCAI 2009, Part I, LNCS 5761, 2009, 132–139.
[9] Jandt U., Schäfer, D., Grass M., Rasche V., Automatic generation of 3D coronary artery centerlines using rotational X-Ray angiography, Medical Image Analysis, 13, 2009, 846:858.
[10] Yang G.., Bousse A., Toumoulin C., and Shu H., Simulation Environment for the Evaluation of 3D Coronary Tree Reconstruction Algorithms in Rotational Angiography, in Proc. Eng. Med. Biol. Soc. (EMBS 2007), 2007, 1, 3066 : 3069.
[11] Man B. D. and Basu S., Distance-driven projection and backprojection in three dimensions, Phys. Med. Biol., vol. 49, 2004, pp 2463-2475.