Comprehensive proteomic characterization
of stem cell-derived extracellular matrices
The MIT Faculty has made this article openly available.
Please share
how this access benefits you. Your story matters.
Citation
Ragelle, Héloïse et al. "Comprehensive proteomic characterization
of stem cell-derived extracellular matrices." Biomaterials 128 (June
2017): 147-159 © 2017 Elsevier Ltd
As Published
http://dx.doi.org/10.1016/j.biomaterials.2017.03.008
Publisher
Elsevier BV
Version
Original manuscript
Citable link
https://hdl.handle.net/1721.1/126846
Terms of Use
Creative Commons Attribution-NonCommercial-NoDerivs License
Detailed Terms
http://creativecommons.org/licenses/by-nc-nd/4.0/
Comprehensive proteomic characterization of stem cell-derived extracellular matrices 1
2 3
Héloïse Ragelle1*, Alexandra Naba1*¥, Benjamin L. Larson1-3, Fangheng Zhou1, Miralem Prijic1, 4
Charles A. Whittaker1, Amanda Del Rosario1, Robert Langer1-4, Richard O. Hynes1,5, Daniel G. 5
Anderson1-4 6
7
1 David H. Koch Institute for Integrative Cancer Research, Massachusetts Institute of 8
Technology, Cambridge, MA 02142, USA 9
2 Harvard-MIT Division of Health Sciences and Technology, Massachusetts Institute of 10
Technology, Cambridge, MA 02139, USA 11
3 Institute for Medical Engineering and Science, Massachusetts Institute of Technology, 12
Cambridge, MA 02139, USA 13
4 Department of Chemical Engineering, Massachusetts Institute of Technology, Cambridge, MA 14
02139, USA 15
5 Howard Hughes Medical Institute, Massachusetts Institute of Technology, Cambridge, MA 16
02138, USA 17
¥ Present address: Department of Physiology and Biophysics, University of Illinois at Chicago, 18
Chicago, IL 60612, USA 19
20
* These authors contributed equally to the work 21
Corresponding author: [email protected] 22
23
Abstract 24
25
In the stem-cell niche, the extracellular matrix (ECM) serves as a structural support that 26
additionally provides stem cells with signals that contribute to the regulation of stem-cell function, 27
via reciprocal interactions between cells and components of the ECM. Recently, cell-derived 28
ECMs have emerged as in vitro cell culture substrates to better recapitulate the native stem-cell 29
microenvironment outside the body. Significant changes in cell number, morphology and function 30
have been observed when mesenchymal stem cells (MSC) were cultured on ECM substrates as 31
compared to standard tissue-culture polystyrene (TCPS). As select ECM components are known 32
to regulate specific stem-cell functions, a robust characterization of cell-derived ECM proteomic 33
composition is critical to better comprehend the role of the ECM in directing cellular processes. 34
Here, we characterized and compared the protein composition of ECM produced in vitro by bone 35
marrow-derived MSC, adipose-derived MSC and neonatal fibroblasts from different donors, 36
employing quantitative proteomic methods. Each cell-derived ECM displayed a specific and 37
unique matrisome signature, yet they all shared a common set of proteins. We evaluated the 38
biological response of cells cultured on the different matrices and compared them to cells on 39
standard TCPS. The matrices lead to differential survival and gene-expression profiles among the 40
cell types and as compared to TCPS, indicating that the cell-derived ECMs influence each cell 41
type in a different manner. This general approach to understanding the protein composition of 42
different tissue-specific and cell-derived ECM will inform the rational design of defined systems 43
and biomaterials that recapitulate critical ECM signals for stem-cell culture and tissue engineering. 44
45 46
Keywords: extracellular matrix; mesenchymal stem cell; proteomic analysis; stem-cell derived 47
matrices; ECM cell-culture substrate; tissue engineering 48
49 50
1. Introduction 51
1
In the body, cells are surrounded by a complex three-dimensional microenvironment, termed the 2
extracellular matrix (ECM), which provides cells with many chemical and biophysical signals 3
required for cell function. Both specific components and biophysical properties of the ECM 4
coordinate intracellular signaling and downstream biological responses through bidirectional 5
interactions with the cells, regulating numerous physiological processes such as cell survival, 6
migration, proliferation and differentiation [1–3]. In the stem-cell niche, cell-matrix interactions 7
influence and modulate stem-cell self-renewal and differentiation. That is, the ECM operates in 8
vivo not only as a cellular support but also directs cell fate through coordinated physical and
9
biochemical cues [4–6]. 10
11
During mammalian stem-cell culture, stem cells are removed from their native microenvironment 12
(e.g., the bone-marrow niche for bone-marrow-derived mesenchymal stem cells (MSC), adipose 13
tissue for adipose-derived mesenchymal stem cells) and need to adapt to a relatively foreign 14
environment, that is, tissue-culture polystyrene (TCPS), which is fully synthetic and does not 15
present standard ECM signals. Evidence in the literature has shown that TCPS biases MSC 16
function resulting in lower proliferation rates and a loss of stemness over sequential passages [7– 17
9]. Therefore, ECM-based cell-culture substrates have been developed in an attempt to better 18
recapitulate in vitro the native cellular microenvironment [10–14]. MSC are able to deposit an ECM 19
on TCPS over the course of two weeks and this ECM can be used, after decellularization, as a 20
culture substrate for a new batch of MSC. It has been reported that the culture of MSC on in vitro 21
cell-derived ECM induces significant biological changes in MSC function compared to standard 22
culture conditions [10,11,15,16]. As ECM components are key players in the regulation of cellular 23
processes, it is critical to gain a better knowledge of ECM composition to decipher how ECM 24
components regulate cell function. In addition, a comprehensive understanding of cell-matrix 25
interactions will provide further insight into the rational design of ECM-mimicking substrates for 26
tissue engineering and regenerative medicine [17,18]. 27
28
Despite several reports on the development of cell-derived ECMs for MSC culture, detailed data 29
about their molecular composition is limited. Traditional biochemical analysis of ECM is 30
challenging on account of the insolubility and complexity of ECM components [19]. To address 31
these issues, we have applied a proteomic approach initially described for the analysis of tumoral 32
ECM [20]. The method consists of a sequential digestion of the ECM proteins followed by tandem 33
mass spectrometry and bioinformatic analyses, yielding a detailed inventory of the ECM and ECM-34
associated proteins (termed the “matrisome”). By coupling this method to label-based quantitative 35
proteomics, we were able to characterize and compare the molecular composition of cell-derived 36
ECM produced by different cell types in vitro, specifically bone- marrow-derived human 37
mesenchymal stem cells (Bm MSC), adipose-derived MSC (Ad MSC) and human neonatal dermal 38
fibroblasts (NHDF), as well as to evaluate the ECM produced by cells from different donors. 39
Proliferation and mRNA transcriptomic profiling of the cells cultured on the different ECM were 40
performed and compared to standard culture conditions. 41
42
We observe that, in addition to a set of common proteins, each derived ECM contains cell-43
type-specific proteins. Quantitative proteomic analysis reveals a specific matrisome signature for 44
each type of ECM. The matrices lead to differential cell growth and gene expression among the 45
cells as compared to TCPS culture, indicating that the ECM signatures influence each cell type in 46 a differential fashion. 47 48 49 50
2. Materials and methods 51
1
2.1. Preparation of in vitro cell-derived ECM 2
3
ECM plates were provided by StemBioSys (San Antonio, Texas) and prepared according to a 4
published protocol [16]. Briefly, human mesenchymal stem cells derived from bone marrow (Bm 5
MSC, Lonza) or from adipose tissue (Ad MSC, Life Technologies), or neonatal dermal fibroblasts 6
(NHDF, Life Technologies) were seeded onto a 75 cm2-cell culture flask coated with human 7
fibronectin (1 h at 37°C) at a cell density of 3,500 cells/cm2 and cultured in α-MEM medium 8
supplemented with 15% fetal bovine serum (FBS) and 1% penicillin-streptomycin for 14 days. The 9
medium was refreshed the day after initial seeding and then every 3 days. At day 7, ascorbic acid 10
2-phosphate (A2P, Sigma) was added to the medium at a final concentration of 50 μM, and A2P-11
supplemented medium was used until the end of ECM production, with medium changes every 12
other day. At day 14, plates were decellularized using 0.5% Triton in 20 mM ammonium hydroxide 13
for 5 min, rinsed two times with Hank's Balanced Salt Solution containing both calcium and 14
magnesium (HBSS +/+), and once with ultra-pure H2O. Plates coated with cell-derived ECM were 15
stored dry at 4°C until use for cell culture. In vitro ECM produced by commercially available Ad 16
MSC (two different 35- and 45-year-old female donors), Bm MSC (six different 19- to 22-year-old 17
males and female donors) and NHDF (two different new born male donors) are designated as Ad 18
ECM, Bm ECM and Der ECM, respectively. The donor characteristics listed above were provided 19
by the companies. 20
21
2.2. Proteomic analysis of ECM samples 22
23
The ECM was mechanically detached from the 75 cm2-cell culture flask using a cell scraper in 2 24
ml of HBSS +/+, centrifuged at 16,000x g for 5 min, washed with 1 ml of HBSS +/+, centrifuged, 25
and dried in a Speed-Vac (Savant) for 15 min. The ECM pellet was then processed as described 26
previously [20,21]. Briefly, the ECM pellet was resuspended and reduced in a solution of 8 M urea, 27
100 mM ammonium bicarbonate, and 10 mM dithiothreitol at pH 8 under agitation at 37°C for 2 h. 28
After cooling, cysteines were alkylated by adding iodoacetamide at a final concentration of 25 mM 29
for 30 min. The ECM sample was then diluted to 2 M urea, 100 mM ammonium bicarbonate (pH 30
8), and deglycosylated with PNGaseF (2000 U, New England BioLabs, Ipswich, MA) for 2 h under 31
agitation at 37°C, followed by digestion with Lys-C (Wako Chemicals USA, Richmond, VA), at a 32
ratio of 1:100 enzyme:substrate, under agitation at 37°C for 2 h. Final digestion was done using 33
trypsin (Sequencing Grade, Promega, Madison, WI), at a ratio of 1:50 enzyme:substrate, under 34
agitation at 37°C overnight, followed by a second aliquot of trypsin, at a ratio of 1:100 35
enzyme:substrate, and an additional 2 h of incubation. Digests were acidified and desalted using 36
30mg HLB Oasis Cartridges (Waters Corp., Milford, MA) eluted with 50% acetonitrile with 0.1% 37
trifluoroacetic acid (TFA), followed by concentration in a Speed-Vac. 38
39
2.3. Analysis by mass spectrometry (LC-MS/MS) 40
41
Each sample was separated by reverse-phase HPLC using an EASY-nLC1000 liquid 42
chromatograph (Thermo Fisher Scientific, Waltham, MA) over a 140-minute gradient before 43
nanoelectrospray using a Q Exactive mass spectrometer (Thermo Fisher Scientific). The mass 44
spectrometer was operated in a data-dependent mode. The parameters for the full-scan MS were: 45
resolution of 70,000 across 350-2000 m/z; AGC 3e6; and maximum IT 50 ms. The full MS scan 46
was followed by MS/MS for the top 10 precursor ions in each cycle with a normalized collision 47
energy (NCE) of 28 (unlabeled samples) or 32 (labeled samples) and dynamic exclusion of 30 s. 48
Raw mass spectral data files (.raw) were searched using Proteome Discoverer (Thermo Fisher 49
Scientific) and Mascot version 2.4.1 (Matrix Science) using the SwissProt Homo sapiens database 50
(SwissProt_2016_02, Homo sapiens 20199 sequences) containing 20,199 entries. Mascot search 51
parameters were: 10 ppm mass tolerance for precursor ions; 0.8 Da for fragment-ion mass 1
tolerance; 2 missed cleavages of trypsin; fixed modifications were carbamidomethylation of 2
cysteines and for the quantitative experiments: Tandem Mass Tag (TMT) 6-plex modifications of 3
lysines and peptide N-termini; variable modifications were oxidized methionines, deamidation of 4
asparagines, pyro-glutamic acid modification at N-terminal glutamines; and hydroxylation of 5
prolines and lysines. Only peptides with a Mascot score greater than or equal to 25 and an isolation 6
interference less than or equal to 30 were included in the quantitative data analysis. The average 7
false discovery rate was 0.0080 (ranging from 0.0033- 0.0107). Proteins were identified as being 8
ECM-derived or not using the human matrisome annotations as previously described [22,23]. 9
10
2.4. Label-based quantitative proteomics 11
12
Peptide labeling with Tandem Mass Tag (TMT) reagents (Thermo Fisher Scientific) was performed 13
according to the manufacturer’s instructions. Lyophilized samples were dissolved in 70 μl ethanol 14
and 30 μl of 500 mM triethylammonium bicarbonate (pH 8.5) and the TMT reagent was dissolved 15
in 30 μl of anhydrous acetonitrile. The solutions containing peptides and TMT reagents were 16
vortexed and incubated at room temperature for 1 h. Samples were labeled using the TMT 6-plex 17
channels as follows: 18
Study of ECMs produced by bone marrow-derived MSC from different donors: Replicate 1: donor
19
1: TMT-129N, donor 2: TMT-127N, donor 3: TMT-126, donor 4: TMT-130C, donor 5: TMT-128C, 20
donor 6: TMT-128N. Replicate 2: donor 1: TMT-126, donor 2: TMT-127, donor 3: TMT-128, donor 21
4: TMT-129, donor 5: TMT-130, donor 6: TMT-131. 22
Study of ECMs produced by different cell types: Replicate 1: Bm ECM: 126, Der ECM:
TMT-23
127, Ad ECM: 128. Replicate 2: Bm ECM: 126, Der ECM: 128, Ad ECM: TMT-24
127. 25
An initial LC-MS/MS analysis was performed on each sample, and the total number of peptides 26
identified and the sum of the intensity of the precursor ions were used as initial metric to determine 27
equivalent peptide amount and normalize the samples. Equal amounts of samples labeled with 28
the different isotopic TMT reagents were combined and concentrated to completion in a vacuum 29
centrifuge, resuspended in 100 μl of 0.1% formic acid, and analyzed by LC-MS/MS as described 30
above. TMT quantification was isotopically corrected according to the manufacturer’ instructions, 31
and the values were normalized to the median of each channel. 32
The protein expression data were analyzed as described in [24]. Fold changes were expressed in 33
the log2 scale relative to the average of all samples. To account for biological variation, observed 34
proteins with TMT log2 fold change ratios below -1 were considered reduced in expression and 35
proteins with TMT log2 fold change ratios above 1 were considered increased in expression. The 36
coefficients of variation across the biological replicates were calculated for all proteins as the 37
standard deviation divided by the mean. 38
The raw mass spectrometry data have been deposited to the ProteomeXchange Consortium via 39
the PRIDE partner repository with the dataset identifier PXD005521 and 10.6019/PXD005521 40
[25,26]. The raw mass spectrometry data will become publicly available upon acceptance of the 41
paper. During the evaluation of the manuscript, the reviewers can access the raw mass 42
spectrometry by login to the PRIDE website (http://www.ebi.ac.uk/pride/archive/login) using the 43
following credentials: username: [email protected] /Password: njYYGlKR. 44 45 46 47 48 2.5. Cell culture 49 50
Bone-marrow-derived human mesenchymal stem cells (Bm MSC, Texas A&M University System 1
Health Science Center), adipose-derived human MSC (Ad MSC, Thermo Fisher Scientific) and 2
human neonatal dermal fibroblasts (NHDF, Lonza) were seeded on each substrate (i.e., Bm ECM, 3
Ad ECM, Der ECM or TCPS) at a cell density of 3,500 cells/cm2. Cells were cultured in α–MEM 4
medium supplemented with 20% FBS and 1% penicillin-streptomycin. The medium was changed 5
the day after seeding and every 3 days thereafter. For the cell growth experiment, cells were 6
harvested and counted using a hemocytometer 72 h after seeding. After fixation with 3.2% 7
paraformaldehyde (PFA) solution, actin filaments were stained with Alexa Fluor® 488 Phalloidin 8
(Life Technologies, Carlsbad, CA) for 30 min and cell nuclei was stained with DAPI for 15 min. 9
Samples were imaged using an Evos fluorescent microscope. For flow cytometric analysis, a 10
number of 105 Bm MSC were incubated with the desired antibodies i.e., FITC-conjugated CD36 11
antibody (Biolegend), FITC-conjugated ITGAV antibody (Thermo Fisher), APC-conjugated ITGB8 12
antibody (Thermo Fisher) or APC-conjugated FGFR2 antibody (R&D Systems) following 13
manufacturer’s instructions, prior to flow cytometric analysis using a FACS Calibur flow cytometer 14
(Beckman Coulter, Brea, USA). Data was analyzed using the FlowJo software (Three Star, 15
Ashland, USA). 16
17
2.6. Immunostaining of the ECM 18
19
For confocal imaging, each ECM was prepared on glass-bottom dishes using the same protocol 20
as above to generate ECM-coated plates. ECM was fixed with 3.2% PFA for 15 min at room 21
temperature and then incubated with donkey serum (0.5% in PBS) at 4°C for 1 h. Anti-Collagen I 22
antibody (Abcam, 1:100 in 1% BSA) was then added to the sample. After three rinses with 1% 23
BSA solution, Alexa Fluor® 555 donkey anti-rabbit secondary antibody was added for 1 h at 4°C 24
(1:1000 in 0.5% donkey serum). The sample was washed 5 times with 1% BSA and incubated 25
with an anti-fibronectin antibody (Rabbit monoclonal F1 Alexa Fluor® 647, Abcam, 1:100 1 h 4°C). 26
Cell nuclei were stained with DAPI for 15 min. Olympus FV1200 confocal microscope was used 27
for imaging and image reconstruction was done using Image J. 28
29
2.7. Electron microscopy 30
31
The protocol for electron microscopy was adapted from [16]. Briefly, ECM samples were hydrated
32
for 1 h with PBS at 37°C and fixed with 2% glutaraldehyde in 0.1 M sodium cacodylate buffer (pH
33
7.4) at room temperature for 1 h. Following 30 min incubation with 0.1 M sodium cacodylate buffer
34
at room temperature, the samples were dehydrated in ascending concentrations of ethanol (35%,
35
70%, 95%, 100%), and coated with 30 nm gold-palladium. After coating, ECM samples were
36
imaged using a scanning electron microscope (Zeiss Merlin High-resolution SEM).
37 38
2.8. Transcriptomic analysis 39
40
Total RNA was extracted using RNeasy Mini Kit (Qiagen, Hilden, Germany) from NHDF, Ad MSC, 41
and Bm MSC after 3 days of culture on TCPS, Ad ECM, Bm ECM or Der ECM, in triplicate. Total 42
RNA was amplified and labeled using Gene Chip 3’ IVT Express Kit (Affymetrix) and hybridized to 43
Human Genome Microarrays (Affymetrix). Microarray data were analyzed using Spotfire. 310 44
genes with differential expression (abs log2FC≥1, p-value≤0.05) in at least one of the 3 45
comparisons (Der ECM versus TCPS, Ad ECM versus TCPS, Bm ECM versus TCPS) for at least 46
one of the 3 cell types (NHDF, Ad MSC, Bm MSC) were selected for self-organizing map (SOM) 47
clustering. Replicates were averaged and row normalized with the GenePattern module 48
PreprocessDataset so that the average of each row is set to 0 with a variance of 1 [27]. These 49
row-centered data were then clustered using the GenePattern module SOMclustering. A range of 50
cluster numbers was tested and the final number of clusters to consider was identified using elbow 51
analysis where the last increase in cluster number explaining an additional 1% of the variance in 1
the data was selected. In this experiment, this corresponded to 13 clusters that explained about 2
81% of the variance in the data. Gene Set Enrichment Analysis (GSEA) was performed to analyze 3
the gene sets and obtain the enrichment sets [28,29]. All microarray data are publicly available 4
through the Gene Expression Omnibus archives under accession number GSE94667. 5
The same RNA was also used for real time Reverse Transcriptase-Polymerase Chain Reaction 6
(RT-PCR) to confirm microarray results. Real-time RT-PCR was performed with validated primers 7
and Cells-to-CT Taqman reagents (Applied Biosystems, Foster City, CA) on a StepOnePlus 8
thermocycler (Applied Biosystems). GAPDH was used as a loading control for each sample. 9
10
2.9. Statistical analyses 11
12
Data are presented as mean ± standard deviation (SD) and were analyzed using GraphPad Prism 13
6 (GraphPad Software Inc, La Jolla). Statistically significant differences were assessed by 14
unpaired t-test or, for multiple comparisons, by an analysis of variance (ANOVA) at a 0.05 15
significance level and Tukey's post test, with *p<0.05, **p<0.01, and ***p<0.001. 16
17
3. Results 18
19
3.1. Bm ECM improves the growth of mesenchymal stem cells in vitro 20
21
MSC produced an insoluble ECM after 14 days in culture in ascorbic acid-supplemented medium 22
(Fig 1B-C). This cell-derived ECM obtained after decellularization was used as a substrate for the 23
culture of a new batch of MSC. The ECM produced by bone-marrow-derived MSC (Bm MSC) 24
displayed a dense fibrillar structure as imaged by electron microscopy (Fig 1B). Immunostaining 25
showed that the cells were embedded in complex networks of fibronectin and collagen I (Fig 1C). 26
We compared the growth of Bm MSC on TCPS and on their own matrix, Bm ECM, 72 h after 27
seeding. MSC on Bm ECM grew significantly more than those on TCPS, indicated by an increase 28
in total cell number (Fig 1D and E). 29
1 2
Figure 1: ECM produced by Bm MSC in vitro. (A): Bidirectional interactions between MSC and ECM
3
regulate cell function. (B): Electron microscopy of Bm ECM reveals a fibrillar structure. Scale bar is 1 μm.
4
(C): Immunostaining of Bm MSC on their ECM after 14 days using fibronectin antibody (green, top right
5
picture), collagen I antibody (red, bottom left picture) and DAPI (cell nuclei, blue, bottom right picture). The
6
overlay is shown in top left picture. Scale bar is 50 μm. (D): Fluorescence microsopy images of Bm MSC on
7
TCPS (top) or Bm ECM (bottom) after 3 days of culture. Actin cytoskeleton was stained with Alexa Fluor®
8
488 Phalloidin and cell nuclei with DAPI; scale bar is 200 μm. (E): Number of Bm MSC after 3 days of culture
9
on Bm ECM (blue bar) or TCPS (grey bar). Results show mean ± SD of three independent experiments
10
performed in triplicate. Statistics were done using unpaired t-test (**p<0.01).
11 12
A
B
C
TCPS Bm ECMD
MSC ECME
TCPS Bm ECM 0 2×10⁵ 4×10⁵ 6×10⁵ 8×10⁵ 1×10⁶ C el l n u m b er ** DAPIFN COL1 50 mm 200 mm DAPIActin 1 mm3.2. Proteomic characterization of in vitro cell-derived Bm ECM 1
2
As we and others have observed changes in MSC cell behavior on cell-derived ECM as compared 3
to standard TCPS culture, we were motivated to develop a comprehensive characterization of the 4
Bm ECM molecular composition. 5
6
3.2.1. Proteomic approach to characterize in vitro cell-derived ECM
7 8
Proteomic characterization of ECM is challenging on account of the complexity and biochemical 9
properties of ECM components, which are mainly large, insoluble, highly cross-linked and 10
glycosylated proteins. The primary technique for proteomic characterization, mass spectrometric 11
analysis, requires proteins to be solubilized and digested into peptides. Traditional approaches to 12
overcome ECM biochemical intractability employ solubilizing agents in concentrations that are 13
incompatible with mass spectrometers [19]. This technical issue, along with the difficulty to 14
functionally annotate ECM components accurately, have impeded the development of a global 15
characterization of stem-cell ECM and explain why only partial characterizations of stem-cell 16
matrices have been reported so far. Recently, Naba et al. have overcome this hurdle by 17
developing a global proteomic approach that consists of the sequential solubilization and digestion 18
of ECM proteins into peptides, without the need for centrifugation, minimizing material loss. This 19
multistep process is comprised of ECM denaturation, reduction, alkylation, deglycosylation and 20
protease digestion, followed by liquid chromatography combined with tandem mass spectrometry 21
(LC-MS/MS) [20,21], bioinformatic analysis and filtering through MatrisomeDB, an inventory of all 22
human matrisome genes and proteins, to specifically identify matrisome proteins (i.e., the proteins 23
that constitute the ECM) [22,23,30]. 24
25
Here, Bm ECM produced in vitro by bone marrow-derived MSC was characterized using this 26
proteomic approach. The total number of proteins detected in Bm ECM across the donors was 27
420 on average (range 340 to 499 proteins), of which 20% were expressly identified as ECM or 28
ECM-associated proteins (corresponding to between 64 and 84 proteins). The remaining proteins, 29
designated as non-ECM proteins, consisted of insoluble intracellular components that remained 30
after the decellularization step and were, for the most part, proteins associated with the actin 31
cytoskeleton or with intermediate filaments (Supplementary Table III). Despite their number, the 32
non-ECM-associated proteins represented only a small fraction of the proteomic content, i.e., 33
approximately 25% of the precursor-ion MS signal intensity, which is representative of peptide 34
abundance and the matrisome proteins were detected in large abundance (Supplementary Fig 1). 35
36
Fibronectin pre-coating was used in this study to help prevent ECM detachment from the culture
37
dish during ECM production, most likely by providing a more adhesive surface for the cells [11].
38
To verify that the fibronectin pre-coating did not affect the final ECM composition, and more
39
particularly, did not contribute to an overestimation of the fibronectin amount in the ECM, we
40
performed mass spectrometry analysis of ECM deposited on pre-coated TCPS and compared this
41
ECM deposited on uncoated TCPS. Results showed that fibronectin was the most abundant
42
protein, and was detected in similar amounts, in both conditions. In addition, the pre-coating did
43
not affect ECM composition, as shown by the distribution of the 10 most abundant ECM proteins
44
(Supplementary Fig 2). Finally, to estimate the contribution of bovine serum proteins to the
45
composition of cell-derived ECM, mass spectrometry data were searched for bovine proteins and
46
results showed that they represent less than 2% of the total protein content (Supplementary Fig
47
3). Some peptide sequences are common to both human and bovine species, and were
48
considered as human in this study.
49
3.2.2. ECM produced by bone marrow-derived MSC displays a specific and consistent matrisome
50
signature
1
To gain a thorough understanding of the ECM produced by Bm MSC in vitro, we characterized 2
the ECM produced by MSC from six different donors. All proteins, even those detected with only 3
one peptide, were included in the analysis to provide an exhaustive proteomic composition of Bm 4
ECM. The detailed individual composition for each donor is listed in Supplementary Table I. 5
6
The ECM produced by Bm MSC in culture over the course of 14 days presents a relatively complex 7
composition. Indeed, across the six donors, 108 ECM and ECM-associated proteins were 8
identified, of which 62 proteins were present in more than five donors (listed in Table I) and 49 9
proteins were consistently found in all six donors (Fig 2B). The matrisome proteins of the common 10
set were present in large amounts, as indicated by the precursor-ion MS intensity and peptide 11
number, while the proteins found in fewer than three donors were detected with only a few 12
peptides, indicative of their low abundance (Supplementary Table I). As the most abundant 13
peptides are preferentially selected for fragmentation and identified with LC-MS/MS, proteins in 14
low amounts are thus less likely to be consistently detected, partly explaining why some proteins 15
are only detected in some of the donors. The common proteins were detected consistently across 16
donors, as indicated by the similar numbers of peptides and peptide intensities, suggesting that 17
ECM produced by Bm MSC isolated from different donors present a relatively consistent 18
composition. 19
20
Matrisome proteins can be classified in two distinct categories: those proteins that constitute the 21
core matrisome (i.e., collagens, glycoproteins, and proteoglycans) and those proteins that are 22
associated and interact with the core matrisome proteins, designated as matrisome-associated 23
proteins (i.e., regulators, secreted factors, and other ECM-affiliated proteins). Figure 2A shows 24
the matrisome signature of Bm ECM as a segmentation of the matrisome proteins into each sub-25
category. Core matrisome proteins were dominant; they represented around 60% of the total 26
number of Bm ECM matrisome proteins and were also very abundant (75% of the precursor-ion 27
MS signal intensity and 50% of the number of peptides, Supplementary Fig 1). The proteins of the 28
core matrisome are structural proteins that confer mechanical properties to the ECM, and also 29
play roles in cell adhesion and signaling predominantly via integrin binding [31]. Some of the most 30
abundant glycoproteins detected by LC/MS-MS were fibronectin, tenascin-C, fibulin-1, emilin-1 31
and thrombospondin-1. Collagens I, VI and XII as well as perlecan were identified as the most 32
abundant collagens and proteoglycans, respectively (Table I). Components of the core matrisome 33
were detected with a similar number of peptides and in comparable abundance across the 6 34
donors, suggesting that Bm ECM composition is consistent across biological replicates 35
(Supplementary Table I). 36
37
In addition to the core matrisome proteins, the ECM serves as a reservoir for regulators (i.e., ECM-38
remodeling enzymes, cross-linkers and protease inhibitors), secreted factors and other ECM-39
affiliated proteins. These proteins fall into the category of matrisome-associated proteins and are 40
less abundant than the core matrisome proteins (Fig 2A). Although more variation in the qualitative 41
composition of matrisome-associated proteins was observed among the donors, a common set of 42
matrisome-associated proteins was consistently found and includes cross-linkers such as 43
transglutaminase-2 and LOXL1/2, the ECM-remodeling enzymes cathepsin-B and matrix 44
metalloproteinase MMP-2, as well as the protease inhibitor serpine H1. These enzymes participate 45
in ECM arrangement by controlling the fine balance between stability and remodeling [32,33]. In 46
addition to these regulators, annexin A2 and galectins 1 and 3 were identified as ECM-affiliated 47
proteins. These proteins are associated with structural ECM proteins and regulate diverse cell 48
functions through downstream signaling. For example, the binding of annexin A2 to the 49
glycoprotein tenascin-C is believed to promote cell migration and mitogenesis through the loss of 50
cell adhesion [34]. 51
1
Finally, the ECM serves as a reservoir for numerous secreted factors that bind to core matrisome 2
proteins, including proteoglycans as well as ECM-associated proteins, and trigger various 3
signaling pathways [1]. On account of their small size, low abundance and higher solubility, they 4
may be partially lost during decellularization and their detection is more variable among the 5
donors. Thus, we have chosen to include the secreted factors detected in more than 3 donors in 6
Table I and they include the chemokine CXCL12 that is constitutively expressed in the bone 7
marrow, and responsible for bone-marrow stem-cell homeostasis regulation [35], as well as the 8
calcium-binding proteins S100A6/A10 implicated in various cellular processes such as cell 9
proliferation and differentiation through interactions with annexin A2 [36]. 10
11
12 13
Figure 2: Proteomic characterization of ECM produced by Bm MSC from different donors. 14
(A): Matrisome signature of Bm ECM. Pie chart represents the distribution of Bm ECM proteins by
15
percentage of total number for each matrisome protein sub-category. The average percentage ± SD for
16
each sub-category was calculated for the 6 donors and is presented in the parentheses. (B): Protein
17
distribution among donors. Columns represent the number of proteins for each matrisome sub-category
18
detected in all donors (black bars), 3 to 5 donors (white bars) or fewer than 3 donors (hatched bars). Proteins
19
represented by at least 1 peptide are included. Results were collected from two technical replicates of two
20 independent experiments. 21 22 23 24
A
B
C o lla g e n s G ly c o p ro te in s P ro te o g ly c a n s R e g u la to rs E C M -a ff ili a te d S e c re te d f a c to rs 0 10 20 30 N u m b e r o f p ro te in s 6 donors 3-5 donors <3 donors 16 19 5 6 3 11 9 4 3 3 6 2 14 4 Core matrisome Matrisome associated Core matrisome (%) Matrisome-associated (%) Glycoproteins (38±2) Collagens (23±2) Proteoglycans (8±1) Regulators (20±4) ECM-affiliated (7±1) Secreted factors (4±1)Table I: Bm ECM signature. The list shows the proteins identified in at least 5 donors or in at least 3 donors for the secreted factors. CORE MATRISOME PROTEINS
COLLAGENS
Fibril forming Network forming FACIT Beaded filament forming
Gene symbol Protein Gene symbol Protein Gene symbol Protein Gene symbol Protein
COL1A1/2 COL2A1 COL3A1 COL5A1/2 COL11A1 Collagen I α1/2 Collagen II α1 Collagen III α1 Collagen V α1/2 Collagen XI α1 COL4A1/2/5 COL8A1 Collagen IV α1/2/5 Collagen VIII α1 COL12A1 COL14A1 COL16A1 Collagen XII α1 Collagen XIV α1 Collagen XVI α1 COL6A1/2/3 Collagen VI α1/2/3 GLYCOPROTEINS
Major known Growth factor binding protein Vascular ECM proteins Other
Gene symbol Protein Gene symbol Protein Gene symbol Protein Gene symbol Protein
EFEMP2 EMILIN1 FBN1/2 FBLN1/2 FN1 MFAP2/5 POSTN THBS1/2 TNC Fibulin 4 Emilin 1 Fibulin 1/2 Fibrillin 1/2 Fibronectin Microfibrillar-associated proteins Periostin Thrombospondin 1/2 Tenascin C LTPB1 Latent TGF-β binding protein 1 FGB FGG VTN Fibrinogen β Fibrinogen γ Vitronectin AEBP1 EDIL3 MFGE8 MXRA5 PXDN TGFBI VWA1 AE-binding protein 1
EGF-like repeats and discoidin I-like domains 3
Milk fat globule-EGF factor 8 protein Matrix-remodeling associated 5 Peroxidasin homolog
TGF β-induced protein
von Willebrand factor A domain containing protein 1
PROTEOGLYCANS
Leucine-rich repeat (LRR) LINK Complex Hyalectans (LINK/CLEC/CCP)
Gene symbol Protein Gene symbol Protein Gene symbol Protein Gene symbol Protein
BGN DCN
Biglycan Decorin
HAPLN1 Hyaluronan and
proteoglycan link protein 1
HSPG2 Perlecan VCAN Versican
MATRISOME ASSOCIATED PROTEINS REGULATORS
Proteases Protease inhibitors Crosslinkers
Gene symbol Protein Gene symbol Protein Gene symbol Protein
CTSB HTRA1 MMP2
Cathepsin B
HtrA serin peptidase 1 Matrix metallopeptidase 2
SERPINH1 PZP
Serpin peptidase inhibitor, H1 Pregnancy zone protein
LOXL1/2 TGM2
Lysyl oxidase-like 1/2 Transglutaminase 2 ECM-AFFILIATED PROTEINS
Gene symbol Protein
ANXA2/5 LGALS1/3
Annexin A2/A5
Lectin galactoside-binding soluble 1/3 (Galectins) SECRETED FACTORS
Gene symbol Protein
S100A6/10 CXCL12
S100 calcium binding protein A6/10 Chemoxin C-X-C motif ligand 12
3.2.3. Quantitative proteomic characterization of ECM produced by Bm MSC from different donors
1 2
Quantitative proteomic approaches enable an accurate measure of relative protein amounts 3
between different samples [37,38]. Isobaric mass tag labeling or Tandem Mass Tag (TMT) labeling 4
was performed to evaluate the relative abundance of ECM proteins produced by Bm MSC from 5
different donors and thus gain a better understanding of Bm ECM composition consistency. This 6
method allows the measurement of relative expression levels of proteins in ECM derived from 7
different donors after labeling the peptides of each sample with a different chemical tag [39]. On 8
fragmentation during MS2, each tag releases a different mass fragment (see color code in Fig 9
3A), and quantification of these released fragments is exploited as the basis of the relative 10
quantification approach. Results are presented in Figure 3B in the format of a heat map, where 11
the colors indicate the relative protein expression level for each donor relative to the average 12
across the six donors (red are increased; blue are decreased). The coefficients of variation for 13
protein expression level across the different donors were 5.7%, 5.8%, 6.6%, 7.6%, 6.5% and 7.1% 14
for donor 1 to donor 6, respectively (average of 6.5%). All protein ratios were within a log2 fold 15
change range of -0.6 to 0.65 indicative of a relatively consistent protein profile across the six 16
donors. Thus, the TMT labeling suggests that Bm MSC isolated from different donors produce 17
similar ECMs, both qualitatively and quantitatively. 18
1 2
Figure 3: Quantitative proteomic analysis of the ECM produced by Bm MSC from six 3
donors. (A): TMT labeling experimental workflow. Each peptide solution is labeled with a specific TMT
4
reagent, samples are combined, and peptides are separated based on their mass-to-charge m/z ratios
5
(MS1). On MS2, peptides of particular m/z are selected, fragmented, and the different mass fragments are
6
released, enabling relative quantification. (B): Relative quantitative comparison among the six donors.
7
Proteins represented by at least 2 peptides are presented. Results show the fold-change (FC) in protein
8
detection levels normalized to the mean of all samples in log2 scale. Data were collected from two technical
9
replicates of two independent experiments.
10
A
B
Proteins Donor 1 Donor 2 Donor 3 Donor 4 Donor 5 Donor 6GLYCOPROTEINS EMILIN1 FBN1 FN1 FBLN1 POSTN TNC TGFBI THBS1 COLLAGENS COL1A1 COL2A1 COL3A1 COL4A1 COL5A1 COL6A1 COL8A1 COL11A1 COL12A1 COL16A1 COL1A2 COL4A2 COL5A2 COL6A2 COL6A3 PROTEOGLYCANS HSPG2 BGN Log2 REGULATORS TGM2 1.5 SERPINH1 1 LOXL1 0 LOXL2 -1 ECM-AFFILIATED LGALS1 -1.5 126 127 128 129 130 131 Mass reporter 126 Da Digested ECM samples from
six donors m/z In te n s it y MS1 Semi-quantitation Peptide selection, fragmentation, and release
of mass reporter ion
MS2
Peptide identification:
amino acid sequence
m/z In te n s it y
Mass reporter ion
Quantification
Reporter ion peaks are 1Da apart
1. Peptide labeling with TMT reagents
2. LC-MS/MS analysis TMT reagent Mass normalizer Reactive group Da Combine samples TMT Labeling cleavage site on fragmentation
1
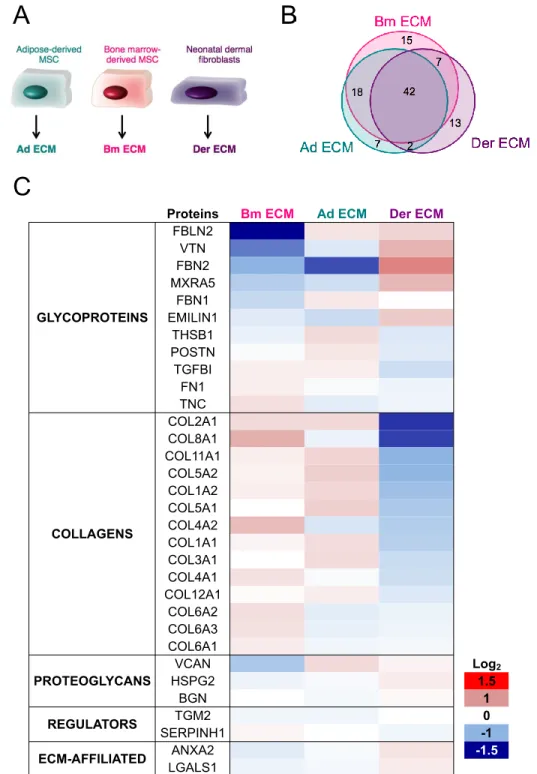
3.3. Comparison of the composition of ECMs produced in vitro by different cell types 2
3
As Bm MSC from different donors produce an ECM with a defined and consistent proteomic 4
composition, we investigated whether this ECM composition was unique to MSC originating from 5
the bone marrow or universal among different cell types. Adipose-derived MSC (Ad MSC) were 6
chosen in order to compare ECM produced by mesenchymal stem cells from a different tissue of 7
origin. Neonatal dermal fibroblasts (NHDF) were chosen as a different primary cell type from a 8
different tissue of origin (Fig 4A). ECM from Ad MSC and NHDF (Ad ECM and Der ECM, 9
respectively) were produced using the same experimental procedure as for Bm ECM and their 10
protein composition was compared, first qualitatively, then quantitatively, following the same 11
approach as described above. 12
13
The number of matrisome proteins detected for each sample was in the same range, despite a 14
lower peptide intensity signal for Der ECM compared to Ad ECM and Bm ECM, that might be 15
explained by the lower total mass of insoluble matrix produced by NHDF after 14 days 16
(Supplementary Fig 3). Qualitative analysis based on matrisome protein lists showed that ECM 17
from the cells originating from different tissue types contain a large set of common proteins that 18
represents 40% of the total protein number (Fig 4B). The overlap includes all collagens previously 19
found in Bm ECM, except for collagen 14 α1. The predominant glycoproteins detected in Bm ECM 20
were also identified in Ad ECM and Der ECM, as well as most of the proteoglycans. 21
22
Quantitative TMT labeling approach was applied to compare the relative protein abundance in the 23
three ECM samples, and significant tissue-type variations in the composition of the ECM were 24
observed (Fig 4C). Only proteins represented with at least two peptides were taken into account 25
for the analysis to guarantee more reliability, and this explained why 32 proteins were represented 26
on the TMT heat map (Fig 4C) while 42 proteins were qualitatively detected in all three matrices 27
(Fig 4B). 28
29
Der ECM was the most diverse of the three ECMs and a key observation was that Der ECM 30
possessed the lowest abundance of collagens, compared to ECM from both types of MSC. More 31
precisely, the amounts of collagens II and VIII were more than two times lower (log2 FC of 32
approximately -1.35), as well as for collagens XI and V whose quantities were halved (log2 FC of 33
approximately -1). Another observation was the differential levels of fibrillin-2 (FBN2) between the 34
three samples: high in Der ECM and low or very low in Bm ECM and Ad ECM, respectively. In 35
addition, fibulin-2 (FBLN2) and vitronectin (VTN) were three and two times less abundant in Bm 36
ECM. Some variations in FBLN2, COL8A1, COL4A1 and, to a lesser extent, VCAN expression 37
were also noted between Ad ECM and Bm ECM. In addition to the quantitative differences in the 38
common proteins, some proteins were detected in one ECM and not in the others (Table II). For 39
example, tenascin-X, a glycoprotein that is primarily expressed in loose connective tissues was 40
solely detected in Ad ECM [34]. The detailed composition of Ad ECM and Der ECM is available in 41
Supplementary Table II. 42
43
These data highlight that ECMs from different cell types are not identical but not totally discrete: 44
while sharing a large set of common proteins, each ECM presents some unique components that 45
may relate to the specialized functions of the tissue of origin. 46
1 2
Figure 4: Characterization of ECM produced by different cell types. (A): ECM from Bm MSC
3
(Bm ECM), Ad MSC (Ad ECM) and NHDF (Der ECM) were produced and characterized. (B): Venn diagram
4
of the overlap of protein numbers. (C): Quantitative proteomics using TMT labeling. Results show the
fold-5
change (FC) in protein detection levels normalized to the mean of all samples in log2 scale. Results were
6
collected from two technical replicates of two independent experiments and proteins identified with at least
7
2 peptides were considered.
8 9
Table II: Source-specific protein lists for ECM derived from the three cell types. Proteins
1
presented here were identified in the ECM of one cell-type and not detected in the others. For Bm ECM
2
proteins, only proteins present in at least 5 donors were considered (or in at least 3 donors for the
3 secreted factors). 4 5 6 Ad ECM
Gene Symbol Protein
Collagens COL15A1 Collagen XV α1
Glycoproteins FGL2 Fibrinogen-like 2
TNXB Tenascin XB
Regulators SERPINA5ITIH3 Inter-alpha (globulin) inhibitor H3Serpin peptidase inhibitor, clade A, member 5 Secreted factors SCUBE3 CTGF Signal peptide, CUB domain, EGF-like 3 Connective tissue growth factor
Der ECM
Glycoproteins
LTBP4 Latent transforming growth factor beta binding protein 4
MATN2 Matrillin 2
THBS3 Thrombospondin 3
THSD4 Thrombospondin, type 1 domain containing 4
Regulators
ADAMTS1 ADAM metallopeptidase with thrombospondin type 1 motif, 1
ADAMTSL4 ADAMTS-like 4
CD109 CD109 molecule
P4HA1 Prolyl 4-hydroxylase, alpha polypeptide I
PRSS12 Neurotrypsin
SERPINC1 Serpin peptidase inhibitor, clade C, member 1
Secreted factors
MDK Midkine
SFRP1 Secreted frizzled-related protein 1
WNT5A Wingless-type MMTV integration site family, member 5A
Bm ECM
Glycoproteins
AEBP1 AE-bindin prot. 1
EDIL3 EGF-like repeats and discoidin I-like domains 3
EFEMP2 Fibulin 3
FGB Fibrinogen β
FGG Fibrinogen γ
MFGE8 Milk fat globule-EGF factor 8 protein
VWA1 Von Willebrand factor A domain containing prot. 1
Collagens COL14A1 Collagen XIV α1
Regulators
CTSB Cathepsin B
LOXL1 Lysyl oxidase-like 1
MMP2 Matrix metallopeptidase 2
ECM-affiliated proteins
ANXA5 Annexin A5
LGALS3 Lectin galactoside-binding soluble 3
Secreted factors S100A6/10 S100 calcium binding protein A6/10
7 8
3.4. Cell response to ECM substrates 9
10
Proteomic analyses revealed that ECM from Ad MSC, Bm MSC and NHDF shared a large set of 11
common proteins, although significant variations in levels were detected for some proteins. Also, 12
each matrix presents specific proteins that were not detected in others. We hypothesized that the 13
differential ECM compositions might affect cell responses when cultured on each of the three cell-14 derived ECMs. 15 16 17 18
3.4.1. Effect of the different cell-derived ECMs on cell survival
1 2
To investigate how cells respond to the different matrices, we evaluated and compared the cell 3
number and cell morphology 72 h after seeding on each of the substrates, i.e., Ad ECM, Bm ECM, 4
Der ECM and TCPS (Fig 5). 5
All cell types plated on any of the ECM substrates showed a more aligned arrangement than on 6
TCPS that can be explained by the fibrillar ECM architecture (Fig 1B), which likely guides cell 7
morphology and migration [1]. Both types of MSC showed improved survival on cell-derived ECMs 8
compared to TCPS, as indicated by the 1.5 increase in cell number (Fig 5B). In addition, MSC 9
exhibited a different morphology on ECM compared to TCPS, with a more elongated shape and 10
a smaller size, which may be related to the higher cell density (Fig 5A). On the other hand, NHDF 11
survival was similar on TCPS as to the ECM-based substrates and NHDF do not exhibit significant 12
morphologic changes beyond collective alignment. 13
These data indicate that ECM impacts cells differentially depending on the cell type. While the 14
type of substrate does not affect NHDF survival, MSC number was significantly increased on 15
ECM-based substrates compared to TCPS, regardless of the cellular origin of the ECM. 16
17
18 19
Figure 5: Cell survival on the different matrices. (A): Fluorescence microscopy pictures with actin
20
cytoskeleton staining (Alexa Fluor® 488 Phalloidin) and cell nuclei (DAPI). Scale bar is 400 μm. (B): Cell
21
number relative to TCPS after 3 days in culture. Results show mean ± SD of two independent experiments
22
(n=6). Statistics were done using two-way ANOVA and Tukey’s post test (***p<0.001).
23 24
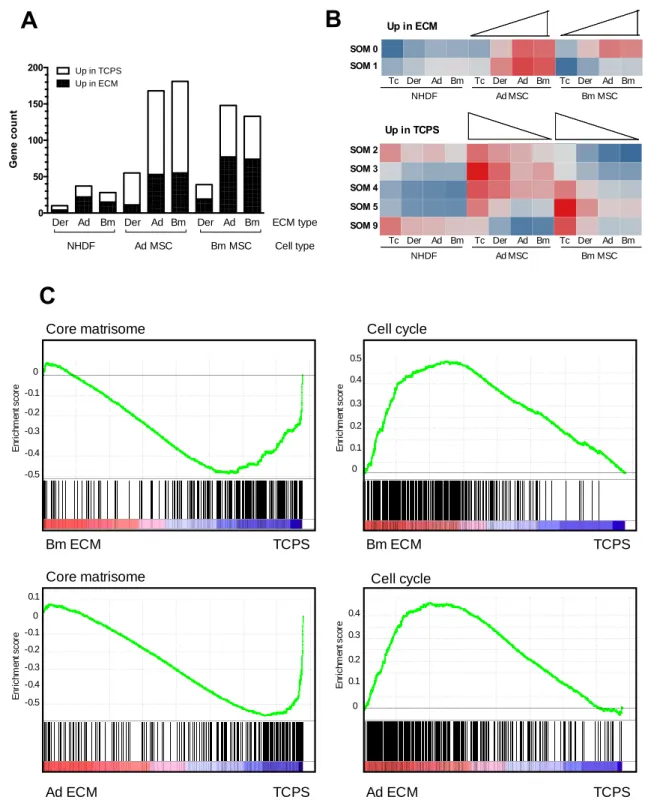
3.4.2. Cell-derived ECMs alter the cellular transcriptome
25 26
To investigate the effect of the substrates on the cell transcriptomes, RNA from the three cell types 27
(i.e., Ad MSC, Bm MSC and NHDF) was extracted after seeding the cells on each of the four 28
substrates (i.e., Ad ECM, Bm ECM, Der ECM, and TCPS) and the differential gene expression 29
was evaluated across the different samples. 30
31
Few genes were differentially expressed when NHDF were seeded on TCPS as compared to cell-32
derived ECM, indicating a limited impact of the substrate on NHDF transcriptome (Fig 6A). This 33
corroborates what was observed for cell growth and morphology. On the other hand, extensive 34
significant differential gene expression was observed when MSC (both Ad MSC and Bm MSC) 35
were plated on TCPS compared to ECM, suggesting that the signals from the substrate 36
significantly alter the overall transcriptome of both types of MSC. The differentially expressed 1
genes are detailed in Supplementary Table IV. 2
310 genes with differential expression (abs log2FC≥1, p-value≤0.05) in at least one of the three 3
comparisons (Ad ECM versus TCPS, Bm ECM versus TCPS, or Der ECM versus TCPS) for at 4
least one of the three cell types were selected for self-organizing map (SOM) clustering in order 5
to characterize the response of these genes in all comparisons. Clustering algorithms are 6
designed to elucidate general patterns in large data sets by grouping similar elements together 7
[40]. Here, the differentially expressed genes were grouped into 13 clusters that explained 81% of 8
the variance of the data. We focused our attention on the clusters in which differential responses 9
for Bm MSC on disparate matrices were observed. This corresponds to 7 different clusters that 10
displayed two main patterns: i) genes up-regulated in Bm MSC on MSC-derived ECM (Fig 6B 11
upper panel); and ii) genes expressed at a lower level in Bm MSC on MSC-derived ECM (Fig 6B 12
lower panel). The genes assigned to each of the cluster represented in Fig 6B are listed in 13
Supplementary Table V. For both Bm MSC and Ad MSC, the responses to MSC-derived ECM 14
(i.e., Bm ECM or Ad ECM) were similar to one another, while the response to Der ECM was 15
intermediate between MSC-derived ECM and TCPS. As seen in Fig 6B, little variation across the 16
NHDF samples was observed using SOM clustering. 17
18
We then looked at the genes differentially expressed by MSC (both Ad MSC and Bm MSC) on 19
their own ECM compared to TCPS, and similar gene-set enrichments were observed for both cell 20
types (Fig 6C and Supplementary Table VI). The leading edge genes responsible for the 21
enrichment are listed in Supplementary Table VII. Of the genes more highly expressed on TCPS, 22
a large set encode ECM and ECM-associated proteins, as well as proteins involved in cell 23
adhesion (e.g., ITGAV, ITGB8, CD36 or FGFR2). Increase in mRNA expression of ECM proteins 24
was validated by real time PCR for a subset of ECM proteins (Supplementary Figure 5A). Flow 25
cytometric analyses for cell surface receptors did not show differential expression, except for a 26
slight increase in ITGAV when Bm MSC were grown on TCPS compared to Bm ECM 27
(Supplementary Figure 5B). On the other hand, genes that regulate cell division were over-28
expressed by MSC on cell-derived ECM as compared to TCPS (Fig 6C and Supplementary Table 29
V). In addition to genes involved in cell cycle, genes involved in MSC mobility and migration (e.g., 30
genes coding for the CXCL chemokine family members, matrix proteases, PREX-1, GNG2) were 31
up-regulated when cells were on MSC-derived ECM versus TCPS. 32
1 2
Figure 6: Influence of the substrate on the cell transcriptome. (A): Differentially expressed genes
3
when Ad MSC, Bm MSC and NHDF were cultured on the different ECM compared to TCPS, with the
4
threshold of log2 FC≥1 and p<0.05. (B): Gene response clustering with self-organizing maps (SOM). Each
5
row corresponds to a different gene cluster. Red represents up-regulation and blue represents
down-6
regulation (C): Enrichment plots for core matrisome gene set (left) and cell cycle KEGG pathway (right) in
7
MSC on their own ECM versus TCPS (Bm MSC top, Ad MSC bottom). Green curve indicates the enrichment
8 score. p-values <0.002. 9 0 50 100 150 200 G en e c o u n t Up in ECM Up in TCPS NHDF Ad MSC Bm MSC Cell type ECM type Ad Bm
Der Der Ad Bm Der Ad Bm
0 -0.5 -0.4 -0.3 -0.2 -0.1 Bm ECM TCPS E n ri c h m e n t s c o re Core matrisome D E G _ S O M _ A s s ig n m e n t, G ro u p A v g (A v g (F T C av .r c )) A v g (A v g (F D R a v.r c )) A v g (A v g (F A D av .r c )) A v g(A vg (F B M a v.r c )) A v g(A vg (B TC a v.r c )) A v g (A v g (B D R a v.r c )) A v g(A vg (B A D a v.r c )) A v g (A v g (B B M a v .r c )) A v g(A vg (A T C av .r c )) A v g (A v g (A D R a v.r c )) A v g(A vg (A A D a v.r c )) A v g (A v g (A B M a v .r c )) YesNo YesNo NoYes NoYes NoYes NoYes NoYes 0 1 2 3 4 5 9 Data table: DEG_SOM_Avs Colors Max (2.12) Average (0.00) Min (-1.64)
A
C
D E G _ S O M _ A s s ig n m e n t, G ro u p A v g (A v g (F T C av .r c )) A v g (A v g (F D R a v. rc )) A v g (A v g (F A D av .r c )) A v g(A vg (F B M a v. rc )) A v g(A vg (B TC a v. rc )) A v g (A v g (B D R a v. rc )) A v g(A vg (B A D a v. rc )) A v g (A v g (B B M a v. rc )) A v g(A vg (A T C av .r c )) A v g (A v g (A D R a v. rc )) A v g(A vg (A A D a v. rc )) A v g (A v g (A B M a v. rc )) YesNo YesNo NoYes NoYes NoYes NoYes NoYes 0 1 2 3 4 5 9 Data table: DEG_SOM_Avs Colors Max (2.12) Average (0.00) Min (-1.64) Up in ECM Up in TCPS Ad Ad Ad NHDF Ad MSC Bm MSC Ad Ad Ad Bm ECM TCPS 0.5 0 0.1 0.2 0.3 0.4 E n ri c h m e n t s c o reB
0 0.1 0.2 0.3 0.4 E n ri c h m e n t s c o re Cell cycle Ad ECM TCPS E n ri c h m e n t s c o re Core matrisome 0 -0.5 -0.4 -0.3 -0.2 -0.1 0.1 Ad ECM TCPS Cell cycle NHDF Ad MSC Bm MSC Bm Der Tc Bm Der Tc Bm Der Tc Bm Der Tc Bm Der Tc Bm Der Tc SOM 0 SOM 1 SOM 2 SOM 3 SOM 4 SOM 5 SOM 91
4. Discussion 2
3
In the body, stem cells are in constant and intimate contact with the ECM. This matrix 4
serves not only as a structural support, but as a reservoir of many biochemical and mechanical 5
signals that are transduced via cell surface receptor-protein interactions and influence cell 6
signaling pathways and dictate cell functions [1]. ECM components are at the center of this 7
complex interplay and have a vital role in regulating physiological processes. During standard cell 8
culture, stem cells are isolated from their native microenvironment (i.e., the stem-cell niche), and 9
need to adapt to a polymeric surface where ECM signals are limited to the serum proteins in the 10
medium or adsorbed proteins on the plastic surface. This environment has been shown to affect 11
cell biology; MSC cultured on ECM substrates compared to those on TCPS displayed different 12
biologic features that impact cell morphology, motility and proliferation as well as, in other reports, 13
differentiation [10,11]. In the context of stem cell biology, it is critical to decipher how individual 14
ECM components regulate specific stem cell functions to better comprehend the natural role of 15
the ECM. Understanding cellular processes requires a robust characterization of the ECM’s 16
molecular composition. In addition, this understanding will provide further insight for the rational 17
design of ECM mimicking biomaterials for tissue engineering and regenerative medicine 18
[18,41,42]. 19
By employing a proteomic approach, we were able to provide a comprehensive 20
characterization of the molecular composition of ECM produced in vitro by bone marrow-derived 21
MSC (Bm ECM), adipose-derived MSC (Ad ECM) and human neonatal dermal fibroblasts (Der 22
ECM). The analysis of Bm ECM of MSC from 6 different donors revealed a complex yet consistent 23
protein composition. Specifically, the composition of these cell-derived ECMs (approximately 80 24
unique ECM and ECM-associated proteins) is rather complex as compared to protein-based 25
substrates, which often comprise a surface coating of one or two proteins, and are sometimes 26
employed for stem cell culture as an alternative to TCPS. The variance of protein expression 27
across the Bm ECM formed by cells from the 6 different donors was relatively low (log2 fold change 28
range of -0.6 to 0.65) indicative of a consistent matrix formed by Bm MSC from different donors. 29
However, when the proteomic composition of Bm ECM was compared to Ad ECM and Der ECM, 30
a distinct signature was observed for each of the three cell-derived matrices. Despite the sensitivity
31
and precision of TMT labeling techniques, underestimation of protein abundance differences by a
32
factor of 20 to 30% can occur due to ratio compression phenomena [43,44] and real effect sizes
33
might be larger than what was measured. High-resolution techniques as well as correction
34
algorithms have been developed to minimize the ratio compression and help detect subtle
35
variations between samples.
36
The major proportion of Bm ECM proteins belongs to the core matrisome that includes 37
collagens, glycoproteins and proteoglycans. A large variety of collagens were detected in Bm 38
ECM, of which the fibrillar family was the most abundant (i.e., collagens I, II, III, V and XI) that are 39
known to contribute to the molecular architecture and mechanical properties of many tissues [45– 40
47]. In addition, Fibril Associated Collagens with Interrupted Triple helices (FACIT) collagens that 41
associate to the surface of fibrillar collagens were identified (collagens XII and XIV that associate 42
with fibrillar collagen I to facilitate fibril thickening), along with network-forming collagens (collagen 43
IV) and beaded-filament forming collagens (collagen VI) [45]. The presence of collagens in the 44
ECM was associated with proteinases that specifically degrade collagens (MMP-2 that lyses 45
collagens I, IV, V) as well as collagen cross-linkers such as the LOX-like family members [48]. 46
While Bm ECM and Ad ECM present a similar collagen composition, the expression level of 47
collagens in Der ECM was overall lower. Dermal tissues are elastic, while collagens confer 48
stiffness and strength to tissues, as the collagen fibers have a high capacity for energy storage 49
but minimal elasticity as a consequence of their semi-crystalline packing [45,49,50]. In addition, 50
overall glycoprotein levels were found to be increased in Der ECM compared to Ad ECM and Bm 51
ECM, although differences in the levels of specific glycoproteins (e.g., fibulin-2) were observed 1
between both MSC-derived ECMs. These glycoproteins are implicated in the ECM structural 2
organization and have somewhat restricted tissue distribution [51]. For example, a major function 3
of fibulin-2 is the formation of large proteoglycan networks and its overexpression in Ad ECM and 4
Der ECM might be responsible for different ECM macromolecular architectures, compared to Bm 5
ECM. Similarly, fibrillins form microfibrils that provide tissue with long-range extensibility and 6
associate with elastic fibers [52,53]. The different ratios of core matrisome proteins lead to different 7
supramolecular assemblies that might ultimately provide the matrices with different mechanical 8
properties [49,50,54]. 9
In addition to the core matrisome ECM proteins, numerous other proteins that contribute 10
to ECM function and dynamics were detected. Regulators maintain a balance between ECM 11
stability and dynamic remodeling by degrading proteins (e.g., cathepsin B, Adamalysin ADAMTS 12
that degrade fibronectin and collagen IV, or sulfatase SULF1 that cleaves proteoglycans and 13
removes GAG chains) or by modifying ECM topography through protein crosslinking (e.g., TGM2 14
and LOX). ECM remodeling promotes cell movement and migration, and the released proteolytic 15
fragments may also play a role in cell signaling [32]. These proteases are tightly regulated at the 16
transcriptome level, and some of them are secreted as pro-enzymes that require extracellular 17
activation. This is the case for the matrix metalloproteinase MMP-2 that needs to be activated by 18
other proteinases to be functional, such as the transmembrane type MMP-14, also identified in 19
Bm ECM [33]. Proteinases can be inactivated by protease inhibitors such as TIMP3 and A2M 20
found in Bm ECM. While several proteases were identified in Bm ECM, Ad ECM and Der ECM, it 21
is not clear from these data what their relative activity is and on-going work is characterizing their 22
role in ECM remodeling during stem cell culture. 23
Interestingly, ECM impacts different cells in different ways. Human neonatal dermal 24
fibroblasts survive as well on TCPS as on cell-derived ECM, and minimal changes at the RNA 25
levels were observed, suggesting that this cell type is negligibly impacted by the substrate over 26
72 h. In contrast, MSC number was significantly increased on ECM compared to TCPS as well as 27
to a fibronectin-coated substrate (unpublished data), indicating that a synergy of multiple proteins 28
is advantageous. Interestingly, the differences among the compositions of ECMs from different 29
tissue types do not seem to affect MSC survival, as the cell number was similarly increased on 30
each ECM. This suggests that MSC survival depends more on the common core of proteins than 31
on the unique proteins expressed in each of the cell-derived ECM. However, the different ECMs 32
might affect other cell functions that were not investigated in this study. Future work will focus on
33
the secretome, another major regulator of MSC fate.
34
Transcriptomic analysis revealed that the culture of MSC on TCPS induces an up-35
regulation of genes that code for ECM and ECM-associated proteins as well as proteins implicated 36
in cell adhesion as compared to MSC on cell-derived ECM. On the other hand, NHDF seem less 37
affected by the type of substrate they are seeded on. One hypothesis is that MSC on TCPS are 38
more sensitive to certain ECM signals than other cell types, such as NHDF. In addition, MSC 39
population was increased on ECM and the cells over-express several genes implicated in cell 40
cycle regulation and migration. Interactions with ECM and its components impact MSC function 41
compared to TCPS where MSC receive restricted molecular cues. Perhaps, the lack of pertinent 42
ECM signals at early time points during TCPS culture or the relative cost of construction of a new 43
ECM is responsible for the lower number of MSC on TCPS as compared to cell-derived ECM. 44
45
5. Conclusions 46
47
In conclusion, we characterized the molecular composition of ECM deposited in vitro by bone 48
marrow-derived MSC as well as adipose-derived MSC and neonatal dermal fibroblasts. While the 49
three matrices share a set of common proteins, each ECM displayed distinct features specific to 50
the tissue of origin that might be related to specialized tissue functions. MSC derived from bone 51