Publisher’s version / Version de l'éditeur:
Geotechnique, 37, 2, pp. 177-190, 1987
READ THESE TERMS AND CONDITIONS CAREFULLY BEFORE USING THIS WEBSITE. https://nrc-publications.canada.ca/eng/copyright
Vous avez des questions? Nous pouvons vous aider. Pour communiquer directement avec un auteur, consultez la première page de la revue dans laquelle son article a été publié afin de trouver ses coordonnées. Si vous n’arrivez pas à les repérer, communiquez avec nous à PublicationsArchive-ArchivesPublications@nrc-cnrc.gc.ca.
Questions? Contact the NRC Publications Archive team at
PublicationsArchive-ArchivesPublications@nrc-cnrc.gc.ca. If you wish to email the authors directly, please see the first page of the publication for their contact information.
NRC Publications Archive
Archives des publications du CNRC
This publication could be one of several versions: author’s original, accepted manuscript or the publisher’s version. / La version de cette publication peut être l’une des suivantes : la version prépublication de l’auteur, la version acceptée du manuscrit ou la version de l’éditeur.
Access and use of this website and the material on it are subject to the Terms and Conditions set forth at
Preconsolidation pressure from piezocone tests in marine clays
Konrad, J. M.; Law, K. T.
https://publications-cnrc.canada.ca/fra/droits
L’accès à ce site Web et l’utilisation de son contenu sont assujettis aux conditions présentées dans le site LISEZ CES CONDITIONS ATTENTIVEMENT AVANT D’UTILISER CE SITE WEB.
NRC Publications Record / Notice d'Archives des publications de CNRC:
https://nrc-publications.canada.ca/eng/view/object/?id=f6c678b4-df9d-4649-8e53-338bdee7bed1 https://publications-cnrc.canada.ca/fra/voir/objet/?id=f6c678b4-df9d-4649-8e53-338bdee7bed1Ser
TH1
National Research Consell natlonal
N21d
l*I
Council Canada de recherches Canadano.
1551
c . 2 Institute for lnstitut de
BLDG Research in recherche en
Construction construction --
Preconsolidation Pressure from Piezocone
Tests in Marine Clays
by J.-M. Konrad and K.T. Law
Reprinted from Gkotechnique Vol. 37, No. 2, 1987 p. 177-190
(IRC Paper No. 1551)
NRCC 29196
I
llRC-usmT h i s paper
is
being d i s t r i b u t e d i n r e p r i n t
form by
t h e I n s t i t u t e f o r Research i n
C o n s t r u c t i o n .
Al i s t
of
b u i l d i n g p r a c t i c e
and r e s e a r c h p u b l & c a t i o n s a v a i l a b l e from
t h e I n s t i t u t e may be o b t a i n e d by w r i t i n g t o
t h e P u b l i c a t i o n s S e c t i o n ,
I n s t i t u t e f o r
Research i n C o n s t r u c t i o n , N a t i o n a l Research
C o u n c i l
of
C a n a d a ,
O t t a w a ,
O n t a r i o ,
KIA
0R6.
-Ce document
e s t
d i s t r i b u 6 sous forme de
t i r 6 - a - p a r t
p a r 1 ' I n s t i t u t de r e c h e r c h e e n
c o n s t r u c t i o n .
On
peut o b t e n i r une
l i s t e
d e s p u b l i c a t i o n s d e 1 ' I n s t i tu t por t a n t s u r
les
t e c h n i q u e s ou
les
r e c h e r c h e s e n
matiere
d e b l t i m e n t en 6 c r i v a n t
3
l a S e c t i o n d e s
p u b l i c a t i o n s -
I n e i t u t da maehercheen
c o n s t r
r e c h e r
K I AOE
Konrad, J.-M. & Law, K. T. (1987). Gi.otechnique 37, No. 2, 177-190
Preconsolidation pressure from piezocone tests in marine clays
J.-M. KONRAD* and K. T. LAWtPiezocone penetration tests were carried out at five sites in marine clay with overconsolidation ratios ranging from 1.3 to 4-8. A simple model for the behaviour of these clays indicates that the effective vertical yield stress mobilized along the cone axis during penetration is equal to the difference between the actual induced total vertical stress in the soil and the total porewater pressure. The actual induced total vertical stress can be derived from piezocone test data. Theoretically the ratio of the vertical yield stress inferred from piezocone results and the preconsolidation pressure should correlate with the overconsolidation ratio. This hypothesis is supported by the field and laboratory investigations presented in this study.
KEYWORDS: laboratory testing; piezocone; preconsoli- dation pressure; yield envelope.
INTRODUCTION
The preconsolidation pressure of marine clays is an important characteristic for the design of foun- dations on these soils, which are widespread in eastern Canada. Casagrande (1936) defined the preconsolidation pressure a,' as the 'largest over- burden beneath which the soil had once been consolidated'. The preconsolidation pressure that can be determined in the laboratory from oedom- eter tests on undisturbed samples is also depen- dent on the type and the procedure of testing, however (Crawford, 1964). Therefore, the precon- solidation pressure a,' actually refers to the break in the oedometer curve and represents a yield stress that separates small strains from large strains. o,' is also affected by sample disturbance, and the determination of a complete profile of preconsolidation pressure with depth may require a substantial amount of time and testing.
These disadvantages may be overcome by using an in situ testing device such as the piezocone penetrometer, which produces contin- uous profiles of cone resistance and porewater
Discussion on this Paper closes on 1 October 1987. For further details see p. ii.
* University of Waterloo; formerly Institute for Research in Construction, Ottawa.
7 Institute for Research in Construction, Ottawa.
Des essais de pknetration avec un piezocone ont ete effect& sur cinq sites d'argile marine ayant des rapports de surconsolidation variant de 1,3 a 4,8. Un modele simple de comportement de ces argiles indique que la contrainte effective verticale a I'etat limite mobiiisb durant la pknetration est egale a la difference entre la contrainte totale verticale et la pression interstitielle g e n b k s dans le sol. La con- trainte totale verticale peut Ctre determide a partir des h u t t a t s des essais de piezocone. En theorie, le rapport de la contrainte verticale a l'etat limite, calculke a partir des rksultats du piezacone, et de la pression de surconsolidation dewait Ctre une fonction du rapport du surconsolidation. Cette h y p o t b est verifib par les essais in situ et de laboratoire p r k n t b dam cet article..
pressure induced during the penetration. These results or derived parameters may then be corre- lated with the stress history of the deposit. Senne- set, Janbu & Svano (1982) suggested the use of the ratio Au/(q,
-
a,), denotcd byB,,
as the stan- dard parameter for interpretation of piezocone data, where Au represents the induced excess porewater pressure, q, is the corrected total cone resistance and a, is the initial total vertical stress, i.e. the overburden pressure. Limited data, avail- able in the literature (Lacasse & Lunne, 1982; Jamiolkowski, Ladd, Germaine & Lancellotta, 1985), indicate that B, can be correlated with reli- able data of overconsolidation ratios OCR.The aim of this Paper is to investigate the potential use of piezocone test data for determin- ing the stress history of marine clay deposits. It reviews available interpretation methods, using piezocone test results carried out on five different sites of low to moderate overconsolidated clays (OCR
<
4.5), and also presents a simple model based on elasto-plastic behaviour of the soil, which relates the effective vertical yield stress induced during penetration to quantities that can be derived from piezocone test data. The pro- posed interpretation yields a profile of effective vertical yield stress that is compared with the pre- consolidation pressure obtained from laboratory oedometer tests on samples of different size. An empirical correlation relating these stresses to the178 KONRAD AND LAW
Table 1. Typical values of the properties of the clay studied
overconsolidation ratio summarizes the experi- mental data obtained at the sites reported in this study. Soil property Water content: % Plastic limit: % Liquid limit: % Plasticity index: % Clay content: % Sensitivity a,'/%' Ground elevation: m DESCRIPTION O F SITES
For this study, five sites were selected in the St Lawrence Lowlands in eastern Canada. These marine clay deposits are located at Gloucester (Ontario), Saint-Marcel (Quebec), Varennes (Quebec), National Research Council of Canada Ottawa Campus (denoted NRCC) (Ontario) and the Ottawa sewage treatment plant (denoted STP) (Ontario).
Gloucester site
The Gloucester site is 21 km south-east of Ottawa. It is a deposit of highly sensitive, soft Champlain Sea clay formed in different stages of erosion and deposition (Bozozuk & Leonards, 1972). The clay is about 21 m thick and is under- lain by glacial till. It is slightly overconsolidated, with an OCR of about 1.5. The plasticity index ranges from 20% to 30%, and the average clay content is about 80%.
Saint-Marcel site
The Saint-Marcel site is approximately 100 km north-east of Montreal, on the south shore of the St Lawrence River. A detailed geotechnical inves- tigation reported by Lefebvre & Langlois (1982) shows that the soil profile consists of 1.5 m of weathered crust of silty clay underlain by a thick deposit of light greyish clay. The natural water content in the clay is about SO%, which is 1 5 2 0 % higher than the liquid limit. The OCR ratio is 1.8 at 2 m depth and decreases slightly with increasing depth to reach a constant value of 1.3 at 7 m below ground surface.
Gloucester 80 27 55 28 80 100 1.5 80 Varennes site
The Varennes site is about 20 km east of Mon- treal on the property of N.L. Chem Canada Inc.
St Marcel 80 25 60 35 80 30 1.3-1-8 -
The original ground surface is at an elevation of approximately 14 m. The stratigraphic profile has been studied by Casagrande, Firing, Schoof & Turcke (1965) and Samson, Leroueil, Morin & Le Bihan (1981). Beneath a layer of dense fill 90 cm thick is a stratum 1-24 m thick of loose silty fine sand and clayey silt. Below this stratum lies a deposit of grey clay 14 m thick.
The natural water content ranges from 55% to 65% and the liquid limit from 64% to 80%. Oedometer tests reveal that the preconsolidation pressure a,' is about 200 kPa for depths between 4 m and 8 m and increases steadily below 8 m. The OCR varies thus between 4.9 at 4 m and 2.5 near the bottom of the clay layer.
STP 70 25 55 30 66 W 5 0 0 2 . H . 5 53 Varennes 60 22 62 40 - 20 2 4 - 4 9 14
National Research Council of Canada site
The NRCC site is in an open field within the Montreal Road campus of the NRCC. The subsoil profile consists of Champlain Sea clay underlying a fissured crust 7 m thick. The natural water wntent is about 80% at a depth of 7 m and 60% 17 m below ground surface. It is over- consolidated, with OCR values ranging between 1.7 and 3.7 (Eden & Hamilton, 1956). For the upper 10 m the sensitivity is relatively low but is extremely high (greater than or equal to 200) below a depth of 12 m. NRCC 80 25 60 35 70 10-500 1.7-3.7 61
Sewage treatment plant site
The STP site is along the Ottawa River at the eastern outskirts of the city of Ottawa, in an extensive clay plain with a surface elevation of 53 m. The soil profile down to the underlying glacial till consists entirely of Leda clay (Eden, 1970). From the surface down to 2.5 m the clay is friable and oxidized. From 2.5 m to about 14 m the clay is fairly stiff, with a sensitivity of about 20. Below 14 m the clay becomes slightly coarser, the natural water content is 50% and the sensitivity increases dramatically, being of the order of 1000 at 17 m. The clay is overwnsolidated by about 400 kPa. Table 1 presents a summary of typical values of the properties of the clay studied.
PRECONSOLIDATION PRESSURE IN MARINE CLAYS 179 q, and u kPa 0 200 400 600 800 1000 1 12- 1 4 - 1 6 - q, and u: kPa
I&
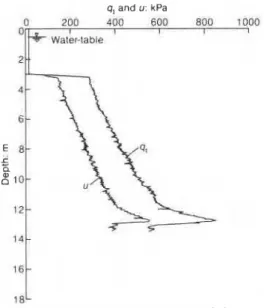
l a LFig. 1. Piezocow profiles at the Gloucester site Fig. 2. Piezocooe profiles at the Saint-Marcel site
PIEZOCONE TEST RESULTS
Electric G M F 25 kN and 50 kN cone pen- etrometers fitted with 60' tapered, 10 cm2 area cones were used to measure tip resistance q, and sleeve frictionf,. The porewater pressures u were measured through a cylindrical porous stone 4 mm thick located immediately above the conical tip. Water pressures can act over a part of the base area of the cone in a direction opposite to the resisting forces developed during pushing; thus the measured total stress q, will be reduced. To obtain the actual total stress q , , a correction must be applied to account for the design of the cone. This correction is done directly by the com- puter during data processing for each set of read- ings, using the relationship
1
In soft soils the tip loads are only about 2-4% of the design capacity of the cone, and consider- able care in the testing procedure is required to obtain meaningful data, as discussed by Konrad (1986). The rate of penetration for all tests in this study was 1 cm/s. At this rate one set of readings could be obtained for every 2 cm of penetration.The profiles of q, and u for the five sites are presented in Figs 1-5. The water-table is also indicated in these figures. From these profiles soil layers and silt and/or sand lenses can be identi- fied. For the Gloucester site (Fig. l), the q, and u profiles increase uniformly with depth and clearly define the boundary between the clays of different water contents at 7 m and 14 m, as reported by Bozozuk & Leonards (1972). The piezocone test results from the Saint-Marcel site (Fig. 2) indicate
clearly the homogeneity of the clay deposit. At the Varennes site (Fig. 3), the piezocone profiles show a relatively uniform clay deposit with some stronger layers at 4.4 m, 5.0 m, 5.5 m and 7.3 m. The pore pressure profile does not indicate drain- ing layers, suggesting that these layers may be siltier clayey soils, which is in agreement with the results of Casagrande et al. (1965).
The profiles at the NRCC site (Fig. 4) show a surface crust to a depth of about 8 m in which the pore pressure generated during driving decreases slightly with depth. Two distinct layers are
q, and u. kPa
200 4 0 0 600 800 1000 1200 1400
I 1
*
Water-Iabre18
KONRAD AND LAW
q, and u kPa EVALUATION OF AVAILABLE
0 200 400 600 BOO 1000 INTERPRETATION TO DETERMINE OCR
0 1 I I
+
Waler-table When the use of the static cone test was intro-2 4 6 E 8" 5 a
0"
10- 12 1 4 - 16--
duced for investigating clay deposits only the7 cone resistance q, was measured and correlated
with OCR. Schmertmann (1978) recommended
-
that the approximately linear increase in q, with-
depth observed in many natural homogeneousclay deposits could be extrapolated back to the depth axis to obtain an estimate of the position of the original ground surface and, consequently, of
OCR with depth.
The suggested thickness of removed earth by erosion is about 3 m for the Gloucester site, 4.5 m -
at Saint-Marcel, 9 m at Varennes, 3 m at NRCC
and 9 m for the STP site. There is no systematic correspondence between the value of the esti- mated OCR and the OCR obtained from undis-
turbed samples. This lack of correlation is
Fig. 4. Piezocone profiles st the NRCC site
probably due to the fact that the processes leading to overconsolidation, i.e. erosion, ageing, detected below the crust: the first, relatively thin, chemical and dynamic actions, lowering of water- extends to a depth of 10.5 m and corresponds to table, freezethaw cycles, are not adequately con- a water content of about 70%. Below this layer, sidered in this method. Tavenas & Leroueil(1979) the average water content is only about 60%. argued that the cone resistance is a measure of Finally, both q, and u profiles at the STP site limit state stress conditions or of limit state (Fig. 5) increase linearly with depth between 5 m related to deformation characteristics and is and 12 m. Below 12 m, q, and u decrease slightly related to the preconsolidation pressure a,'. In with depth. According to Eden (1970) the boun- Champlain clays they suggested that the ratio dary between moderately sensitive and extremely q,/a; is about 3. The analysis of the results sensitive clay at this site is found approximately obta~ned in this study indicates that the value of at 13 m, which is in close agreement with the qJa; varies between 3.8 and 5.3 at Gloucester, boundary obtained from piezocone data. between 5 and 5.3 at Saint-Marcel, between 4.0 and 4.8 at Varennes, between 4.3 and 4.6 at
q, and u kPa NRCC, and between 3.5 and 3.8 at the STP site.
1000 2000 3000 While there is merit in using the framework of the
o0
4 6 E E ad
I O - 1 2 - 1 4 - 16- 18-I I limit state theory to derive OCR, the experimen-
tal data suggest that additional soil character-
-
Water-table istics are required to link the ratio q Ja,' to OCR.& .=. With the advent of piezocones a considerable variety of empirical relationships based on the measured cone resistance with or without correc- tion for pore pressure effects and total or excess
%$
pore pressure have been proposed to obtain+ OCR. It is accepted that the pore pressure at
8 -
g21
failure is related to a change in octahedral normal$,
ql stresses Aa,,, , shear stresses, AT,,, (Henkel, 1960)
and also to OCR. Since the actual Aa,,, and AT,,,
around the piezocone are not known at present, Senneset et al. (1982) proposed to use the ratio
Au/(q,
-
a,) denoted by B, to correlate with theut
2
overconsolidation ratio.Values of B, derived from information avail- able in the literature have been plotted against the relevant value of OCR (Fig. 6). Some sites
%>
such as Bnsey, Pontida and Boston show's ten-dency for the dimensionless ratio B, to decrease with increasing OCR. However, the value of B, is Fig. 5. Piezocone profiles st the STP site dependent on soil type at least for these three
PRECONSOLIDATION PRESSURE IN MARINE CLAYS 181
gnsey: Lacasse B Lunne (1 979) A St Alban: Roy et a1 (1 982)
0 Porlo Tolle: Jamiolkowski el a/. (1985)
0 Pontids: Jamiolkowski et a/. (1 985) Baston Blue Clar. Jarn~olkowsk~ e l el.
0- I I I
1 3 5 7
OCR
Fig. 6. Pore pressure coefficient B ,versus OCR from available data
sites. Furthermore, even within the same deposit B, may vary, as indicated by the tests at Porto Tolle. Jamiolkowski et al. (1985) suggested that the irregular trend in B, versus depth is probably due to the presence of more pervious lenses and layers. At the Saint-Alban site (Fig. 6), for an almost constant OCR with depth, the value of B, increases continuously from 0.5 to 0.6.
The data obtained during cone testing are stored on tape, which enables efficient and flexible processing after completion of a sounding. Figs 7
and 8 present the value of B, for each sounding at the various sites of this study. Over the first 6-8 m of penetration, there is a general tendency of B, to increase with depth and to remain almost con- stant thereafter. As shown in Fig. 9, the values of B, for these different clays range between 0.4 and 0.82. At some sites an apparent relationship with OCR can be observed, but at the Gloucester and STP sites the trend is not clearly defined.
The review of existing data and the interpreta- tions of the test results of the present investiga- tion indicate that no unique relationship between B, and changes in OCR should be expected. Even within a given clay deposit, changes in B, may not necessarily reflect changes in OCR, which indicates that B, is not sufficiently sensitive to correlate successfully with OCR.
THEORETICAL CONSIDERATIONS
Baligh (1975) pointed out that undrained pen- etration of a cone in saturated clays is essentially strain controlled and causes significant shearing
Fig. 7. Pore pressure coefficient B, versus depth at Glou- cester and Saint-Marcel
and distortion of the surrounding soils. More- over, the strain field around the cone varies with distance from the cone. As a result, the total and effective stresses, and hence the pore pressures, also vary, depending on their location. Further- more, except for soil elements close to the vertical cone axis where the problem is axisymmetric, the principal axes of stress rotate within the soil. Thus, to solve the penetration problem from sim-
N RCC campus 7 1
-=/-
6-E
8 - s 8 1 0 - 12- 14- STP Ottawa 1 6 -Fig. 8. Pore pressure coefficient B, versus depth at
182 KONRAD AND LAW
X X
.
-0----m 0 Varennes
Fig. 9. Pore pressure coefiicient B, versus OCR from data from this study
0.2
0
plified strain fields, a realistic soil model including
rotation of principal stresses must be used. Such a
model is not readily available.
Consequently, engineers still seek alternative methods of cone test interpretation based on empirical correlations with data from other labor- atory or field tests. Wroth (1984) correctly stated that any successful relationship should ideally be
-
A NRC x STPSt Marcel
I 1 I I I
(a) based on a physical appreciation of why the
properties can be expected to be related
(b) set against a background of theory, however
idealized this may be
(c) expressed in terms of dimensionless variables.
1 2 3 4 5 6
OCR = u,'luv'
To apply this approach to the very complex penetration problem in natural soils may prove impossible. However, simple relationships of the processes involved during penetration can be obtained if the soil behaviour is idealized as per- fectly elasto-plastic. In the next section the pore pressures induced during cone penetration are analysed within the framework of the yield envelope concept.
Porewater pressure response in idealized soil during cone penetration
The initial conditions in a soil element located under the cone axis before being subjected to any influence of the penetrating cone is represented in Fig. 10 by point A. As the cone moves towards the soil element, changes in total stresses are induced, leading to an immediate pore pressure increase for fully saturated conditions. Fig. 1qa) shows the stress path directions obtained for one- dimensional consolidation conditions, i.e. drained (path Aa), and for undrained axisymmetric loading conditions for a soil with a Skempton pore pressure parameter equal to unity (path Ab). Since rapid cone penetration corresponds to practically undrained conditions, the stress path
a,,' p = (a,'+ u;)l2
,-+,AU< (a)
Total verlical stress (b)
Fig. 10. Ideal soil behaviour during cone penetration: (a) schematic elfective stress path under cone axis; (b) pore- water pressure response
in a soil element under the cone axis as the cone penetrates is expected to be to the left of path Aa. In overconsolidated soils, the Skempton param- eter is generally less than unity, and the stress path induced during cone penetration is then expected to be to the right of path Ab. The actual effective stress path during cone insertion depends on the amount of stress change and on the actual pore pressure parameter which, in turn, is a func- tion of the overconsolidation ratio. The stress path AB shown in Fig. l q a ) is thought to be a typical path in a soil element under the cone axis during penetration. Work by Baligh (1985) and
Acar & Tumay (1986) on the strain field induced
by cone penetration suggests stress paths below the cone axis that are consistent with path AB.
The increase in total stresses as the cone
approaches the soil element leads to an increase in vertical effective stress up to a,,' where yielding occurs. This condition is represented by point B. Since the soil element is on the cone axis, the stress state is axisymmetric and the excess pore pressure Au, induced during this phase can be related to the change in deviatoric stress
(Au,
-
Aa,) and to the change in mean totalstress (Fig. lqb)).
Observations from laboratory compression tests in triaxial and plane strain conditions
PRECONSOLIDATION PRESS1 URE IN MARINE CLAYS
(Skempton, 1954; Henkel, 1960; Law & Bozozuk, 1979) indicate that the pore pressure response before yield in soils ranging from heavily to lightly overconsolidated is equal to or less than that of an elastic medium, i.e. A,
<
113. If the excess pore pressure at B, Au,, is related to the increase in total vertical stress, which exceeds the increase in total horizontal stress before yielding, it can be shown that the slope of the line AB in Fig. 1qb) is less than unity in overconsolidated soils. Its magnitude depends mainly on the actual stress path which, in turn, is a function of soil stiffness and OCR.For post-yield conditions, Aq is zero, since there is no further strength change; thus Au, is equal to Au,. Any further increase in total verti- cal stress from B to C is accompanied by an equal increase in total horizontal stress. The increase in excess porewater pressure from B to C is equal to the increase in total vertical stress. Consequently, point C is situated on a line at 45' to the horizon- tal axis which passes through point B (Fig. lqb)). The stress conditions at point A representing the initial state can be estimated with fair accu- racy. The conditions q, and urn at point C, corre- sponding to the final state when the cone reaches the soil element, can be inferred from the mea- sured total cone resistance q, and the measured pore pressure at the base of the cone, u. Only the conditions at B that are related to the yield con- dition are unknown. Geometrical considerations from Fig. l q b ) indicate that
Since the slope of the line passing through B and C is equal to unity
Rewriting equations (1) and (2) with I F = q, yields
which gives
When a cone reaches a soil element adjacent to the tip, equation (4) establishes that the difference between the induced total vertical stress q, and the total porewater pressure urn is directly related to the vertical effective yield stress cry,' which is mobilized along the effective stress path devel- oped during cone penetration.
Relevant stress conditions from piezocone measurements
The theory of cavity expansion has been applied by Gibson (1950) to the problem of
Fig. 11. Simplified stress conditions around a cone
bearing capacity of deep foundations. The cavity expansion model approximately represents the soil behaviour under a deep circular pile only at a large distance from the pile. Several assumptions are necessary to take into account the change in direction of stresses and strains near the cone tip. As illustrated in Fig. 11, it can be considered that the cone is acted on by a uniformly distributed normal soil pressure q, and by a shear stress along the cone, T, mobilized during penetration.
The shear stress along the cone has been intro- duced by Gibson (1950), who assumed that full cohesion could be mobilized along the failure surface, which is taken as a hemisphere of radius that of the pile. The unit shear stress is taken as the undrained shear strength of the soil, s , . Ladanyi & Eden (1969) assumed that the value of the shear stress is equal to the remoulded adhe- sion between the cone surface and the clay, i.e. typically about half the undrained shear strength. Recent studies on pile foundations have indi- cated that the mobilized shaft friction in clays could be interpreted in terms of effective stress parameters (Bozozuk, 1972; Burland, 1973). Fur- thermore, Konrad & Roy (1986) showed that this concept is also valid at various stages during the reconsolidation phase. Hence, it can be assumed that the unit shear stress at the cone-so11 interface can be expressed as
T = (q, - u,)M tan
4'
where
4'
is the effective friction angle of the nor- mally consolidated soil and M is the friction factor for the soil acting on the cone surface.Since the porewater pressure is measured above the base of the cone, the pore pressure in
KONRAD
uy,' and uD': kPa
170 2?Q 3vO 470
u; tmm laboratory data, Bozozuk & Leonards (1 972)
Min. Max.
:
'wb Probable value from Consolidat~on test 2 in dia. sampler,
k!iM
5 in dl.. sampler$ 1 0
Fig. 12. Comparison between the effective vertical yield stress inferred from piezocone data and the preconsolida- tion pressure from laboratory tests-Cloucester site
the failure zone, urn, can be approximated by
where a is a factor usually greater than unity. In soft soils, available data for measured pore pres- sures at both locations (Roy, Tremblay, Tavenas & La Rochelle, 1982) indicate that a is in the range 1-1.1. Considerations of force equilibrium at failure give the following expression for a cone with apex angle 6
q, = q,
+
M cot 6 tan 4'(qn - au) (6) and therefore4, - au
4 n
-
Urn = 1+
M tan4 ' cot 6 (7) qn is equal to the total vertical stress q, induced by the cone penetration process only on the cone axis, see Fig. 11. Here q, - urn = q, - urn = a,,'
(see equation (4)).
The measured cone resistance q, represents the sum of the integration of the resistance of the soil surrounding the cone and of the integration of the shear stresses developed along the cone-soil interface during penetration. Therefore, any cor- relation between cone data with soil properties from other tests should be attempted with q, rather than with the measured cone resistance q,.
A N D LAW
INTERPRETATION OF PIEZOCONE TEST RESULTS
The results obtained from the piezocone tests at the five sites will be interpreted using equations (4) and (7) and will provide a quantitative esti- mate of the vertical effective yield stress mobilized during cone penetration, a,,'. Several parameters are required for the analysis summarized in equa- tion (7). Only q, and u can be determined from piezocone tests. The other parameters, a and M tan
d',
have to be estimated independently.As discussed in the previous section a is close to unity in soft soils, and to date very little data are available in other types of soils. An upper bound value is 1.33 if it is assumed that spherical cavity expansion applies below the cone tip, while cylindrical cavity expansion holds around the shaft, and hence at the base of the cone. a will be less than 1.33, since the actual cone penetration produces an expansion that is intermediate between a sphere and a cylinder. M tan
qY
rep- resents the coefficient of friction between the soil and the cone face. According to measurements made by Potyondy (1961) and Bozozuk, Keenan & Pheeney (1979), M can be taken between 0.5and 0.75 for smooth steel. For normal roughness, M can be taken to be 1.0.
In this analysis, a and M are assumed to equal unity for the five sites studied. Since this assump- tion results in an overestimation of both the numerator and the denominator of equation (7)
by about 10-20%, depending on the values of q, and u, the calculated difference q, - urn is expected to be fairly close to the real value.
Analysis of the piezocone tests using equation
(7) is readily performed with a computer. Results are presented in Figs 12-15 for four sites. Unfor- tunately, the cassette with the data from the STP site was damaged, and the data had to be pro- cessed by hand. Fig. 16 shows the average value of the vertical effective yield stress along the cone axis versus depth for the STP site.
T o evaluate the performance of this conceptual model, the preconsolidation pressures a,' deter-
mined from laboratory consolidation tests on
I
samples obtained from either 5 cm or 12.7 cmdia. samplers or block samples were also plotted in Figs 12-16. These stresses, i.e. a,,' and a,', are obtained from tests with different stress paths as well as different strain rates and should not be expected to be equal. Nevertheless, since these two stresses relate to a yield condition of the same soil it is expected that the features displayed by the a,' profile should also be detected in the
a,,' profile.
At four sites, a,,' is slightly less than a,',
whereas for the Saint-Marcel clay deposit' a,,' is slightly greater than a,' in the upper 8 m and is then equal to a,' between 8 m and 10.5 m depth.
PRECONSOLIDATION PRESSURE IN MARINE CLAYS 185 u",' and u,,': kPa uy,' and up': kPa
300 400 0 100 200 300 400 500
I I
-& Water-table
up' from laboratory test in 1985. 5 in dia, sampler
.
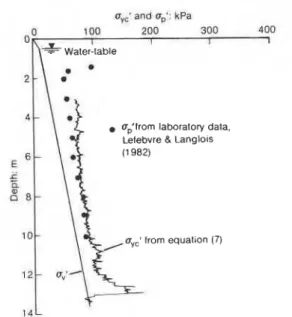
UprfrOm laboratory data, Lefebvre & Langlolspremnsolidation pressure
from Eden B Law (1 980)
uy,' from equation (7)
14 - 18-
Fig. 13. Comparison between the effective vertical yield Fig. 15. Comparison between the effective vertical yield stress inferred from piezocone data and the preconsolida- stress inferred from piezocone data and the preconsolida- tion pressure from laboratory testsSaint-Marcel site tion pressure from laboratory tests-NRCC site
The most striking feature is that the shape of the effective yield stress profile inferred from piezocone tests is similar to that of the precon- solidation stress obtained from oedometer tests. If the geological history of a clay deposit is rela- tively simple, such that the profile increases lin- early with depth, the proposed interpretation should show that the ,'o profile is also increasing linearly with depth. Thls is well illustrated at the
uy,' and up': kPa
100 200 300 400 n I I 1
+
Waler-table 2 H up' from laboratory data, Samson e l a1 (1 982) 4 aE
8 10-2%-
12- 14- 16-Fig. 14. Comparison between the effective vertical yield stress inferred from piezocone data and the preconsolida- tion pressure from laboratory tests-Varennes site
Saint-Marcel and the Varennes sites. If the past history of the deposit is more complex, such as at the Gloucester, STP and NRCC sites, the profile of a,' versus depth will reflect the past events and may present significant changes. Despite the complex geological actions at these sites, the pro- posed interpretation is successful in showing the layers corresponding to the various phases of the geological processes as well as in quantifying the
a,' and on1: kPa
0 200 400 600 Oh I I I \ Water-table ' NGI sampler. 2 in dia. A Block samples o 5 in dia, sample1 E a 12 \
Fig. 16. Comparison between the effective vertical yield stress inferred from piezocone data and the preconsolida- tion pressure from laboratory tests-STP Ottawa site
186 KONRAD effect of these phases on the stress state of the deposit.
Using this procedure a continuous profile of
a,,' can be obtained from the raw data of a cone
test in about 5 min. In contrast a a,' profile is not continuous and requires considerable time to obtain, since each point corresponds to about 10 days of testing. The use of data obtained from oedometer tests may also lead to incomplete characterization of a clay deposit. As shown in Fig. 15, the most probable preconsolidation pres- sure profile extrapolated from laboratory data reported by Eden & Law (1980) for the NRCC site did not identify a distinct layer below a depth of 10.5 m. Oedometer tests carried out in 1985 for another project, before cone testing and interpre- tation, show that. a lower value of a,' was obtained at a depth of 10.5 m, which indicates that a second layer may exist. The preconsolida- tion pressure profile derived from the piezocone tests shows that a second layer does exist.
Similar observations are made for the site at the Ottawa STP. Earlier interpretations (Eden, 1970) from oedometer tests on block samples con- sidered that the most probable preconsolidation pressure profile was linear between 10 m and 23 m (Fig. 16). The interpreted cone data do not follow the same trend at these depths. A com- pilation of all the consolidation tests performed by the Division of Building Research (now the Institute for Research in Construction), NRCC, on samples obtained either with 5 cm or 12.7 m dia. piston samplers, as well as all tests carried out on samples from blocks, shows that the uYc'
profile obtained from piezocone tests is approx- imately parallel to all the a; data. Moreover, at a depth of 19 m, a much lower value of a,' was obtained from a block sample, which was consis- tent with the a,' profile determined using samples from a piston sampler.
ESTIMATION OF IN SITU PRECONSOLIDA- TION PRESSURE FROM PIEZOCONE TESTS
Before seeking a correlation between the verti- cal effective yield stress inferred from piezocone tests and the in situ preconsolidation pressure that can be derived from the results of laboratory consolidation tests, as suggested by Leroueil, Tavenas, Samson & Morin (1983), several factors must be evaluated. The factors known to influ- ence the laboratory preconsolidation pressure, the relationship between field and laboratory precon- solidation pressures and the vertical effective yield stress inferred from piezocone tests are the sample quality, the stress paths, the strain rate effects, the strain softening and the magnitude of the over- consolidation ratio that influences the initial in situ stress conditions.
AND LAW
Effect ojstrain rate
The time or strain rate dependence of the undrained shear strength of clays is well estab- lished. Higher shear strengths are observed at higher strain rates. An increase of 5-10% in strength for a tenfold increase in strain rate is common in many clays. This effect is related to the fact that the size but not the shape of the field envelope is strain rate dependent. Tavenas &
Leroueil (1977) and Graham, Crooks & Bell (1983) have presented evidence that shows that the size of the yield envelope increases approx- imately proportionally to the logarithm of the ? strain rate. Since the apparent preconsolidation pressure is one point on the yield envelope, the
I
lower the rate of loading in an oedometer test theI
lower the apparent preconsolidation pressure. Leroueil et al. (1983) showed that to a first approximation the relative effect of strain rate onup1 is unique for all Champlain clays, irrespective of their plasticity, degree of overconsolidation or the testing technique. The data presented by these researchers show that a tenfold increase in the strain rate results in an increase of about 10% in
a,'. Multiple-stage loading tests with load increment durations of 24 h (conventional) corre- spond to a strain rate that is typically 10-'1s for Champlain clays.
Since there is no complete theory of deep pen- etration, only an approximate relationship between the cone penetration rate S and a repre- sentative strain rate & can be deduced at present. On the basis of spherical cavity expansion theory, Ladanyi (1982) showed that the strain rate at the elastic-plastic interface around an expanding hemispherical cavity coinciding with the cone can be expressed as
where is the strain at failure in triaxial com- pression tests and d is the cone diameter.
Assuming a value of 1% for E , , ,1: is then about 1.7 x 10⁻²/s for a penetration rate of 1 cm/s. The strain field around cones in steady penetration obtained by Acar & Tumay (1986) can be used to determine the strain rate profile below the cone tip. The calculated average strain rate decreases with increasing distance from the cone tip and is about 8 x 10⁻³/s for a soil element at a distance of 1.5d and 7 x 10⁻⁴/s at a distance of 5d. Thus, the actual strain rate along the stress path AB (Fig. 17(a)) mobilized during cone penetration is not constant. The average strain rate along path AB during cone penetration is about 10-3-10-4 Is, which is approximately three or four orders of magnitude larger than the strain rate in a conven- tional oedometer test. The size of the yield envelope corresponding to the field condition
PRECONSOLIDATION PRESSURE IN MARINE CLAYS 187 (model) (actual) (el Actual a,,' - a, I I I 0" q v
Total vertlcal stress (b)
Fig. 17. Real soil behaviour during core penetration: (a) schematic effective stress path under the cone axis in natural soil; (b) porewater pressure response
during cone penetration is then much larger than the size of the yield envelope mobilized in the laboratory. Therefore, assuming that all other conditions remain the same in both cases, it is
expected that a,,' would be overestimated by con-
sidering strain rate effects only.
Eflect ofstrain softening
The behaviour of natural clays is that of a strain softening material characterized by a drop
in strength after failure. A schematic effective
stress path for an element located on the cone axis in these soils is shown in Fig. 17(b). When the effective stresses reach the yield envelope cor- responding to the field strain rate, the shear strengfh decreases from the peak value along the
stress path BC. The amount of the drop in
strength is a function of many factors, such as
stress path, overconsolidation ratio and strain
rate. It has been shown previously that for an
elastic-plastic material the pore pressure change from B to C was equal to the total vertical stress change.
In a strain softening material, the reduction in
shear strength from B to C means that the
increase in horizontal total stress is larger than the increase in vertical total stress. Hence, the
change in pore pressure from B to C, which is
intermediate between the horizontal and vertical total stress increases, is slightly higher than the total vertical stress change. This implies that the slope of the line BC in Fig. 17(b) exceeds 45" for
1 Lightly overconsol~dated
Normallzed mean stress
Fig. 18. Typical stress paths in an odometer test and in a soil element on the cone axis during penetration
most natural clays. For a given depth, the condi-
tions of the initial point A are known, the stresses
at C can be obtained from piezocone data using
equations (5) and (6), and the stress conditions
prevailing at B are inferred from equation (7),
which assumes that the porewater pressure change after yielding is equal to the vertical stress change. This assumption results in an underesti- mate of the actual effective yield stress a,,', as shown in Fig. 17(b).
Eflect of stress path and OCR
It is considered in this section that the yield envelope is independent of the strain rate. Fur- thermore, it is assumed that its shape is also inde-
pendent of OCR so that a unique normalized
yield envelope with respect to the preconsolida- tion pressure can be used.
Data from one-dimensional consolidation tests
reported by Sallfors (1975) and Lefkbvre & Phili-
bert (1979) suggest that the initial stiffness of the intact overconsolidated clay leads to a stress path
such as OE for a lightly overconsolidated clay
and O F for a heavily overconsolidated soil within the yield envelope (Fig. 18). When the limit state
is reached, at points E and F, the stress paths
move towards and then follow the
K O
line in thenormally consolidated stress range.
A probable stress path imposed on a soil
element along the cone axis during penetration is also shown in Fig. 18 for soils with different values of OCR. AB represents the stress path for
lightly overconsolidated soils and CD is typical
for heavily overconsolidated clays. With increas- ing OCR, it is expected that the slope of the stress path induced during cone penetration will decrease, as a result of a smaller induced pore pressure during shear. Fig. 18 indicates clearly that the stress paths in the field and in the labor- atory are different. The amount of preconsolida- tion significantly affects the initial stress state in
188 KONRAD AND LAW
0.~1
;
z f n e s I,
,
St Marcel
O1 2 3 4 5 6
OCR = u,,'lu,'
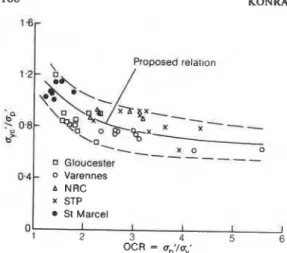
Fig. 19. Proposed empirical correlation for the determi-
nation of OCR from piemcone test data
the soil and also the stress paths in the field. For lightly overconsolidated soil, the initial stress state is close to the yield envelope and the stress path generated during cone penetration is
relatively steep. The values of a,,' and a,' are very
close, as shown schematically in Fig. 18. For clays
with high OCR, the initial stress state is closer to
the origin and relatively far from the isotropic stress state on the yield envelope. Although the slope of the field stress path is not as steep as for slightly overconsolidated soils, because of less porewater pressure generation during shear, the
values of a,,' are much lower than the preconsoli-
dation pressure obtained from oedometer tests. If it is assumed that the strain rate does not influence the yield envelope, Fig. 18 clearly indi-
catw that aYc1/u,' decreases with increasing OCR.
The influence of the remaining factors is
restricted to the laboratory determination of a,'
and has adequately been discussed by Leroueil er
al. (1983).
EMPIRICAL CORRELATION TO DETERMINE IN SITU 0,' FROM PIEZOCONE TESTS
Figure 19 shows the relationship between the
ratio aYc1/a,' and the overconsolidation ratio for
all sites studied in this investigation. This relationship is based on conventional oedometer tests on samples from 70-80 mm dia. piston sam-
plers. Fig. 19 indicates that for an OCR close to
unity, i.e. lightly overconsolidated clays, the stress
ratio ay,'/a,' is about 1.2 and for an OCR of 4.5 it
is 0.7. The trend shown in Fig. 19 is consistent with the expected behaviour based on Fig. 18,
namely that the stress ratio aY,'/opf decreases with
increasing OCR. Furthermore, the proposed
interpretation of piezocone data produces less
scatter at any given overconsolidation ratio com- bared with the scatter obtained when the same data are interpreted in terms of the B, parameter as shown in Fig. 9.
The scatter in results can be attributed to
several factors. For example, tiny draining layers may reduce the measured pore pressure leading
to an overestimation of the value of a,,', and thus
of the ratio aYcf/a,'. The large variation in pore
pressure profiles such as at the NRCC site, and
especially at the Ottawa STP site, may indicate such a condition. Therefore, the points for the STP site may be slightly lower than shown in Fig.
19. Another consideration is the accuracy of mea-
suring the cone resistance in very weak soils,
using cones with 25-50
kN
capacity. It is stronglyrecommended that the cones be calibrated for each expected range of loads and that a proper testing procedure be adopted (Konrad, 1986) to minimize the errors. Despite these efforts, the
cone resistance may still *be underestimated in
weak soils, which may result in underestimates of aycl.
T o determine OCR from piezocone test results
without prior knowledge of the stress history, an
iterative procedure may be used, provided that a
reasonable estimate of a,,' can be made. The
ratio a,,'/a,,' provides the first value of OCR,
which in turn yields the ratio oYci/o,' using the
mean relationship given in Fig. 19. A new value of OCR is then obtained by dividing ay,'/a,,' by
u,,'/a,'. This procedure is repeated until there is
satisfactory convergence of the value of OCR. A
few iterations suffice to reach convergence. The in situ preconsolidation pressure depends on the specific engineering situation, i.e. the stress
path dependence, as pointed out by Leroueil et al.
(1983). Since the a,' value obtained from labor- atory tests is also affected by sample disturbance, the relationship between the preconsolidation pressure operative in the field and inferred from laboratory testing will also be empirical. Leroueil
et al. (1983) proposed to obtain the in situ pre-
consolidation pressure for embankment design
from a,' determined from conventional oedome-
ter tests, by using a correction factor that is a
function of OCR and sampler size. This relation-
ship can be combined with the empirical correla- tion proposed in Fig. 19 to determine the in situ
a,' value from piezocone tests.
CONCLUSIONS
The purpose of this study was to develop a method for interpreting piezocone penetrometer test data to obtain the preconsolidation pressure in cohesive soils. Theoretical relationships have been developed here for the vertical effective yield stress along the cone axis during cone penetration
PRECONSOLIDATION PRESSURE IN MARINE CLAYS 189
in an elasto-plastic material. Although this veen, technical oficers of the Institute for relationship can only approximate real soil Research in Construction, in conducting the in behaviour, it indicates a pattern of behaviour that situ tests. Dr J. H. L. Palmer reviewed the final can be compared with a pattern obtained from draft and offered many valuable suggestions. This other tests in the laboratory or in the field and Paper is a contribution from the Institute for can lead to useful empirical correlations. An Research in Construction, National Research experimental study was conducted to investigate Council of Canada.
thk potential of ;sing the proposed piezoc%ne data interpretation for evaluating the geological
history of five sites in marine clay deposits. REFERENCES
The study has led to the following conclusions. Acar, Y. B. & Tumay, M. T. (1986). Strain field around
(a) The ratio of the excess pore pressure mea- sured during piezocone penetration and the total net cone resistance (q, - a,,) is not sufi- ciently sensitive to reflect OCR changes, at least for OCR ranging from 1.3 to 4.5.
(b) The effective vertical yield stress mobilized during cone penetration is equal to the differ- ence between the induced total vertical stress and the total porewater pressure.
(c) The induced total vertical stress can be derived from the measured cone resistance, assuming that the unit shear stress at the con- e-soil interface is computed using effective stress parameters combined with the mea- sured pore pressure generated during pen- etration.
(d) The continuous profiles of cone resistance and pore pressure with depth result in a contin- uous profile of the vertical effective yield stress that is approximately parallel to the profile of the preconsolidation pressure obtained from laboratory oedometer tests.
(e) Both profiles are affected by the strain rate, the stress path, the overconsolidation ratio and the stress-strain characteristics.
(n
It is suggested that these effects are included in an empirical correlation between the over- consolidation ratio and the ratio of the verti- cal effective yield stress derived from the proposed model, for the preconsolidation pressure obtained from conventional oedome- ter tests on samples from 70 mm dia. sam- plers. This correlation shows that the stress ratio decreases with increasing OCR. For the five sites studied the proposed empirical cor- relation exhibits less scatter than the relation- ship based on the B, parameter.(g) The in situ preconsolidation pressure may be estimated from the preconsolidation pressure derived from the previous correlation by applying a correction factor, which is also dependent on OCR.
ACKNOWLEDGEMENTS
The Authors gratefully acknowledge the con- scientious efforts of A. Laberge and T. Hooge-
cones in steady penetration. J. Geotech. Engng Dio.
Am. Soc. Civ. Engrs 112, GT2,207-213.
Baligh, M. M. (1985). Strain path method. J. Geotech.
Engng Div. Am. Soc. Civ. Engrs 111, GT9, 1108- 11 36.
Bozozuk, M. (1972). Downdrag measurements on a 160 ft. floating pipe test pile in marine clay. Can.
Geotech. J. 9, No. 2, 127-136.
Bozozuk, M., Keenan, G. H. & Pheeney, P. E. (1979). Analysis of load tests on instrumented steel test piles in compressible silty soil. In Behaviour of deep foun- dations. ASTM Spec. Tech. Publ. 670, 153-180. Bozozuk, M. & Leonards, G. A. (1972). The Gloucester
test fill. Proc. Specialty Conj: Performance of Earth
and Earth Supported Structures, Lafayette 1, 299- 318. New York: American Society of Civil Engi- neers.
Burland, J. B. (1973). Shaft friction of piles in clay-a simple fundamental approach. Ground Engng 6, 30-42.
Casagrande, A. (1936). The determination of the precon- solidation load and its practical significance. Proc.
1st Int. Conj: Soil Mech. Fdn Engng, Cambridge 3,
60-64.
Casagrande, L., Firing, P., Schoof, G. & Turcke, E. W. (1965). Settlement of mat foundation on thick stratum of sensitive clay. Can. Geotech. J. 2, No. 4, 299-3 12.
Crawford, C. B. (1964). Interpretation of the consoli- dation test. J. Soil Mech. Fdns Dio. Am. Soc. Civ.
Engrs 90, SM5,87-102.
Eden, W. J. (1970). Sampler trials in overconsolidated sensitive clay. ASTM Spec. Tech. Publ. 483, 132- 142.
Eden, W. J. & Hamilton, J. J. (1956). The use of a field vane apparatus in sensitive clay. ASTM Spec. Tech.
Publ. 193,41-53.
Eden, W. J. & Law, K. T. (1980). Comparison of undrained shear strength results obtained by differ- ent test methods in soft clays. Can. Geotech. J. 17,
NO. 3,369-381.
Gibson, R. E. (1950). Discussion on The bearing capac- ity of screw piles and screwcrete cylinders. J. lnstn
Civ. Engrs 34, 382-383.
Graham, J., Crooks, J. H. A. & Bell, A. L. (1983). Time effects on the stress-strain behaviour of natural soft clays. Ghotechnique 33, No. 3, 327-340.
Henkel, D. J. (1960). The shear strength of saturated remoulded clays. Proc. Conj: Shear Strength of Cohe-
sive Soils, Boulder, pp. 553-554. New York: Amer- ican Society of Civil Engineers.
Jamiolkowski, M., Ladd, C. C., Germaine, J. T. & Lan- cellotta, R. (1985). New developments in field and
190 KONRAD AND LAW laboratory testing of soils. Proc. 11th Int. Conf. Soil
Mech. Fdn Engng, San Francisco 1, 57-154.
Konrad, J.-M. (1986). Piezo-friction-cone penetrometer testing in soft clays. Proc. 39th Can. Geotech. Conf.,
Ottawa, August 1986.
Konrad, J.-M. & Roy, M. (1986). Bearing capacity of friction piles in marine clay. Submitted to Giotech-
nique.
Lacasse, S. & Lunne, T. (1982). Penetration tests in two Norwegian clays. Proc. 2nd Eur. Symp. Penetration
Testing, Amsterdam, pp. 661469. Rotterdam: Balkema.
Ladanyi, B. (1982). Determination of geotechnical parameters of frozen soils by means of the cone pen- etration test. Proc. 2nd Eur. Symp. Penetration
Testing, Amsterdam, pp. 671-678. Rotterdam: Balkema.
Ladanyi, B. & Eden, W. J. (1969). Use of the deep pen- etration test in sensitive clays. Proc. 7th Int. Conf.
Soil Mech. Fdn Engng, Mexico City 1,225-230. Law, K. T. & Bozozuk, M. (1979). A method of estimat-
ing excess pore pressures beneath embankments on sensitive clays. Can. Geotech. J. 16, No. 4,691-702. Lefebvre, G. & Langlois, P. (1982). Observation de la
fissuration des argiles par claquage hydraulique sites St-Marcel et Ottawa. Report, Division of Building
Research, National Research Council of Canada, Ottawa.
Lefebvre, G. & Philibert, A. (1979). Mesure des pres- sions lattrales durant le consolidation unidimen- sionnelle d'une argile structurke. Proc. 32nd Can.
Geotech. Conf., Qdbec, pp. 261-275.
Leroueil, S., Tavenas, F., Samson, L. & Morin, P. (1983). Preconsolidation pressure of Champlain
clays: part 11, laboratory determination. Can.
Geotech. J. 20, No. 4,803-816.
Potyondy, J. G. (1961). Skin friction between various soils and construction materials. Giotechnique 11, No. 4,339-353.
Roy, M., Tremblay, M., Tavenas, F. & La Rochelle, P. (1982). Development of pore pressures in quasi-static penetration tests in sensitive clay. Can. Geotech. J. 19, NO. 2, 124-138.
Sdlfors, G. (1975). Preconsolidation pressure of soft high plc~stic clays. PhD thesis, Chalmers University of
Technology, Gotenburg.
Samson, L., Leroueil, S., Morin, P. & Le Bihan, J. P. (1981). Pression de prkonsolidation des argiles sens- ible~. Report, Division of Building Research, Nation- al Research Council of Canada, Ottawa.
Schmertmann, J. H. (1978). Guidelines for cone penetra- tion test perJormance and design. Report F H WA-TS-
78-209, US Department of Transportation, Federal Highway Administration, Washington DC. Senneset, K., Janbu, N., & Svanra, G. (1982). Strength
and deformation parameters from cone penetration tests. Proc. 2nd Eur. Symp. Penetration Testing,
Amsterdam, 863-870. Rotterdam: Balkema. Skempton, A. W. (1954). The pore-pressure coefficients
A and B. Gkotechnique 4 No. 4, 143-147.
Tavenas, F. & Leroueil, S. (1977). Effects of stresses and time in yielding of clays. Proc. 9th Int. Conf. Soil
Mech. Fdn Engng, Tokyo 1,319-326.
Tavenas, F. & Leroueil, S. (1979). Clay behaviour and the selection of design parameters, Proc. 7th Int.
Conf. Soil Mech. Fdn Engng, Brighton, 281-291. Wroth, C. P. (1984). The interpretation of in situ soil