arXiv:2007.13420v3 [hep-ex] 29 Oct 2020
Studies of X(3872) and ψ(2S) production in p ¯
p
collisions at 1.96 TeV
V.M. Abazov,31B. Abbott,67 B.S. Acharya,25 M. Adams,46 T. Adams,44 J.P. Agnew,41 G.D. Alexeev,31 G. Alkhazov,35 A. Altona,56 A. Askew,44 S. Atkins,54 K. Augsten,7 V. Aushev,38 Y. Aushev,38 C. Avila,5 F. Badaud,10 L. Bagby,45B. Baldin,45D.V. Bandurin,74S. Banerjee,25 E. Barberis,55P. Baringer,53 J.F. Bartlett,45
U. Bassler,15V. Bazterra,46 A. Bean,53M. Begalli,2 L. Bellantoni,45 S.B. Beri,23 G. Bernardi,14 R. Bernhard,19 I. Bertram,39M. Besan¸con,15R. Beuselinck,40 P.C. Bhat,45 S. Bhatia,58 V. Bhatnagar,23 G. Blazey,47 S. Blessing,44
K. Bloom,59 A. Boehnlein,45 D. Boline,64 E.E. Boos,33G. Borissov,39M. Borysoval,38 A. Brandt,71 O. Brandt,20 M. Brochmann,75R. Brock,57 A. Bross,45 D. Brown,14X.B. Bu,45 M. Buehler,45 V. Buescher,21 V. Bunichev,33
S. Burdinb,39 C.P. Buszello,37E. Camacho-P´erez,28B.C.K. Casey,45 H. Castilla-Valdez,28 S. Caughron,57 S. Chakrabarti,64K.M. Chan,51 A. Chandra,73 E. Chapon,15 G. Chen,53 S.W. Cho,27 S. Choi,27B. Choudhary,24
S. Cihangir‡,45 D. Claes,59 J. Clutter,53 M. Cookej,45 W.E. Cooper,45 M. Corcoran‡,73 F. Couderc,15 M.-C. Cousinou,12J. Cuth,21 D. Cutts,70 A. Das,72 G. Davies,40 S.J. de Jong,29, 30 E. De La Cruz-Burelo,28 F. D´eliot,15 R. Demina,63D. Denisov,65S.P. Denisov,34S. Desai,45 C. Deterrec,41 K. DeVaughan,59 H.T. Diehl,45 M. Diesburg,45 P.F. Ding,41 A. Dominguez,59 A. Drutskoyq,32A. Dubey,24L.V. Dudko,33 A. Duperrin,12S. Dutt,23 M. Eads,47D. Edmunds,57 J. Ellison,43 V.D. Elvira,45Y. Enari,14H. Evans,49A. Evdokimov,46 V.N. Evdokimov,34
A. Faur´e,15L. Feng,47 T. Ferbel,63 F. Fiedler,21 F. Filthaut,29, 30 W. Fisher,57 H.E. Fisk,45 M. Fortner,47 H. Fox,39 J. Franc,7 S. Fuess,45 P.H. Garbincius,45 A. Garcia-Bellido,63J.A. Garc´ıa-Gonz´alez,28V. Gavrilov,32
W. Geng,12, 57 C.E. Gerber,46Y. Gershtein,60 G. Ginther,45 O. Gogota,38G. Golovanov,31 P.D. Grannis,64 S. Greder,16 H. Greenlee,45 G. Grenier,17Ph. Gris,10 J.-F. Grivaz,13 A. Grohsjeanc,15 S. Gr¨unendahl,45 M.W. Gr¨unewald,26 T. Guillemin,13 G. Gutierrez,45 P. Gutierrez,67 J. Haley,68 L. Han,4K. Harder,41A. Harel,63
J.M. Hauptman,52 J. Hays,40 T. Head,41 T. Hebbeker,18 D. Hedin,47H. Hegab,68 A.P. Heinson,43 U. Heintz,70 C. Hensel,1 I. Heredia-De La Cruzd,28 K. Herner,45G. Heskethf,41 M.D. Hildreth,51 R. Hirosky,74 T. Hoang,44
J.D. Hobbs,64 B. Hoeneisen,9 J. Hogan,73 M. Hohlfeld,21 J.L. Holzbauer,58I. Howley,71 Z. Hubacek,7, 15 V. Hynek,7 I. Iashvili,62Y. Ilchenko,72 R. Illingworth,45 A.S. Ito,45S. Jabeenm,45 M. Jaffr´e,13A. Jayasinghe,67
M.S. Jeong,27R. Jesik,40 P. Jiang‡,4 K. Johns,42 E. Johnson,57 M. Johnson,45 A. Jonckheere,45 P. Jonsson,40 J. Joshi,43 A.W. Jungo,45 A. Juste,36E. Kajfasz,12D. Karmanov,33I. Katsanos,59M. Kaur,23 R. Kehoe,72 S. Kermiche,12 N. Khalatyan,45 A. Khanov,68A. Kharchilava,62Y.N. Kharzheev,31I. Kiselevich,32J.M. Kohli,23
A.V. Kozelov,34 J. Kraus,58 A. Kumar,62 A. Kupco,8 T. Kurˇca,17V.A. Kuzmin,33S. Lammers,49 P. Lebrun,17 H.S. Lee,27 S.W. Lee,52 W.M. Lee‡,45X. Lei,42 J. Lellouch,14 D. Li,14 H. Li,74 L. Li,43Q.Z. Li,45 J.K. Lim,27 D. Lincoln,45J. Linnemann,57 V.V. Lipaev‡,34R. Lipton,45 H. Liu,72Y. Liu,4 A. Lobodenko,35 M. Lokajicek,8 R. Lopes de Sa,45 R. Luna-Garciag,28A.L. Lyon,45 A.K.A. Maciel,1 R. Madar,19 R. Maga˜na-Villalba,28 S. Malik,59
V.L. Malyshev,31J. Mansour,20 J. Mart´ınez-Ortega,28R. McCarthy,64 C.L. McGivern,41 M.M. Meijer,29, 30 A. Melnitchouk,45 D. Menezes,47 P.G. Mercadante,3 M. Merkin,33 A. Meyer,18J. Meyeri,20 F. Miconi,16
N.K. Mondal,25 M. Mulhearn,74 E. Nagy,12 M. Narain,70 R. Nayyar,42 H.A. Neal‡,56 J.P. Negret,5 P. Neustroev,35 H.T. Nguyen,74 T. Nunnemann,22 J. Orduna,70 N. Osman,12 A. Pal,71 N. Parashar,50
V. Parihar,70 S.K. Park,27R. Partridgee,70 N. Parua,49A. Patwaj,65 B. Penning,40 M. Perfilov,33 Y. Peters,41 K. Petridis,41 G. Petrillo,63P. P´etroff,13 M.-A. Pleier,65 V.M. Podstavkov,45 A.V. Popov,34 M. Prewitt,73 D. Price,41 N. Prokopenko,34J. Qian,56 A. Quadt,20 B. Quinn,58 P.N. Ratoff,39 I. Razumov,34 I. Ripp-Baudot,16 F. Rizatdinova,68 M. Rominsky,45A. Ross,39C. Royon,8P. Rubinov,45R. Ruchti,51 G. Sajot,11
A. S´anchez-Hern´andez,28 M.P. Sanders,22 A.S. Santosh,1 G. Savage,45 M. Savitskyi,38 L. Sawyer,54T. Scanlon,40 R.D. Schamberger,64 Y. Scheglov‡,35 H. Schellman,69, 48 M. Schott,21 C. Schwanenbergerc,41 R. Schwienhorst,57
J. Sekaric,53 H. Severini,67 E. Shabalina,20V. Shary,15 S. Shaw,41 A.A. Shchukin,34 O. Shkola,38V. Simak‡,7 P. Skubic,67 P. Slattery,63 G.R. Snow‡,59 J. Snow,66 S. Snyder,65 S. S¨oldner-Rembold,41 L. Sonnenschein,18 K. Soustruznik,6 J. Stark,11 N. Stefaniuk,38 D.A. Stoyanova,34 M. Strauss,67 L. Suter,41P. Svoisky,74M. Titov,15
V.V. Tokmenin,31 Y.-T. Tsai,63 D. Tsybychev,64 B. Tuchming,15 C. Tully,61 L. Uvarov,35 S. Uvarov,35 S. Uzunyan,47 R. Van Kooten,49 W.M. van Leeuwen,29 N. Varelas,46E.W. Varnes,42 I.A. Vasilyev,34 A.Y. Verkheev,31 L.S. Vertogradov,31M. Verzocchi,45 M. Vesterinen,41 D. Vilanova,15P. Vokac,7 H.D. Wahl,44
C. Wang,4 M.H.L.S. Wang,45 J. Warchol‡,51 G. Watts,75 M. Wayne,51 J. Weichert,21 L. Welty-Rieger,48 M.R.J. Williamsn,49 G.W. Wilson,53 M. Wobisch,54 D.R. Wood,55 T.R. Wyatt,41 Y. Xie,45 R. Yamada,45 S. Yang,4 T. Yasuda,45 Y.A. Yatsunenko‡,31 W. Ye,64 Z. Ye,45 H. Yin,45 K. Yip,65 S.W. Youn,45 J.M. Yu,56
(The D0 Collaboration∗)
1LAFEX, Centro Brasileiro de Pesquisas F´ısicas, Rio de Janeiro, RJ 22290, Brazil 2Universidade do Estado do Rio de Janeiro, Rio de Janeiro, RJ 20550, Brazil
3Universidade Federal do ABC, Santo Andr´e, SP 09210, Brazil
4University of Science and Technology of China, Hefei 230026, People’s Republic of China 5Universidad de los Andes, Bogot´a, 111711, Colombia
6Charles University, Faculty of Mathematics and Physics,
Center for Particle Physics, 116 36 Prague 1, Czech Republic
7Czech Technical University in Prague, 116 36 Prague 6, Czech Republic
8Institute of Physics, Academy of Sciences of the Czech Republic, 182 21 Prague, Czech Republic 9Universidad San Francisco de Quito, Quito 170157, Ecuador
10LPC, Universit´e Blaise Pascal, CNRS/IN2P3, Clermont, F-63178 Aubi`ere Cedex, France 11LPSC, Universit´e Joseph Fourier Grenoble 1, CNRS/IN2P3,
Institut National Polytechnique de Grenoble, F-38026 Grenoble Cedex, France
12CPPM, Aix-Marseille Universit´e, CNRS/IN2P3, F-13288 Marseille Cedex 09, France 13LAL, Univ. Paris-Sud, CNRS/IN2P3, Universit´e Paris-Saclay, F-91898 Orsay Cedex, France
14LPNHE, Universit´es Paris VI and VII, CNRS/IN2P3, F-75005 Paris, France 15IRFU, CEA, Universit´e Paris-Saclay, F-91191 Gif-Sur-Yvette, France 16IPHC, Universit´e de Strasbourg, CNRS/IN2P3, F-67037 Strasbourg, France
17IPNL, Universit´e Lyon 1, CNRS/IN2P3, F-69622 Villeurbanne Cedex,
France and Universit´e de Lyon, F-69361 Lyon CEDEX 07, France
18III. Physikalisches Institut A, RWTH Aachen University, 52056 Aachen, Germany 19Physikalisches Institut, Universit¨at Freiburg, 79085 Freiburg, Germany
20II. Physikalisches Institut, Georg-August-Universit¨at G¨ottingen, 37073 G¨ottingen, Germany 21Institut f¨ur Physik, Universit¨at Mainz, 55099 Mainz, Germany
22Ludwig-Maximilians-Universit¨at M¨unchen, 80539 M¨unchen, Germany 23Panjab University, Chandigarh 160014, India
24Delhi University, Delhi-110 007, India
25Tata Institute of Fundamental Research, Mumbai-400 005, India 26University College Dublin, Dublin 4, Ireland
27Korea Detector Laboratory, Korea University, Seoul, 02841, Korea 28CINVESTAV, Mexico City 07360, Mexico
29Nikhef, Science Park, 1098 XG Amsterdam, the Netherlands 30Radboud University Nijmegen, 6525 AJ Nijmegen, the Netherlands
31Joint Institute for Nuclear Research, Dubna 141980, Russia 32Institute for Theoretical and Experimental Physics, Moscow 117259, Russia
33Moscow State University, Moscow 119991, Russia
34Institute for High Energy Physics, Protvino, Moscow region 142281, Russia 35Petersburg Nuclear Physics Institute, St. Petersburg 188300, Russia 36Instituci´o Catalana de Recerca i Estudis Avan¸cats (ICREA) and Institut
de F´ısica d’Altes Energies (IFAE), 08193 Bellaterra (Barcelona), Spain
37Uppsala University, 751 05 Uppsala, Sweden
38Taras Shevchenko National University of Kyiv, Kiev, 01601, Ukraine 39Lancaster University, Lancaster LA1 4YB, United Kingdom 40Imperial College London, London SW7 2AZ, United Kingdom 41The University of Manchester, Manchester M13 9PL, United Kingdom
42University of Arizona, Tucson, Arizona 85721, USA 43University of California Riverside, Riverside, California 92521, USA
44Florida State University, Tallahassee, Florida 32306, USA 45Fermi National Accelerator Laboratory, Batavia, Illinois 60510, USA
46University of Illinois at Chicago, Chicago, Illinois 60607, USA 47Northern Illinois University, DeKalb, Illinois 60115, USA
48Northwestern University, Evanston, Illinois 60208, USA 49Indiana University, Bloomington, Indiana 47405, USA 50Purdue University Calumet, Hammond, Indiana 46323, USA 51University of Notre Dame, Notre Dame, Indiana 46556, USA
52Iowa State University, Ames, Iowa 50011, USA 53University of Kansas, Lawrence, Kansas 66045, USA 54Louisiana Tech University, Ruston, Louisiana 71272, USA 55Northeastern University, Boston, Massachusetts 02115, USA
56University of Michigan, Ann Arbor, Michigan 48109, USA 57Michigan State University, East Lansing, Michigan 48824, USA
59University of Nebraska, Lincoln, Nebraska 68588, USA 60Rutgers University, Piscataway, New Jersey 08855, USA 61Princeton University, Princeton, New Jersey 08544, USA 62State University of New York, Buffalo, New York 14260, USA
63University of Rochester, Rochester, New York 14627, USA 64State University of New York, Stony Brook, New York 11794, USA
65Brookhaven National Laboratory, Upton, New York 11973, USA 66Langston University, Langston, Oklahoma 73050, USA 67University of Oklahoma, Norman, Oklahoma 73019, USA 68Oklahoma State University, Stillwater, Oklahoma 74078, USA
69Oregon State University, Corvallis, Oregon 97331, USA 70Brown University, Providence, Rhode Island 02912, USA
71University of Texas, Arlington, Texas 76019, USA 72Southern Methodist University, Dallas, Texas 75275, USA
73Rice University, Houston, Texas 77005, USA 74University of Virginia, Charlottesville, Virginia 22904, USA
75University of Washington, Seattle, Washington 98195, USA
(Dated: October 30, 2020)
We present various properties of the production of the X(3872) and ψ(2S) states based on 10.4 fb−1 collected by the D0 experiment in Tevatron p¯p collisions at √s = 1.96 TeV. For both
states, we measure the nonprompt fraction fN P of the inclusive production rate due to decays of
b-flavored hadrons. We find the fN P values systematically below those obtained at the LHC. The
fN P fraction for ψ(2S) increases with transverse momentum, whereas for the X(3872) it is constant
within large uncertainties, in agreement with the LHC results. The ratio of prompt to nonprompt ψ(2S) production, (1 − fN P)/fN P, decreases only slightly going from the Tevatron to the LHC, but
for the X(3872), this ratio decreases by a factor of about 3. We test the soft-pion signature of the X(3872) modeled as a weakly bound charm-meson pair by studying the production of the X(3872) as a function of the kinetic energy of the X(3872) and the pion in the X(3872)π center-of-mass frame. For a subsample consistent with prompt production, the results are incompatible with a strong enhancement in the production of the X(3872) at the small kinetic energy of the X(3872) and the π in the X(3872)π center-of-mass frame expected for the X+soft-pion production mecha-nism. For events consistent with being due to decays of b hadrons, there is no significant evidence for the soft-pion effect, but its presence at the level expected for the binding energy of 0.17 MeV and the momentum scale Λ = M (π) is not ruled out.
PACS numbers: 12.39.Mk, 13.85.Ni, 14.40.Gx
I. INTRODUCTION
Fifteen years after the discovery of the state X(3872) [1] (also named χc1(3872) [2]) its nature is still debated. Its proximity to the D0D¯∗0 threshold suggests
∗with visitors from aAugustana College, Sioux Falls, SD 57197,
USA, bThe University of Liverpool, Liverpool L69 3BX, UK, cDeutshes Elektronen-Synchrotron (DESY), Notkestrasse 85,
Ger-many,dCONACyT, M-03940 Mexico City, Mexico,eSLAC, Menlo
Park, CA 94025, USA,fUniversity College London, London WC1E
6BT, UK, gCentro de Investigacion en Computacion - IPN, CP
07738 Mexico City, Mexico,hUniversidade Estadual Paulista, S˜ao
Paulo, SP 01140, Brazil,iKarlsruher Institut f¨ur Technologie (KIT)
- Steinbuch Centre for Computing (SCC), D-76128 Karlsruhe, Ger-many,jOffice of Science, U.S. Department of Energy, Washington,
D.C. 20585, USA, lKiev Institute for Nuclear Research (KINR),
Kyiv 03680, Ukraine, mUniversity of Maryland, College Park,
MD 20742, USA, nEuropean Orgnaization for Nuclear Research
(CERN), CH-1211 Geneva, Switzerland,oPurdue University, West
Lafayette, IN 47907, USA, pInstitute of Physics, Belgrade,
Bel-grade, Serbia, andqP.N. Lebedev Physical Institute of the Russian
Academy of Sciences, 119991, Moscow, Russia. ‡Deceased.
a charm-meson molecule loosely bound by the pion ex-change potential, first suggested by Tornqvist [3]. The molecular model also explains the isospin breaking decay to J/ψρ that is not allowed for a pure charmonium state. However, the copious prompt production of the X(3872) at hadron colliders has been used as an argument against a pure molecule interpretation [4]. With the binding en-ergy less than 1 MeV, the average distance between the two components is a few femtometers. It has been ar-gued that the production of such an extended object in the hadron collision environment is strongly disfavored and is better described by a compact charm-anticharm or diquark-antidiquark structure. Meng, Gao and Chao [5] proposed that the X(3872) is a mixture of the conven-tional charmonium state χc1(2P ) and a D0D¯∗0molecule. In this picture, the short-distance production proceeds through the χc1(2P ) component, while the D0D¯∗0 com-ponent is responsible for hadronic decays. An evalua-tion of the producevalua-tion cross secevalua-tion of the X(3872) [6] through its χc1(2P ) component gives a good description of the differential cross section for the prompt production of X(3872) measured by CMS [7] and ATLAS [8].
Recently, Braaten etal. [9, 10] have revised the calcu-lation of the production of the X(3872) under the purely molecular hypothesis by taking into account the forma-tion of D∗D¯∗ at short distances followed by the rescat-tering of the charm mesons onto Xπ. According to the authors, such a process should be easily observable at hadron colliders as an increased event rate at small val-ues of the kinetic energy T (Xπ) of the X(3872) and the “soft” pion in the X(3872)π center-of-mass frame and should provide a clean test of the molecular structure of the X(3872).
In this article, we present production properties of the X(3872) in Tevatron p¯p collisions at the energy √s = 1.96 TeV and compare them with those of the conven-tional charmonium state ψ(2S). Section II describes rel-evant experimental details and the event selections. In Sec. III, we present the transverse momentum pT and pseudorapidity η dependence of the fraction fN P of the inclusive production rate due to nonprompt decays of b-flavored hadrons. In Sec. IV, we study the hadronic activity around the X(3872) and ψ(2S). We also test the soft-pion signature of the X(3872) as a weakly bound charm-meson pair by studying the production of X(3872) plus a comoving pion at small T (Xπ). As a control pro-cess, we use the production of the charmonium state ψ(2S), for which this production mechanism does not apply. We summarize the findings in Sec. V.
II. THE D0 DETECTOR, EVENT
RECONSTRUCTION AND SELECTION
The D0 detector has a central tracking system consist-ing of a silicon microstrip tracker and the central fiber tracker, both located within a 1.9 T superconducting solenoidal magnet [11, 12]. A muon system, covering the pseudorapidity interval |η| < 2 [13], consists of a layer of tracking detectors and scintillation trigger counters in front of 1.8 T iron toroidal magnets, followed by two similar layers after the toroids [14]. Events used in this analysis are collected with both single-muon and dimuon triggers. Single-muon triggers require a coincidence of signals in trigger elements inside and outside the toroidal magnets. All dimuon triggers require at least one muon to have track segments after the toroid; muons in the for-ward region are always required to penetrate the toroid. The minimum muon transverse momentum is 1.5 GeV. No minimum pT requirement is applied to the muon pair, but the effective threshold is approximately 4 GeV due to the requirement for muons to penetrate the toroids, and the average value for accepted events is 10 GeV.
We select two samples, referred to as 4-track and 5-track selections. To select 4-5-track candidates, we recon-struct J/ψ → µ+µ− decay candidates accompanied by two particles of opposite charge assumed to be pions, with transverse momentum pT with respect to the beam axis greater than 0.5 GeV. We perform a kinematic fit un-der the hypothesis that the muons come from the J/ψ,
and that the J/ψ and the two particles originate from the same space point. In the fit, the dimuon invariant mass is constrained to the world average value of the J/ψ me-son mass [2]. The track parameters (pT and position and direction in three dimensions) readjusted according to the fit are used in the calculation of the invariant mass M (J/ψπ+π−) and the decay length vector ~L
xy, which is the transverse projection of the vector directed from the primary vertex to the J/ψπ+π−production vertex. The two-pion mass for each accepted J/ψπ+π− candidate is required to be greater than 0.35 GeV (0.5 GeV) for ψ(2S) (X(3872)) candidates. These conditions have a signal acceptance of more than 99% while reducing the combi-natorial background. The transverse momentum of the J/ψπ+π− system is required to be greater than 7 GeV. All tracks in a given event are considered, and all combi-nations of tracks satisfying the conditions stated are kept. The mass windows 3.62 < M (J/ψπ+π−) < 3.78 GeV and 3.75 < M (J/ψπ+π−) < 4.0 GeV are used for ψ(2S) and X(3872) selections, respectively. The rates of multi-ple entries within these ranges are less than 10%.
Fits to the M (J/ψπ+π−) distribution for the 4-track selection are shown in Fig. 1. In the fits, the sig-nal is modeled by a Gaussian function with a free mass and width. Background is described by a fourth-order Chebyshev polynomial. The fits yield 126 891 ± 770 and 16 423 ± 1031 events of ψ(2S) and X(3872), with mass parameters of 3684.88 ± 0.07 MeV and 3871.0 ± 0.2 MeV, and mass resolutions of 9.7 ± 0.1 MeV and 16.7 ± 0.9 MeV, respectively. These mass resolutions are used in all subsequent fits.
For the 5-track sample, we require the presence of an additional charged particle with pT > 0.5 GeV, consistent with coming from the same vertex. We assume it to be a pion and set a mass limit M (J/ψπ+π+π−) < 4.8 GeV. Charge-conjugate pro-cesses are implied throughout this article. To further reduce background, we allow up to two sets of three hadronic tracks per event, with an additional require-ment that M (J/ψπ+π−) be less than 4 GeV. With up to two accepted J/ψπ+π− combinations per set, there are up to four accepted combinations per event. Be-cause tracks are ordered by descending pT, this proce-dure selects the highest-pT tracks of each charge. Fits to the M (J/ψπ+π−) distribution for the 5-track selection are shown in Fig. 2. The fits yield 75 406 ± 1435 and 8 192 ± 671 signal events of ψ(2S) and X(3872). The 5-track sample is used in the studies presented in Sec-tion IV.
III. PSEUDO-PROPER TIME DISTRIBUTIONS
OF ψ(2S) AND X(3872)
In this section we study the pseudo-proper time distri-butions for the charmonium states ψ(2S) and X(3872) using the 4-track sample. These states can originate from the primary p¯p interaction vertex (prompt production),
3.65
3.7
3.75
) [GeV]
-π
+π
ψ
M(J/
0
10
20
30
40
50
60
70
310
×
Events / 5 MeV
-1D0 Run II, 10.4 fb
(a)
Data Total fit Signal Background
3.75
3.8
3.85
3.9
3.95
4
) [GeV]
-π
+π
ψ
M(J/
0
10
20
30
40
50
60
310
×
Events / 5 MeV
-1 D0 Run II, 10.4 fb(b)
Data Total fit Signal BackgroundFIG. 1: The invariant mass M (J/ψπ+π−) for (a) the ψ(2S)
and (b) the X(3872) selection criteria for the 4-track selection.
or they can originate from a displaced secondary ver-tex corresponding to a beauty hadron decay (nonprompt production). The pseudo-proper time tpp is calculated using the formula tpp = ~Lxy·~pTm/(p2Tc), where ~pT and m are the transverse momentum and mass of the charmo-nium state ψ(2S) or X(3872) expressed in natural units and c is the speed of light. We note that the true life-times of b hadrons decaying to ψ(2S) or X(3872) mesons are slightly different from the pseudo-proper time values obtained from the formula, because the boost factor of the charmonium is not exactly equal to the boost factor of the parent. Therefore, the nonprompt pseudo-proper charmonium time distributions will have effective expo-nential lifetime values, which are close to but not equal to the lifetime for an admixture of B0, B−, B0
s, Bc−mesons, and b baryons.
To obtain the tpp distributions, the numbers of events are extracted from fits for the ψ(2S) and X(3872) sig-nals in mass distributions. This method removes combi-natorial backgrounds and yields background-subtracted numbers of ψ(2S) or X(3872) signal events produced in each time interval. The bin width of the pseudo-proper time distributions is chosen to increase exponentially to
3.65
3.7
3.75
) [GeV]
-π
+π
ψ
M(J/
0
5
10
15
20
25
30
35
40
310
×
Events / 5 MeV
-1D0 Run II, 10.4 fb
(a)
Data Total fit Signal Background
3.75
3.8
3.85
3.9
3.95
4
) [GeV]
-π
+π
ψ
M(J/
0
5
10
15
20
25
30
35
310
×
Events / 5 MeV
-1 D0 Run II, 10.4 fb(b)
Data Total fit Signal BackgroundFIG. 2: The invariant mass M (J/ψπ+π−) for (a) the ψ(2S)
and (b) the X(3872) selection criteria for the 5-track selection.
reflect the exponential shape of the lifetime distributions. The fit function used to describe the ψ(2S) mass dis-tribution includes two terms: a single Gaussian used to model the signal and a third-order Chebyshev polynomial used to describe background. In the specific pT and η in-tervals, the statistics in some tppbins may be insufficient for the fit to converge. In the case of a low number of background events, a second-order or a first-order Cheby-shev polynomial is used. If the number of signal events is small, the signal Gaussian mass and width are fixed to the central values obtained in the fit to the distribution including all accepted events. Possible variations in the parameters appearing in this approach are estimated and are included in the systematic uncertainty.
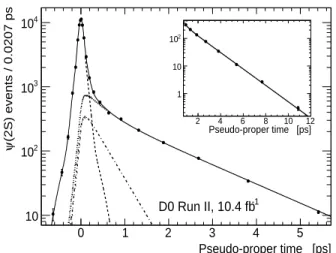
The tpp distribution for the ψ(2S) sample is shown in Fig. 3. The numbers of events/0.0207 ps shown in Fig. 3 are obtained from fits to the mass distribution and corrected to the bin center to account for the steeply falling distribution.
The obtained tpp distributions include prompt and nonprompt contributions. The prompt production is as-sumed to have a strictly zero lifetime, whereas the non-prompt component is assumed to be distributed
Pseudo-proper time [ps] 0 1 2 3 4 5 (2S) events / 0.0207 ps ψ 10 2 10 3 10 4 10 -1 D0 Run II, 10.4 fb Pseudo-proper time [ps] 2 4 6 8 10 12 1 10 2 10
FIG. 3: The number of events/0.0207 ps obtained using fits to the mass distributions for the ψ(2S) sample in pseudo-proper time bins is shown. The tail of this distribution for the large-time region is given in the inset. The solid curve shows the result of the fit by the function described in the text. Also shown are contributions from the prompt com-ponent (dashed curve), the nonprompt comcom-ponent (dotted curve) and the short-lived component (dash-dotted curve) of the nonprompt production.
tially starting from zero. These ideal signal distributions are smeared by the detector vertex resolution. The shape of the smearing function is expected to be the same for prompt and nonprompt production. Negative time val-ues are possible due to the detector resolution of primary and secondary vertices. The pseudo-proper time distri-bution parametrization method is similar to that used in the ATLAS analysis [8]. For the ψ(2S) sample, the tpp distributions are fitted using the χ2method with a model that includes prompt and nonprompt components:
F (t) = N [ (1 − fN P) FP(t) + fN P FN P(t) ]. (1) Here N is a free normalization factor, fN P is a free pa-rameter corresponding to the nonprompt contribution fraction, and FP(t) and FN P(t) are the shapes of the prompt and nonprompt components. The shape of the prompt component is modeled by a sum of three Gaus-sian functions with zero means and free normalizations and widths:
FP(t) = g1G1+ g2G2+ g3G3, (2)
where g1, g2 and g3 are normalization parameters and G1, G2 and G3 are Gaussian functions. The ψ(2S) time distribution fit yields the three Gaussian widths σ1 = 0.0476 ± 0.0016 ps, σ2 = 0.1059 ± 0.0047 ps, and σ3 = 0.264 ± 0.021 ps, and the relative normalization factors g1= 0.491 ± 0.035, g2= 0.447 ± 0.039, and g3= 0.062 ± 0.013.
The shape of the nonprompt function FN P(t) includes two terms, a short-lived (SL) component and a long-lived
(LL) component:
FN P(t) = (1 − fSL) FLL(t) + fSL FSL(t). (3) The fSL is a free parameter in the fit. The long-lived and short-lived shape functions FLL(t) and FSL(t) are described by single exponential functions with slopes τLL and τSL, convolved with the resolution shape function that is the same as for the prompt component:
FLL(t) = 1/τLL exp(−τLL t) ⊗ FP(t ), (4) FSL(t) = 1/τSL exp(−τSL t) ⊗ FP(t ). (5) The long-lived component corresponds to charmonium production from B0, B+, B0
s, and other b hadron de-cays, whereas the short-lived component is due to the B+
c decays. The production rate of the B+c mesons in the p¯p collisions at 1.96 TeV is not well known. The-oretically, the ratio of B+
c meson production over all b hadrons is expected to be about (0.1– 0.2) % [2]. How-ever, the production ratio of B+
c to B+mesons has been measured by CDF [15], and an unexpectedly large value for this ratio between 0.9 % and 1.9 % was obtained; this ratio was calculated using theoretical predictions for the branching fraction B(B+
c → J/ψµ+ν) to be in the range (1.15– 2.37) % [15]. Assuming that the ψ(2S) production rate in B+
c decays is enhanced by a factor of ∼ 20 com-pared with B+, B0 and B0
s decays, we expect a value of fSL in the range of about 0.08– 0.15. This factor can be estimated by taking into account that the B+
c meson de-cays to charmonium states via the dominant “tree” dia-gram, whereas other B hadrons produce charmonium via the “color-suppressed” diagram. On the other hand, the short-lived component fSL was measured by ATLAS [8] in pp collisions at the center-of-mass energy 8 TeV, and a value of a few percent was obtained for ψ(2S), and one of 0.25 ± 0.13 ± 0.05 for X(3872). Because of the range of possible values, we include the short-lived term with a free normalization in the lifetime fit for the ψ(2S) sample.
The tpp distribution of the ψ(2S) sample shown in Fig. 3 is well described by the function discussed above, where the exponential dependence is clearly seen in the large-time region. The fit quality is reasonably good, χ2/NDF = 24.5/14, corresponding to a p-value of 4 %. This fit quality is adequate in view of the large range of numbers of events per bin and the simplicity of the pseudo-proper time fitting function. The fitted value of the short-lived component is fSL= 0.218 ± 0.025. If the short-lived component is neglected, a significantly larger value of χ2= 112 is obtained. The parameters obtained from the fit shown in Fig. 3 are listed in Table I.
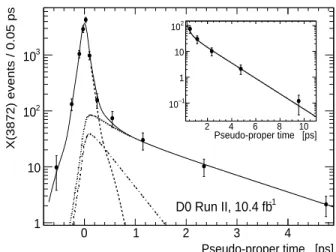
A similar method is used to obtain the pseudo-proper time distribution for the X(3872) sample. The numbers of events/0.05 ps are shown in Fig. 4. Because the num-ber of X(3872) events is an order of magnitude smaller and the combinatorial background under the signal is slightly larger than for the ψ(2S) sample, the number
TABLE I: The parameters obtained from the ψ(2S) sample fit shown in Fig.3.
Parameter Fitted values, ψ(2S)
fN P 0.328 ± 0.006
fSL 0.218 ± 0.025
τLL 1.456 ± 0.026 ps
τSL 0.38 ± 0.06 ps
of tpp bins for the mass fits is reduced from 24 to 12. The following assumptions are applied in the fit proce-dure: the vertex reconstruction resolution is the same for the X(3872) and ψ(2S) states, and the short-lived and long-lived component lifetimes and relative rates are fixed for the X(3872) to the values obtained from the ψ(2S) fit. These assumptions are based on similarity in produc-tion kinematics and an only 5 % difference in the masses of these states. The relative short-lived and long-lived rates are expected to be similar, if the ratio of inclusive branching fractions from the B+
c and other B hadrons is similar for the X(3872) and ψ(2S) states. The uncer-tainties of these assumptions are estimated and included in systematics. These systematic uncertainties are signif-icantly smaller than the statistical uncertainties, because the fN P values for X(3872) are small and the statistical uncertainties are large. Therefore, in the X(3872) tpp fit procedure, all parameters are fixed to the values obtained in the ψ(2S) pseudo-proper time fit, except the fN P pa-rameter. The prompt signal Gaussian widths are scaled by the mass ratio M (X(3872))/M (ψ(2S)) to correct for the difference in the boost factors of the X(3872) sample relative to the ψ(2S) sample, which results in a different time resolution for the same spatial resolution. We ob-tain fN P = 0.139 ± 0.025 from the fit with χ2/ NDF = 8.1 / 10.
The systematic uncertainties on fN P estimated for the full pT region are listed in Table II. They include the un-certainty due to (1) the muon reconstruction and identifi-cation efficiencies, (2) variation of the pion reconstruction efficiency in the low- and high-tpp regions, (3) different pT distribution shapes for the prompt and nonprompt events, (4) variation of the mass fit model parameters, (5) variation of the time resolution function, (6) varia-tion of the short-lived funcvaria-tion shape, (7) variavaria-tion of the long-lived function shape, and (8) production ratio of the short-lived and long-lived components.
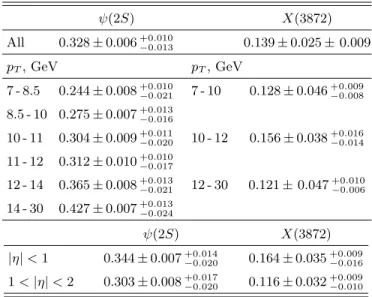
For the full pT range studied, we obtain fN P = 0.328 ± 0.006+0.010−0.013 for the ψ(2S) meson sample and fN P = 0.139 ± 0.025 ±0.009 for the X(3872) meson sample, where the first uncertainty is statistical and the second is systematic.
The large sample sizes allow us to study the tpp distri-butions in several pT intervals. We choose six pT intervals for the ψ(2S) and three for the X(3872). In addition, the fit procedure is performed by dividing the full data samples into two ψ(2S) and X(3872) pseudorapidity
Pseudo-proper time [ps] 0 1 2 3 4 X(3872) events / 0.05 ps 1 10 2 10 3 10 -1 D0 Run II, 10.4 fb Pseudo-proper time [ps] 2 4 6 8 10 1 − 10 1 10 2 10
FIG. 4: The number of events/0.05 ps obtained using fits to the mass distributions for the X(3872) sample in pseudo-proper time bins is shown. The tail of this distribution for the large-time region is given in the inset. The curve shows the re-sult of the fit to the function described in the text. Also shown are contributions from the prompt component (dashed curve), the nonprompt component (dotted curve) and the short-lived component (dash-dotted curve) of the nonprompt production. TABLE II: The systematic uncertainties in fN P (in percent)
of the ψ(2S) and X(3872) states.
Parameter ψ(2S) X(3872)
Muon reconstruction/ID efficiency ± 0.1 ± 0.1 Pion reconstruction efficiency +0.7
−0.3
+0.4 −0.2
pT distributions ± 0.3 ± 0.2
Mass fit model +0.5
−1.0
+0.5 −0.7
Resolution function ± 0.1 ± 0.1
Short-lived (SL)component shape ± 0.3 +0.3 −0.2
Long-lived (LL) component shape ± 0.2 +0.3 −0.2
Ratio of LL and SL components +0.1 −0.5
+0.5 −0.4
Sum +1.0
−1.3 ±0.9
tervals: |η| < 1 and 1 < |η| < 2. The method used to obtain parameters is the same as for the full data sam-ple. For a given pT or η interval, we first fit the ψ(2S) tpp distribution and obtain the free parameters. Then, these parameters are fixed in the fit of the X(3872) tpp distribution. For both mesons, the fraction fN P of the nonprompt component is allowed to vary in each pT or η interval. Figure 5 shows the pT dependence of fSLfor the ψ(2S); the values of this parameter are larger than the values of a few percent obtained by the ATLAS Col-laboration [8].
For all measured fN P values the systematic uncertain-ties are calculated applying the same procedure and the same variation intervals as for the whole data sample.
[GeV] T p 7 8 9 10 20 30 SL f Short-lived fraction 0 0.1 0.2 0.3 0.4 -1 D0 Run II, 10.4 fb
FIG. 5: The short-lived component fraction fSLas a function
of pT for the ψ(2S) states. Only statistical uncertainties are
shown.
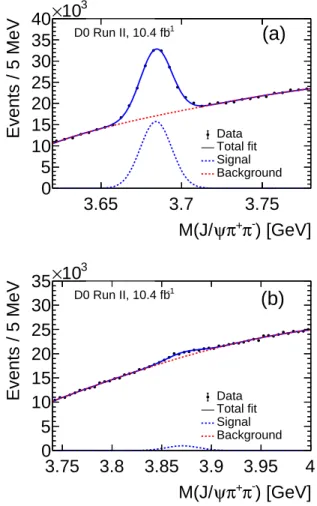
The values of nonprompt fractions for the ψ(2S) and X(3872) states in different pT or η intervals with the statistical and systematic uncertainties are given in Ta-ble III. Figure 6 shows fN P as a function of pT for the ψ(2S), compared with the ATLAS [8] measurement at 8 TeV, the CMS [16] measurement at 7 TeV, and the CDF [17] measurement at 1.96 TeV. Figure 7 shows sim-ilar distributions for the X(3872) obtained in this analy-sis, together with the ATLAS [8] and CMS [7] measure-ments. The D0 measurements of fN P are systematically below the ATLAS [8] and CMS [7] points obtained at higher center-of-mass energies, although the LHC mea-surements are restricted to more central pseudorapidity regions. The small differences between the CDF and D0 ψ(2S) measurements can be ascribed to differences in pseudorapidity acceptance. However, the general ten-dencies are very similar: the fN P values increase with pT in the case of ψ(2S) state production, whereas the fN P values for X(3872) are independent of pT within large uncertainties.
We summarize the measurements of this section as fol-lows:
1. The nonprompt fractions for ψ(2S) increase as a function of pT, whereas those for X(3872) are con-sistent with being independent of pT. These trends are similar to those seen at the LHC. The Teva-tron values tend to be somewhat smaller than those measured by ATLAS and CMS.
2. The ratio of prompt to nonprompt ψ(2S) pro-duction, Rp/np = (1 − fN P)/fN P, increases only slightly going from the LHC to the Tevatron. As can be seen in Fig. 6, the fN P values in the 9 –10 GeV range are 0.35 ± 0.03 for LHC data and 0.30 ± 0.02 for Tevatron data, resulting in increase in Rp/np of (7 – 47) % (68.3 % confidence interval). [GeV] T p 7 8 9 10 20 30 40 NP f (2S) fraction ψ Nonprompt 0.1 0.2 0.3 0.4 0.5 0.6 D0 Run II, 10.4 fb-1 -1 |<2, 1.96 TeV, 10.4 fb η D0, | -1 CDF, |y|<0.6, 1.96 TeV, 1.1 fb -1 CMS, |y|<1.2, 7 TeV, 37 pb -1 ATLAS, |y|<0.75, 8 TeV, 11.4 fb
FIG. 6: The nonprompt component fN P for the ψ(2S) states
as a function of pT. Red circles correspond to this analysis,
magenta boxes to the ATLAS [8] measurement, green crosses to the CMS [16] measurement, and blue triangles to CDF [17]. The uncertainties shown are total uncertainties, except for the CDF points, for which only the statistical uncertainties are displayed. The D0 and ATLAS analyses are performed using ψ(2S) → J/ψπ+
π− decay channel, whereas the CMS and
CDF data are obtained through the ψ(2S) → µ+
µ−decay. [GeV] T p 7 8 9 10 20 30 40 50 60 NP f Nonprompt X(3872) fraction 0 0.1 0.2 0.3 0.4 0.5 0.6 0.7 -1
D0 Run II, 10.4 fb D0, |η|<2, 1.96 TeV, 10.4 fb-1-1
CMS, |y|<1.2, 7 TeV, 4.8 fb -1 ATLAS, |y|<0.75, 8 TeV, 11.4 fb
FIG. 7: The nonprompt component fN P for the X(3872)
states as a function of pT. Red circles correspond to this
analysis, magenta boxes to the ATLAS [8] measurement and green crosses to the CMS [7] measurement. The uncertainties shown are total uncertainties.
At low pT, the CMS data points have large sta-tistical uncertainties, but the Tevatron data can be compared to the LHCb measurement of ψ(2S) fN P values [18] at 7 TeV for 2.0 < y < 2.5 and 6 < pT < 14 GeV. The LHCb Rp/np values are about (25 – 30) % smaller than those from the Teva-tron, after adjustment for the variation with pseu-dorapidity. The LHCb data indicate a reduction of
TABLE III: The values of nonprompt fractions fN P for the
ψ(2S) and X(3872) states in pT and η intervals with the
sta-tistical and systematic uncertainties are given.
ψ(2S) X(3872) All 0.328 ± 0.006+0.010−0.013 0.139 ± 0.025 ± 0.009 pT, GeV pT, GeV 7 - 8.5 0.244 ± 0.008+0.010 −0.021 7 - 10 0.128 ± 0.046 +0.009 −0.008 8.5 - 10 0.275 ± 0.007+0.013 −0.016 10 - 11 0.304 ± 0.009+0.011 −0.020 10 - 12 0.156 ± 0.038 +0.016 −0.014 11 - 12 0.312 ± 0.010+0.010−0.017 12 - 14 0.365 ± 0.008+0.013 −0.021 12 - 30 0.121 ± 0.047 +0.010 −0.006 14 - 30 0.427 ± 0.007+0.013−0.024 ψ(2S) X(3872) |η| < 1 0.344 ± 0.007+0.014 −0.020 0.164 ± 0.035 +0.009 −0.016 1 < |η| < 2 0.303 ± 0.008+0.017 −0.020 0.116 ± 0.032 +0.009 −0.010
fN P by 0.02 – 0.03 for each reduction in rapidity by one unit.
3. The ATLAS value of fN P = 0.328 ± 0.026 for the X(3872) differs from the D0 value of fN P = 0.139 ± 0.027 by 5.0 σ, taking into account both statistical and systematic uncertainties and assuming a uni-form pT distribution. This gives an increase in the Rp/npratio by a factor of ∼ 3 (the range 2.4 – 4.0 for the 68.3 % confidence interval) going from the LHC to the Tevatron. It has to be noted that this differ-ence may be partially compensated by the larger ra-pidity interval covered by D0. This increase of the Rp/np value indicates that the prompt production of the exotic state X(3872) relative to the b hadron production is strongly suppressed at the LHC in comparison with the Tevatron conditions. This suppression is possibly due to more particles pro-duced in the primary collision at LHC that increase the probability to disassociate the nearly unbound and possibly spatially extended X(3872) [19, 20].
IV. HADRONIC ACTIVITY AROUND THE
ψ(2S) AND X(3872) STATES
In this section, we study the association of the ψ(2S) or X(3872) states with another particle assumed to be a pion using the 5-track sample. We study the dependence of the production of these two states on the surrounding hadronic activity. We also test the soft-pion signature of the X(3872) as a weakly bound charm-meson pair by studying the production of X(3872) at small kinetic en-ergy of the X(3872) and the π in the X(3872)π center-of-mass frame.
The data are separated into a “prompt” sample, defined by the conditions Lxy < 0.025 cm and Lxy/σ(Lxy) < 3 and a “nonprompt” sample defined by Lxy > 0.025 cm and Lxy/σ(Lxy) > 3, where Lxy is the decay length of the J/ψπ+π− system in the transverse plane.
In these studies, the uncertainties in the results are dominated by the statistical uncertainties in the fitted X(3872) yields. In the limited mass range around the ψ(2S) or X(3872), the background is smooth and mono-tonic, and is well described by low-order Chebyshev poly-nomials. Depending on the size of a given subsample, the polynomial order is set to 2 or 3. In all cases, the differ-ence between the yields for the two background choices is less than 30% of the statistical uncertainty. The small systematic uncertainties are ignored.
A. ψ(2S) and X(3872) isolation
The LHCb Collaboration has studied [20] the depen-dence of production cross sections of the X(3872) and ψ(2S) on the hadronic activity in an event, which is ap-proximated using a measure of the charged particle mul-tiplicity. The authors found the ratio of the cross sections for promptly produced particles, σ(X(3872))/σ(ψ(2S)), to decrease with increasing multiplicity and observed that this behavior is consistent with the interpretation of the X(3872) as a weakly bound state, such as a D0D¯∗0 hadronic molecule. In this scenario, interactions with co-moving hadrons produced in the collision disassociate the large, weakly bound X(3872) state more than the rela-tively compact conventional charmonium state ψ(2S).
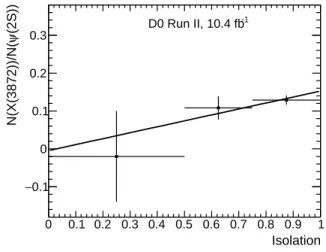
In this study of the production of charmonium-like states, we introduce isolation as an observable quanti-fying the hadronic activity in a restricted cone in the φ − η space around the candidate, ∆R =p∆φ2+ ∆η2. We define the isolation as a ratio of the candidate’s mo-mentum to the scalar sum of the momenta of all charged particles pointing to the primary vertex produced in a cone of ∆R = 1 around the candidate and the candidate itself. Distributions of isolation for prompt ψ(2S)π and X(3872)π normalized to unity are shown in Fig. 8, and the ratio of the unnormalized distributions is shown in Fig. 9. The shapes of the two isolation distributions are similar. The difference between the χ2 values obtained for fits to the ratio as a function of isolation assuming a free slope and zero slope corresponds to 1.2 σ. This gives modest support for the hypothesis that increased hadronic activity near X(3872) depresses its production.
B. Search for the soft-pion effect
Recent theoretical work [9, 10] predicts a sizable con-tribution to the production of the X(3872), both directly in the hadronic beam collisions and in b hadron decays, from the formation of the X(3872) in association with a
0 0.1 0.2 0.3 0.4 0.5 0.6 0.7 0.8 0.9 1 Isolation 0 0.2 0.4 0.6 0.8 1 N/N ∆ D0 Run II, 10.4 fb-1 π (2S) ψ π X(3872)
FIG. 8: Normalized yields of the ψ(2S)π (black open circles) and the X(3872)π (blue triangles) as functions of isolation for the prompt sample.
0 0.1 0.2 0.3 0.4 0.5 0.6 0.7 0.8 0.9 1 Isolation 0.1 − 0 0.1 0.2 0.3 (2S)) ψ N(X(3872))/N( -1 D0 Run II, 10.4 fb
FIG. 9: The ratio of the unnormalized X(3872) and ψ(2S) yields as a function of isolation for the prompt sample.
comoving pion. According to the authors, the X(3872), assumed to be a D ¯D∗ molecule, is produced by the cre-ation of D ¯D∗ at short distances. But it can also be pro-duced by the creation of D∗D¯∗ at short distances, fol-lowed by a rescattering of the charm-meson pair into a X(3872)π pair by exchanging a D meson. The cross sec-tion from this mechanism would have a narrow peak in the X(3872)π invariant mass distribution near the D∗D¯∗ threshold from a triangle singularity that occurs when the three particles participating in a rescattering are all near the mass shell.
A convenient variable to quantify this effect is the kinetic energy T (Xπ) of the X(3872) and the π in the X(3872)π center-of-mass frame. The authors de-fine the peak region to be 0 ≤ T (Xπ) ≤ 2δ1 where δ1= M (D∗+) − M(D0) − M(π+) = 5.9 MeV. The effect is sensitive to the D ¯D∗binding energy whose current es-timated value is (−0.01 ± 0.18) MeV. The peak height
is expected to decrease with increasing binding energy. It also depends on the value of the momentum scale Λ, expected to be of the order of M (π+). For the conserva-tive choice of a binding energy of 0.17 MeV, the yield in the peak region is predicted to be smaller than the yield without a soft pion by a factor ∼ 0.14(M(π+)/Λ)2. For Λ = M (π+), this ratio is equal to 0.14. We search for this effect separately in the “prompt” and “nonprompt” samples.
1. Prompt production
As a benchmark, we use the ψ(2S), for which no soft-pion effect is expected. We select combinations J/ψπ+π+π− that have a J/ψπ+π− combination in the mass range 3.62 < M (J/ψπ+π−) < 3.74 GeV. The to-tal number of entries is 310 636, and the ψ(2S) signal has 48 711 ± 511 events. The mass distributions and fits are shown in Fig. 10. After the T (ψ(2S)π) < 11.8 MeV cut, the number of entries is 368 and the signal yield is 44 ± 14 events. The cut T (ψ(2S)π) < 11.8 MeV keeps a fraction 0.0009 ± 0.0003 of the signal, in agreement with the measured reduction of the combinatorial background by a factor of 0.0012. As expected, there is no evidence for a soft-pion effect for ψ(2S).
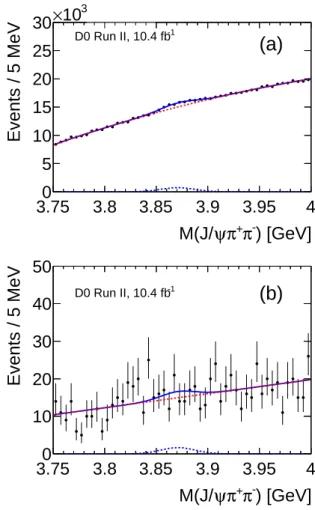
Then, we select J/ψπ+π+π− combinations that have a J/ψπ+π− combination in the mass range 3.75 < M (J/ψπ+π−) < 4.0 GeV, that includes the X(3872). The total number of selected entries is 749 179 and the X(3872) signal yield is 6 157 ± 599 events. The mass distributions and fits are shown in Fig. 11. The signal consists of a X(3872) meson produced together with a charged particle. It includes possible pairs of a X(3872) meson and an associated soft pion from the triangle sin-gularity. The background is due to random combinations of a J/ψ meson and three charged particles. The cut T (Xπ) < 11.8 MeV should remove the bulk of random X(3872)-pion combinations while keeping the events due to the triangle singularity. For this subsample of 730 events, the fitted signal yield is 18 ± 16 events. Thus, the cut T (Xπ) < 11.8 MeV keeps a fraction 0.003 ± 0.003 of the signal, consistent with the background reduction by a factor of 0.00097 ± 0.00004. In the absence of the soft-pion process, the expected yield at small T (Xπ) is N = 6157 × 0.00097 = 6 events. With the measured yield of 18 ± 16 events, the net excess is 12 ± 16 events. The 90% C.L. upper limit is 43 events, which is less than 0.007 of the total number of accepted events.
To compare this result with the expected number of accepted soft-pion events, we make a rough estimate of the kinematic acceptance for events above and below the 11.8 MeV cutoff. The main factor is the loss of pions produced with pT < 0.5 GeV that strongly depends on T (Xπ), given the pT distribution of the X(3872).
The transverse momentum distributions of pions in the two subsamples are shown in Fig. 12. Above 0.5 GeV, the distributions fall exponentially. Below the 0.5 GeV threshold, the spectrum must rise from the minimum kinematically allowed value to a peak followed by the
ex-3.62 3.64 3.66 3.68 3.7 3.72 3.74
) [GeV]
-π
+π
ψ
M(J/
0
5
10
15
20
25
310
×
Events / 5 MeV
-1 D0 Run II, 10.4 fb(a)
3.62 3.64 3.66 3.68 3.7 3.72 3.74
) [GeV]
-π
+π
ψ
M(J/
0
10
20
30
40
50
Events / 5 MeV
-1 D0 Run II, 10.4 fb(b)
FIG. 10: M (J/ψπ+π−) distribution and fits for the ψ(2S)
signal for the prompt subsample for (a) all selected events and (b) events passing the T (ψ(2S)π) < 11.8 MeV cut.
ponential falloff. For events with T (Xπ) >11.8 MeV, we fit the distribution to the function N · pT· exp(−pT/pT 0) and define the acceptance A as the ratio of the integral from 0.5 GeV to infinity to the integral from zero to in-finity. The result is 0.6. With alternate functions, the acceptance values vary from 0.3 to 0.9. Figure 12 shows two fits with similar behavior above threshold but differ-ent below threshold, the default function and the function N · (1 − exp(−pT/pT 1)) · exp(−pT/pT 2).
For events with T (Xπ) < 11.8 MeV, the pT distribu-tion of the accompanying pion is closely related to the pT of the X(3872). To determine the pion acceptance, we employ a simplified MC model, starting with the differ-ential cross section as a function of T (Xπ) <11.8 MeV given in Ref. [9]. For a X(3872) with a given pT(X), the X and pion are distributed isotropically in the Xπ rest frame. The transverse momentum of the pion pT(π) in the laboratory frame is determined by transforming to the X(3872) rest frame, using the chosen pT(X) and a rapidity y(X) chosen from a uniform distribution |y| < 2, and then transforming to the laboratory frame. The pion acceptance as a function of pT(X), A(pT(X)), is then
3.75
3.8
3.85
3.9
3.95
4
) [GeV]
-π
+π
ψ
M(J/
0
5
10
15
20
25
30
310
×
Events / 5 MeV
-1 D0 Run II, 10.4 fb(a)
3.75
3.8
3.85
3.9
3.95
4
) [GeV]
-π
+π
ψ
M(J/
0
10
20
30
40
50
Events / 5 MeV
-1 D0 Run II, 10.4 fb(b)
FIG. 11: M (J/ψπ+π−) distribution and fits for the X(3872)
signal for the prompt subsample for (a) all selected events and (b) events passing the T (Xπ) < 11.8 MeV cut.
convolved with the fitted X(3872) yield dN/dpT(X) as a function of pT(X) to determine the overall acceptance for pions.
Our observed dN/dpT distribution for the X(3872) is found by dividing the mass distribution for J/ψπ+π− in Fig. 11(a) for the 5-track sample into seven pT bins each 2 GeV wide, between 7 and 21 GeV, and fitting for the yield of the X(3872) for each bin. This produces a background-subtracted sample; however, it has relatively large statistical uncertainties. These seven dN/dpT yield points for the X(3872) are plotted in Fig. 13. The higher statistics and finer-binned yield for inclusive J/ψπ+π− events over the mass range 3850 – 3900 MeV of Fig. 11(a) as a function of pT is used to check the shape of the pT distribution of the X(3872). After scaling to equal ar-eas, dN/dpT(J/ψπ+π−) shows a good agreement within statistical uncertainties with the X(3872) spectrum, thus indicating a comparable behavior of the X(3872) signal and background.
Fits of the background-subtracted yields using the functions pb
T·exp(a+c·pT) and (pT−b)·exp(a+c·pT) are shown in Fig. 13, along with the products A(pT)·dN/dpT,
0
0.2 0.4 0.6 0.8
1
1.2 1.4
) [GeV]
π
(
Tp
210
310
410
510
610
Events / 5 MeV
)>11.8 MeV π T(X )<11.8 MeV π T(X )<11.8 MeV MC π T(X -1 D0 Run II, 10.4 fbFIG. 12: Transverse momentum distribution of pion candi-dates for events above and below the T (Xπ) = 11.8 MeV cutoff for prompt events in the mass range 3.75 < M (J/ψπ+
π−) < 4 GeV. The former is compared to two
fits discussed in the text. Extrapolation of the latter below threshold follows the method described in the text.
8 10 12 14 16 18 20 [GeV] T p 0 500 1000 1500 2000 2500 3000 3500 4000 4500 Events / 2 GeV -1 D0 Run II, 10.4 fb X(3872) ) T -b)*exp(a+cp T (p ) T exp(a+c-p b T p ) T -b)exp(a+cp T )(p T A(p ) T exp(a+cp b T )p T A(p -π + π ψ Scaled J/
FIG. 13: The transverse momentum distribution for the background-subtracted mass-fitted X(3872) (filled circles) and two fits representing the high and low ranges of the acceptance for the accompanying pion. The dashed curves represent A(pT) · dN/dpT(X(3872)). The overall acceptance
for the accompanying pion is the ratio of the areas below A · dN/pT(X) curves and the corresponding dN/dpT(X) fits.
For comparison, the scaled pT distribution of the inclusive
J/ψππ for 3.85 < M (J/ψπ+
π−) < 3.9 GeV (open blue cir-cles) is overlaid, illustrating their similarity in shape.
which allow the calculation of the acceptance for pT(π) > 0.5 GeV for events with pT(X) > 7 GeV. We find the ac-ceptances A = 0.278 ± 0.031 and 0.296 ± 0.036 for the two functions, respectively, where the uncertainties are due to the statistical uncertainty in the determination of the dN/dpT(X) distribution. Additional functions were used to fit dN/dpT(X). The aforementioned functions yield the lowest and highest pion acceptances obtained
from the different forms. Their difference is considered as the systematic uncertainty associated with the choice of parametrization. We average the two results to obtain A = 0.29 ± 0.03 (stat) ± 0.02 (syst).
For the prompt case, this leads to the expected num-ber of produced X(3872) events at N = 18/0.29 + 6139/0.6 ≈ 10 000 with an uncertainty of about ± 50%. With N = N1+ N0, where N1 is the number of events with a soft pion, and the relation N1 = 0.14 · N0, N ≈ 10 000 × 0.14/1.14 ≈ 1300 events would be pro-duced through the soft-pion process with an uncertainty of about 650 events, and between 245 and 730 would be accepted. That is much larger than the observed 12 ± 16 events. We conclude that there is no evidence for the soft-pion effect in the prompt sample.
2. Nonprompt production
The kinematics of the prompt and nonprompt samples are sufficiently similar to use the acceptance derived for the prompt case for both samples. Calculations anal-ogous to those for the prompt case give the following results for the nonprompt sample. For the ψ(2S), the kinetic energy cut keeps a fraction of 0.004 ± 0.001 of the signal, in agreement with the reduction by a factor of 0.003 of the total number of entries.
For the X(3872), the signal yields before and after the cut are 703 ± 25 and 27 ± 12, respectively. The cut ac-cepts a fraction 0.04 ± 0.02 of the signal. The corre-sponding reduction in the total number of events in the distribution is by a factor of 0.0029 ± 0.0001. For a ran-dom pairing of the X(3872) with a pion, the expected yield at small T (Xπ) is N = 703 × 0.0029 = 2 events, leading to a net excess of 25 ± 12 events. The statistical significance of the excess, based on the χ2 difference be-tween the fit with a free signal yield and the fixed value of N = 2 expected for the “random pairing only” case, is 2 σ. Correcting for soft-pion acceptance, the number of produced nonprompt X(3872) before the kinematic cut is in the range 800 – 2000. Assuming the ratio of 0.14 between the cross section for production with a soft pion to the cross section for production without a soft pion [9], we estimate the expected number of produced soft-pion events to be in the range 100 – 300. With the acceptance of 0.29 ± 0.04, the expected number of accepted soft-pion events is between 30 and 90. The measured excess yield of 25 ± 12 events is in agreement with this expectation; however the fact that our yield agrees within 2 σ with the null hypothesis of no soft-pion events prevents drawing a definite conclusion.
For further details on the distribution of the non-prompt signal versus T (Xπ), we fit the X(3872) mass distributions into 2 MeV bins of T (Xπ) from 0 to 10 MeV and into 40 MeV bins from 10 to 490 MeV. The resulting distribution of events/2 MeV is shown in Fig. 14. Above ∼10 MeV, the observed spectrum is consistent with the pairing of a X(3872) with a random particle. It is simi-lar to the T (Xπ) distribution of all nonprompt X(3872) candidates. At lower T (Xπ), there is a small excess,
0
2
4
6
8
10
) MeV
π
T(X
5
−
0
5
10
15
20
25
N/ 2 MeV
-1D0 Run II, 10.4 fb
(a)
1
10
10
2) MeV
π
T(X
5
−
0
5
10
15
20
25
N/ 2 MeV
-1 D0 Run II, 10.4 fb(b)
FIG. 14: The fitted X(3872) signal yield as a function of T (Xπ) for nonprompt events with (a) the soft-pion produc-tion region and (b) extended range. The first five points in (b) are the same as those in (a). The blue line shows the dis-tribution of the T (Xπ) for all nonprompt X(3872) candidates scaled down to the total X(3872) yield.
with a significance of 2 σ, above the random pairing, at the level consistent with the predictions of Ref. [9]. We again conclude that there is no significant evidence for the soft-pion effect, but its presence at the level expected for the binding energy of 0.17 MeV and the momentum scale Λ = M (π) is not ruled out.
V. SUMMARY AND CONCLUSIONS
We have presented various properties of the produc-tion of the ψ(2S) and X(3872) in Tevatron p¯p collisions. For both states, we have measured the fraction fN P of the inclusive production rate due to decays of b-flavored hadrons as a function of the transverse momentum pT. Our nonprompt fractions for ψ(2S) increase as a function of pT, whereas those for X(3872) are consistent with be-ing independent of pT. These trends are similar to those seen at the LHC. The Tevatron values tend to be
some-what smaller than those measured by ATLAS and CMS, but this difference can at least partially be accounted for by the larger rapidity interval covered by D0. The ratio of prompt to nonprompt ψ(2S) production, (1−fN P)/fN P, decreases only slightly going from the Tevatron to the LHC, but in comparing the 8 TeV ATLAS data to the 1.96 TeV D0 data for the X(3872) production, this ratio decreases by a factor of approximately 3. This indicates that the prompt production of the exotic state X(3872) is suppressed at the LHC, possibly due to the production of more particles in the primary collision that increases the probability to disassociate the nearly unbound and possibly more spatially extended X(3872) state.
We have tested the soft-pion signature of the X(3872) modeled as a weakly bound charm-meson pair by study-ing the production of the X(3872) as a function of the kinetic energy of the X(3872) and the pion in the Xπ center-of-mass frame. For a subsample consistent with prompt production, the results are incompatible with a strong enhancement in the production of the X(3872) at small T (Xπ) expected for the X+soft-pion production mechanism. For events consistent with being due to de-cays of b hadrons, there is no significant evidence for the soft-pion effect, but its presence at the level expected for the binding energy of 0.17 MeV and the momentum scale Λ = M (π) is not ruled out.
ACKNOWLEDGMENTS
This document was prepared by the D0 Collaboration using the resources of the Fermi National Accelerator Laboratory (Fermilab), a U.S. Department of Energy, Of-fice of Science, HEP User Facility. Fermilab is managed by Fermi Research Alliance, LLC (FRA), acting under Contract No. DE-AC02-07CH11359.
We thank Eric Braaten for useful discussions. We thank the staffs at Fermilab and collaborating institu-tions, and acknowledge support from the Department of Energy and National Science Foundation (United States of America); Alternative Energies and Atomic En-ergy Commission and National Center for Scientific Re-search/National Institute of Nuclear and Particle Physics (France); Ministry of Education and Science of the Rus-sian Federation, National Research Center “Kurchatov Institute” of the Russian Federation, and Russian Foun-dation for Basic Research (Russia); National Council for the Development of Science and Technology and Carlos Chagas Filho Foundation for the Support of Research in the State of Rio de Janeiro (Brazil); Department of Atomic Energy and Department of Science and Tech-nology (India); Administrative Department of Science, Technology and Innovation (Colombia); National Council of Science and Technology (Mexico); National Research Foundation of Korea (Korea); Foundation for Funda-mental Research on Matter (The Netherlands); Science and Technology Facilities Council and The Royal Soci-ety (United Kingdom); Ministry of Education, Youth and
Sports (Czech Republic); Bundesministerium f¨ur Bildung und Forschung (Federal Ministry of Education and Re-search) and Deutsche Forschungsgemeinschaft (German Research Foundation) (Germany); Science Foundation
Ireland (Ireland); Swedish Research Council (Sweden); China Academy of Sciences and National Natural Science Foundation of China (China); and Ministry of Education and Science of Ukraine (Ukraine).
[1] S.-K. Choi et al. (Belle Collaboration), Observation of a Narrow Charmonium-Like State in Exclusive B±
→ K+−π+
π−J/ψ Decays, Phys. Rev. Lett. 91, 262001
(2003).
[2] P.A. Zyla et al. (Particle Data Group), The review of par-ticle physics 2020, Prog. Theor. Exp. Phys. 2020, 083C01 (2020).
[3] N.A. T¨ornqvist, Isospin breaking of the narrow charmo-nium state of Belle at 3872 MeV as a deuson’, Phys. Lett. B 590, 209 (2004).
[4] C. Bignamini, B. Grinstein, F. Piccinini, A.D. Polosa and C. Sabelli, Is the X(3872) Production Cross Section at√s = 1.96 TeV Compatible with a Hadron Molecule Interpretation?, Phys. Rev. Lett. 103, 162001 (2009). [5] C. Meng, Y.-J. Gao and K.-T. Chao, B → χc1(1P, 2P )K
decays in QCD factorization and X(3872), Phys. Rev. D 87, 074035 (2013).
[6] C. Meng, H. Han and K.-T. Chao, X(3872) and its pro-duction at hadron colliders, Phys. Rev. D 96, 074014 (2017).
[7] S. Chatrchyan et al. (CMS Collaboration), Measurement of the X(3872) production cross section via decays to J/ψπ+
π−in pp collisions at√s = 7 TeV, J. High Energy
Phys. 04 (2013) 154.
[8] M. Aaboud et al. (ATLAS Collaboration), Measurements of ψ(2S) and X(3872) → J/ψπ+
π− production in pp
collisions at√s = 8 TeV with the ATLAS detector, J. High Energy Phys 01 (2017) 117.
[9] E. Braaten, L.-P. He, and K. Ingles, Production of X(3872) accompanied by a soft pion at hadron colliders, Phys. Rev. D 100, 094006 (2019).
[10] E. Braaten, L.-P. He, and K. Ingles, Production of
X(3872) accompanied by a pion in B meson decay, Phys. Rev. D 100, 074028 (2019).
[11] V. M. Abazov et al. (D0 Collaboration), The upgraded D0 detector, Nucl. Instrum. Methods Phys. Res., Sect. A 565, 463 (2006).
[12] R. Angstadt et al., The layer 0 inner silicon detector of the D0 experiment, Nucl. Instrum. Methods Phys. Res., Sect. A 622, 298 (2010).
[13] η = − − ln[tan(θ/2)] is the pseudorapidity and θ is the polar angle between the track momentum and the proton beam direction. φ is the azimuthal angle of the track. [14] V. M. Abazov et al. (D0 Collaboration), The muon
sys-tem of the Run II D0 detector, Nucl. Instrum. Methods Phys. Res., Sect. A 552, 372 (2005).
[15] T. Aaltonen et al. (CDF Collaboration), Measurement of the B±
c production cross section in p¯p collisions at
√ s = 1.96 TeV, Phys. Rev. D 93, 052001 (2016).
[16] S. Chatrchyan et al. (CMS Collaboration), J/ψ and ψ(2S) production in pp collisions at√s = 7 TeV, J. High Energy Phys. 02 (2012) 011.
[17] T. Aaltonen et al. (CDF Collaboration), Production of ψ(2S) mesons in p¯p collisions at√s = 1.96 TeV, Phys. Rev. D 80, 031103 (2009).
[18] R. Aaij et al. (LHCb Collaboration), Measurement of ψ(2S) production cross-section in proton-proton colli-sions at 7 and 13 TeV, Eur. Phys. J. C 80, 485 (2020). [19] A. Espositi et al., The nature of X(3872) from
high-multiplicity pp collision, arXiv:2006.15044.
[20] R. Aaij et al. (LHCb Collaboration), Observation of multiplicity-dependent prompt χc1(3872) and ψ(2S)
![FIG. 7: The nonprompt component f N P for the X (3872) states as a function of p T . Red circles correspond to this analysis, magenta boxes to the ATLAS [8] measurement and green crosses to the CMS [7] measurement](https://thumb-eu.123doks.com/thumbv2/123doknet/14009108.456412/8.918.493.834.548.822/nonprompt-component-function-circles-correspond-analysis-measurement-measurement.webp)