Publisher’s version / Version de l'éditeur: ASHRAE Preprint, 4158, pp. 1-5, 1998-01-01
READ THESE TERMS AND CONDITIONS CAREFULLY BEFORE USING THIS WEBSITE. https://nrc-publications.canada.ca/eng/copyright
Vous avez des questions? Nous pouvons vous aider. Pour communiquer directement avec un auteur, consultez la
première page de la revue dans laquelle son article a été publié afin de trouver ses coordonnées. Si vous n’arrivez pas à les repérer, communiquez avec nous à [email protected].
Questions? Contact the NRC Publications Archive team at
[email protected]. If you wish to email the authors directly, please see the first page of the publication for their contact information.
Archives des publications du CNRC
This publication could be one of several versions: author’s original, accepted manuscript or the publisher’s version. / La version de cette publication peut être l’une des suivantes : la version prépublication de l’auteur, la version acceptée du manuscrit ou la version de l’éditeur.
Access and use of this website and the material on it are subject to the Terms and Conditions set forth at Environmental correction factors for predicting room sound pressure levels
Warnock, A. C. C.
https://publications-cnrc.canada.ca/fra/droits
L’accès à ce site Web et l’utilisation de son contenu sont assujettis aux conditions présentées dans le site LISEZ CES CONDITIONS ATTENTIVEMENT AVANT D’UTILISER CE SITE WEB.
NRC Publications Record / Notice d'Archives des publications de CNRC:
https://nrc-publications.canada.ca/eng/view/object/?id=e3915665-0b0c-4c88-836c-c456d01f8edd https://publications-cnrc.canada.ca/fra/voir/objet/?id=e3915665-0b0c-4c88-836c-c456d01f8edd
Environmental Correction Factors for Predicting Room Sound
Pressure Levels
A.C.C. Warnock, Ph. D., Member of ASHRAE, Institute for Research in Construction, National Research Council Canada
A version of this paper was published in ASHRAE Preprints, 4158, ASHRAE Winter Meeting (San Francisco, 1/1/98), pp. 1-5, 1998
Résumé ARI standard 885 provides a method for calculating sound pressure levels in rooms below plenums containing air-handling devices. An important step in the calculation is the correction of the sound power for the device from values provided by the manufacturer to values appropriate for use in occupied spaces. This correction is called the “environmental adjustment factor”. It compensates for the fact that sound power measured for a source placed outdoors or in a hemi-free field has been found to be greater at low frequencies than the sound power measured for the same source in a reverberation room. When making predictions of sound pressure level in a room using such sound power levels, one has to estimate the reduction in sound power caused by the room. Estimated reductions provided in ARI 885 were examined during ASHRAE RP755 and found to be too large. Lower values are suggested in this paper.
ENVIRONMENTAL CORRECTION FACTORS FOR PREDICTING
ROOM SOUND PRESSURE LEVELS
†.
INTRODUCTION
ARI standard 885 (ARI85, 1990) was created to provide a consistent method for calculating sound pressure levels in rooms below plenums containing air-handling devices. One of the major steps in the calculation is the correction of the sound power for the device from values provided by the manufacturer to values more appropriate for use in occupied spaces. This correction is called the “environmental adjustment factor”. It is necessary because the sound power measured for a source placed on the floor of a hemi-anechoic space is generally found to be greater at low frequencies than that for the same source placed on the floor of a reverberation room or any room where there are reflections from walls or the ceiling. The source is not able to transfer sound power effectively to the room because the impedance of the room changes rapidly with frequency. When a sound source is placed in a hemi-anechoic field, there are no such reflections and the sound power emitted by the source is not influenced by any room effects.
ARI 880 requires that devices be tested according to ANSI 12.31 in a
reverberation room using the substitution technique. With this technique, the sound pressure levels generated by the device under test and a calibrated reference sound source are measured in turn. The differences between these levels are combined with the known
†
power levels of the reference source to obtain the power of the device under test. Sound power levels for reference sources are obtained from measurements in a hemi-anechoic space – a hemi-free field following ISO 6926. It follows that, adherence to the ARI 880 procedure means that the power levels measured in the reverberation room are equivalent to free-field power levels, assuming that both sources are influenced by the reverberation room in the same way.
Air distribution devices are used in normal rooms whose response to a source depends on room shape, furnishings and size. As in a reverberation room, the sound power of the device can be expected to be lower than the hemi-free field value. To account for room response, an environmental correction is needed. The ARI 885 environmental correction was one parameter that was considered during ASHRAE
project RP755 (Warnock, 1997). No measurements were made specifically to address the correction but some data available from the project and other measurements were
examined. This paper discusses the conclusions reached.
REVERBERANT ROOM RESPONSE TO A SOUND SOURCE.
Measured sound power levels in reverberation rooms are lower at low frequencies than those measured in a hemi-free field for a number of reasons. A major reason is the pronounced modal response of rooms at low frequencies. Sound from a source in a reverberation room is reflected many times by the walls of the room. At certain
frequencies the sound waves reflecting from the room surfaces follow closed paths whose lengths are an integral number of half wavelengths. The room responds strongly at these
resonance frequencies. The modal frequencies, fijk, in a room that is a rectangular parallelepiped can be calculated using
2 1 2 2 2 2 úúû ù ê ê ë é ÷ ø ö ç è æ + ÷ ø ö ç è æ + ÷ ø ö ç è æ = H k B j L i c fijk
where L, B, and H are the length, breadth and height of the room and c is the speed of sound in air. The modal indices i, j and k are integers with values 0, 1, 2, … that determine the frequency and type of a particular mode. The number of modes in a particular frequency band is given approximately by
þ ý ü î í ì + π + π = c V c V c Vf k N 3 1 2 3 2 3 3 5 . 1 3 4
where V is the volume of the room, f is the frequency of sound at the middle of the band of interest and k has the value 0.23 for 1/3 octave bands and 0.71 for octave bands. Thus in a 150 m3 room (5295 ft3), the number of modes in the 63 Hz octave band is about 15.
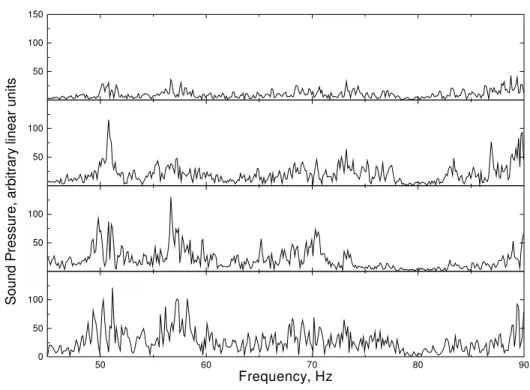
To illustrate some of the difficulties of making measurements in a reverberation room at low frequencies, Figure 1 shows the frequency response of a 175 m3 non-rectangular reverberation room measured at a single microphone position when a fan reference sound source was placed in four different positions in the room. Some of the strong peaks in the response correspond to the modes of the room, but the room response is convolved with the spectrum of the reference source, which makes the resultant spectra quite complex.
50 60 70 80 90 0 50 100 Frequency, Hz 50 100 S oun d P re ss ur e, a rbi tr ar y li ne ar un its 50 100 50 100 150
Figure 1: Response of a fixed microphone in a reverberation room to a fan source in four different positions in the room.
When the room response is measured using loudspeakers, which have a smoother output than the reference sound source, the measured frequency response is much
smoother and room modes can be more easily identified, as shown in Figure 2. Note that while the measurement were made in the same room with the microphone in the same fixed position, the positions of the reference sound source and the loudspeakers were not the same in these two figures.
50 60 70 80 90 0 50 100 150 200 Frequency, Hz 50 100 150 200 Sound P res sur e, ar bitr ar y linear units 50 100 150 200 50 100 150 200 250
Figure 2: Response of the same microphone in the same reverberation room measured using a loudspeaker in four different locations.
What these figures make clear is that a room responds differently when the source is in different positions. Thus, when measuring sound power in a reverberation room it is essential to move the source to different positions to average the room frequency
response. The figure also shows that the room responds poorly to the noise source at frequencies where the room is not resonant no matter where the source is placed; the power transferred from the source to the sound field is low. (See for example around 80 Hz in Figure 1.) The width and height of the spectral peaks in the frequency response graphs depend on the rate of loss of acoustical energy in the room, which is determined by the amount of sound absorbing material there. Adding sound absorbing material to the
room reduces the height of the peaks in the response function and broadens them. The sound absorbing material unfortunately also makes the sound field less reverberant and the application of reverberant sound field theory somewhat doubtful.
So, the impedance presented by a room to a source depends on the source position, the volume of the room and room absorptive losses among other factors. The change in response of the room with source position means that, ideally, reference sound sources should be placed close to or in the same place as the device being tested to ensure that both see the same impedance at low frequencies. Even then, however, differences in source characteristics can lead to differences in room response. When there are many modes in the frequency band of interest, the room impedance is more nearly constant and using the same position for the reference sound source and the device under test is
perhaps not so important.
Air distribution devices are used in normal rooms which, just like reverberation rooms, have a modal response. The environmental correction in ARI 885 attempts to estimate the reduction in the device sound power due to the interaction of typical sources with typical rooms.
The environmental corrections in ARI 885 were based on hemi-free field and reverberation room measurements made around 1960 to 1970. No data were available for ordinary rooms. The values to be subtracted from sound power level measured according to ARI 880 are shown in Table 1. Since that period, much has been learned about sound power measurements in hemi-free and reverberant fields and instrumentation has
improved greatly. During project RP755, the correction was re-examined.
Table 1: Environmental adjustment factors from ARI 885. Values, dB, to be subtracted from sound power values measured according to ARI 880.
Frequency, Hz 63 125 250 500 1k 2k 4k 8k
Factor, dB 7 3 2 1 1 1 1 1
MEASUREMENTS FROM RP755 PROJECT.
The major thrust of the ASHRAE RP755 project was the investigation of sound transmission from air terminal units installed above suspended ceilings into the room below. The information obtained was to be used to verify that the calculation procedures in ARI 885 were valid. Part of the work in the project was to measure the sound power emitted by the air terminals and other devices according to ARI 880 and ANSI S12.31. The test space was reverberant so two methods of obtaining the power were used. One, the direct method, combines the average sound pressure level generated by the device being tested with the reverberation times for the room to calculate the sound power. The second method, the substitution method, used a reference source as described above.
The room acoustics test (RAT) room, where the measurements were made, is a rectangular parallelepiped 4.71 m wide and 3.6 m high. One end wall can be moved to allow changes in length up to a maximum of about 11 m. For most of the experiments, the length was set at 9.2 m, giving a room volume of 156 m3.
The reference sound source used in the project was a vertically-oriented, centrifugal fan with a 305 mm diameter fan wheel designated RSS-A. The rotational
speed was chosen by the manufacturer so that troublesome tones associated with the blade passage frequency occurred below 25 Hz. Hemi-free field sound power levels were not provided with this reference sound source but sets of levels for a few nominally identical units were provided. Based on the observation that measured data for reference sources of the same type were nearly identical, it was assumed that power levels of the source used would be about the same as the calibrated units.
Four air terminals and two metal boxes containing loudspeakers were used above the ceiling in the project. Each time a device or an air terminal unit was installed in the RAT room, the device sound levels and the sound levels for RSS-A placed on the RAT room floor were measured in turn. This allowed sound power levels transmitted by the air terminal devices through the ceilings to be calculated using the substitution technique. At the same time, reverberation times in the room were measured using the first 25 dB of the decay curve so the power transmitted could also be calculated using the direct
technique.
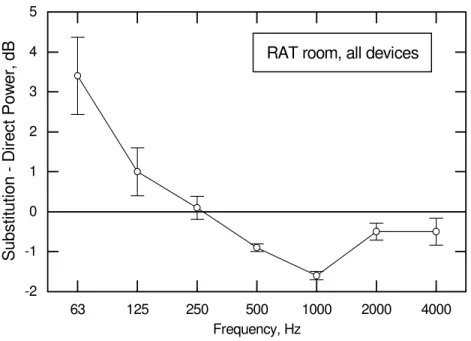
There were systematic differences between the results from the two methods of estimating power and these are plotted in Figure 3. At low frequencies the reduced sound power in the RAT room can be attributed to the environmental effect, that is the scarcity of modes there. The explanation for the difference around 1 kHz is inadequate spatial sampling in the hemi-free field measurements made for calibration of the reference sound sources using an early version of ISO 3745. The number of microphone positions
levels around 1kHz to be underestimated (Campanella, 1997). 63 125 250 500 1000 2000 4000 -2 -1 0 1 2 3 4 5
RAT room, all devices
S ub stitu tio n - D ire ct Po w er, d B Frequency, Hz
Figure 3: Average difference in sound power measured using substitution and direct techniques in the RAT room for all devices used in RP755. The error bars are ±one standard deviation.
VORLÄNDER MEASUREMENTS
Recent work (Vorländer and Raabe, 1995) has shown that the difference between free field and reverberant room sound power at low frequencies is strongly influenced by measurement procedures. In their work, sound power measurements on reference sound sources were made in seven reverberation rooms and in seven hemi-anechoic rooms. Many of the conclusions are directly relevant to the use of the environmental correction in ARI 885. Among them are:
• In hemi-free field measurements, systematic differences were found which were caused by the measurement methods. Arrays of fixed microphone positions on a hemispherical surface gave significantly lower sound power levels than did a microphone moved along a continuous spiral path on the same surface. Fixed
microphones gave values 1 and 2.5 dB lower at 1 kHz and 2 kHz than the spiral path.
• Hemi-free field measurements made at a radius of 1.5 m from the source gave systematically higher sound power levels below 100 Hz than measurements at 2 m from the source. The reason for this is the air flow produced by the source.
• Reverberation room power values using the direct method were influenced by the method used to calculate the reverberation time. Using the first 15 dB of the decay curve instead of the first 30 dB increased the measured power by up to 1 dB at 50 Hz.
A summary graph extracted from this work is shown in Figure 4. These data make it obvious that the environmental correction to be applied depends on the
measurement techniques that have been used to collect the data. While there still seems to be a difference between the power emitted in a hemi-anechoic and a reverberant space, estimates of this difference are biased by the measurement techniques used in each space.
63 125 250 500 -2 -1 0 1 2 1) r = 1.5 m, hemi-free field 2) r = 2.0 m, hemi-free field 3) 15 dB range, reverb. room 4) 30 dB range, reverb. room
Di ffer en ce r e gr an d m ean, dB Frequency, Hz
Figure 4: Graph of data from Vorländer and Raabe, 1995 showing the difference between hemi-anechoic and reverberation room determinations of sound power for different measurement conditions: 1) hemi-free field measurements using microphones along a 1.5 m radius from the source; 2) hemi-free field measurements using
microphones along a 2 m radius from the source; 3) reverberation room measurements using a 15 dB range to determine decay rate; and 4) reverberation room measurements using a 30 dB range to determine decay rate. The difference is relative to the grand mean of all sound power measurements in the project.
OTHER MEASUREMENTS.
From other work, two sets of measurements are available that can be used to estimate the environmental adjustment factor. The power of an ILG reference sound source was measured in an anechoic room with an added reflecting floor as well as by the
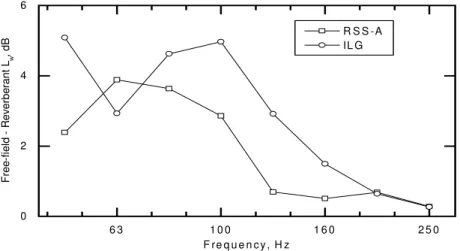
direct method in a 250 m3 reverberation room (Chu, 1997). During the RP755 project, the power of RSS-A was measured using the direct method in three reverberation rooms and averaged; one room had a volume of 250 m3 and two had volumes of 175 m3. The differences between the reverberant sound powers and the hemi-free field powers for these two devices are shown in Figure 5 in one-third octave bands. The same data are shown in octave bands and compared to the ARI 885 environmental adjustment factor in Figure 6. Also shown in Figure 6 are the differences between curves 1 and 4 and between curves 2 and 3 from Figure 4.
6 3 1 0 0 1 6 0 2 5 0 0 2 4 6 R S S -A IL G Fr ee -f ie ld R ev er be rant Lw , d B F re q u e n c y , H z
Figure 5: Difference between manufacturer’s hemi-free field power data and the average of the reverberant room data for reference sound source RSS-A and between anechoic and reverberant room power for the ILG reference sound source – one-third octave bands.
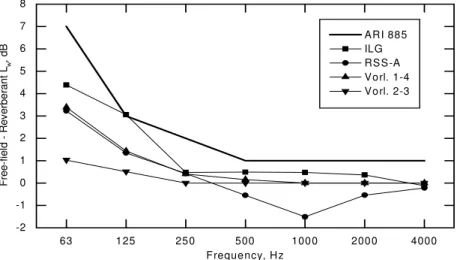
Examination of Figure 6 shows that the environmental correction used in the original version of ARI 885 is too large. Current research data show that there is no
reason to assume any difference between the two methods of measuring sound power at 250 Hz and above. At and below 125 Hz, there are still corrections to be made but the averages of the data presented in this paper are smaller than the values used in ARI 885.
63 125 250 500 1000 2000 4000 -2 -1 0 1 2 3 4 5 6 7 8 ARI 885 ILG RSS-A Vorl. 1-4 Vorl. 2-3 Free-fiel d - R ev erbe rant Lw , d B Frequency, Hz
Figure 6: Environmental correction for two reference sound sources, data from Vorländer and the ARI 885 values.
CONCLUSION
What is at issue here is the true difference between sound power emitted by a source in an ordinary room and that same source in a hemi-anechoic field. The data presented here relate primarily to reverberation rooms with volumes around 200 m3 (7000 ft3); there is no pertinent data for ordinary rooms. The data also show that previous estimates of the difference for reverberation rooms were influenced by the measurement procedures. The line Vorl. 2-3 in Figure 6 suggests that, given correct measurement
measurement are quite small.
The question of the appropriate correction for use in typical offices still remains unresolved, however. There are several differences between offices and reverberation rooms. Typical offices are not likely to have volumes as large as typical reverberation rooms (around 200 m3). As well, the ceiling height in most offices is around 2.5 m no matter how large the office. Smaller room volumes will mean poorer low frequency room response although this is offset by the fact that offices are never as reverberant as reverberation rooms. The more absorptive space should lead to better coupling of the source to the room at low frequencies. These differences mean that the acoustical response of an office will be quite different from that of a reverberation room; thus, choosing values for the environmental correction to be used in offices becomes a matter of judgment and guesswork. What was done for RP755 was to take the average of the measured values in Figure 6 and suggest those for use in ARI 885. The averages are shown in Table 2. It would require further work to determine a more precise set of correction factors, which would probably depend on room volume, room shape, absorptive properties and other parameters.
Table 2: Recommended environmental correction factors. Frequency, Hz 63 125 250 500 1k 2k 4k 8k
REFERENCES
ANSI S12.31 – Precision Methods for the determination of sound power levels of broad-band noise sources in reverberation rooms.
ARI Standard 880, “Air terminals”, Air-Conditioning & Refrigeration Institute, Arlington, Virginia, 1990.
ARI Standard 885, “Procedure for estimating occupied space sound levels in the
application of air terminals and air outlets”, Air-Conditioning & Refrigeration Institute, Arlington, Virginia, 1990.
Campanella, A.J., Private communication.
Chu, W.T., Private communication
ISO 6926:1990 “Acoustics – Determination of sound power levels of noise sources – Requirements for the performance and calibration of reference sound sources”.
Vorländer, M. and Raabe, G., “Calibration of Reference Sound Sources”, Acustica, 81, p247, 1995
Warnock, A.C.C., “Sound Transmission Through Ceilings from Air Terminal devices in the Plenum”, Final Report on ASHRAE Project RP755, January 1997.