HAL Id: hal-03098008
https://hal.archives-ouvertes.fr/hal-03098008
Submitted on 5 Jan 2021HAL is a multi-disciplinary open access archive for the deposit and dissemination of sci-entific research documents, whether they are pub-lished or not. The documents may come from teaching and research institutions in France or abroad, or from public or private research centers.
L’archive ouverte pluridisciplinaire HAL, est destinée au dépôt et à la diffusion de documents scientifiques de niveau recherche, publiés ou non, émanant des établissements d’enseignement et de recherche français ou étrangers, des laboratoires publics ou privés.
designs for the National Ecological Observatory Network
Yuri P. Springer, David Hoekman, Pieter T J Johnson, Paul A. Duffy,
Rebecca A. Hufft, David T. Barnett, Brian F. Allan, Brian R. Amman,
Christopher M. Barker, Roberto Barrera, et al.
To cite this version:
Yuri P. Springer, David Hoekman, Pieter T J Johnson, Paul A. Duffy, Rebecca A. Hufft, et al.. Tick-, mosquito-, and rodent-borne parasite sampling designs for the National Ecological Observatory Network. Ecosphere, Ecological Society of America, 2016, 7 (5), pp.e01271. �10.1002/ecs2.1271�. �hal-03098008�
Tick- , mosquito- , and rodent- borne parasite sampling designs for
the National Ecological Observatory Network
Yuri P. Springer,1,2,41,† David Hoekman,1,3 Pieter T. J. Johnson,4 Paul A. Duffy,5 Rebecca A. Hufft,6
David T. Barnett,1 Brian F. Allan,7 Brian R. Amman,8 Christopher M. Barker,9
Roberto Barrera,10 Charles B. Beard,2 Lorenza Beati,11 Mike Begon,12
Mark S. Blackmore,13 William E. Bradshaw,14 Dustin Brisson,15 Charles H. Calisher,16
James E. Childs,17 Maria A. Diuk-Wasser,18 Richard J. Douglass,19 Rebecca J. Eisen,2
Desmond H. Foley,20 Janet E. Foley,21 Holly D. Gaff,22 Scott L. Gardner,23
Howard S. Ginsberg,24 Gregory E. Glass,25 Sarah A. Hamer,26 Mary H. Hayden,27 Brian Hjelle,28
Christina M. Holzapfel,14 Steven A. Juliano,29 Laura D. Kramer,30,31
Amy J. Kuenzi,19 Shannon L. LaDeau,32 Todd P. Livdahl,33 James N. Mills,34 Chester G. Moore,35
Serge Morand,36 Roger S. Nasci,2 Nicholas H. Ogden,37 Richard S. Ostfeld,32
Robert R. Parmenter,38 Joseph Piesman,2 William K. Reisen,9 Harry M. Savage,2
Daniel E. Sonenshine,22 Andrea Swei39 and Michael J. Yabsley40
1National Ecological Observatory Network (NEON) Inc., 1685 38th St. Suite 100, Boulder, Colorado 80301 USA 2Division of Vector-Borne Diseases, U.S. Centers for Disease Control and Prevention,
3150 Rampart Rd., Fort Collins, Colorado 80521 USA
3Department of Biology, Southern Nazarene University, 6729 NW 29th Expy., Bethany, Oklahoma 73008 USA 4Department of Ecology and Evolutionary Biology, University of Colorado, Ramaley N122, Boulder, Colorado 80309 USA
5Neptune and Company Inc., 1435 Garrison St. Suite 100, Lakewood, Colorado 80215 USA 6Denver Botanic Gardens, 909 York St., Denver, Colorado 80206 USA
7Department of Entomology, University of Illinois Urbana-Champaign, Urbana, Illinois 61801 USA
8Division of High Consequence Pathogens and Pathology, Viral Special Pathogens Branch, U.S. Centers for Disease Control
and Prevention, National Center for Emerging and Zoonotic Infectious Diseases, Atlanta, Georgia 30333 USA
9Center for Vectorborne Diseases and Department of Pathology, Microbiology and Immunology,
School of Veterinary Medicine, University of California, Davis, California 95616 USA
10Division of Vector-Borne Diseases, U.S. Centers for Disease Control and Prevention,
1324 Calle Canada, San Juan, Porto Rico 00969 USA
11Institute of Arthropodology and Parasitology, Georgia Southern University, Georgia Ave.,
Bldg. 204, P.O. Box 8056, Statesboro, Georgia 30460 USA
12IIB, The University of Liverpool, Liverpool L69 7ZB UK
13Department of Biology, Valdosta State University, Valdosta, Georgia 31698 USA 14Institute of Ecology and Evolution, University of Oregon, Eugene, Oregon 97403 USA
15Evolution and Ecology of Disease Systems Laboratory, Department of Biology, University of Pennsylvania,
209 Leidy Laboratories, 433 S. University Ave., Philadelphia, Pennsylvania 19104 USA
16Arthropod-borne and Infectious Diseases Laboratory, Department of Microbiology, Immunology and Pathology,
College of Veterinary Medicine and Biomedical Sciences, Colorado State University, 3195 Rampart Rd., Foothills Campus, Fort Collins, Colorado 80523 USA
17Department of Epidemiology and Microbiology, Yale University School of Public Health, New Haven, Connecticut 06520 USA 18Department of Ecology, Evolution and Environmental Biology, Columbia University,
1200 Amsterdam Ave., New York, New York 10027 USA
19Department of Biological Sciences, Montana Tech, Butte, Montana 59701 USA
20Walter Reed Biosystematics Unit, Division of Entomology, Walter Reed Army Institute of Research,
503 Robert Grant Avenue, Silver Spring, Maryland 20910 USA
21Department of Medicine and Epidemiology, School of Veterinary Medicine,
University of California, Davis, California 95616 USA
22Department of Biological Sciences, Old Dominion University, Norfolk, Virginia 23529 USA 23State Museum, Harold W. Manter Lab of Parasitology, University of Nebraska, Lincoln, Nebraska 68588 USA
24U.S. Geological Survey Patuxent Wildlife Research Center, PSE, University of Rhode Island,
25Department of Molecular Microbiology and Immunology, The Johns Hopkins Bloomberg School of Public Health,
Baltimore, Maryland 21205 USA
26Department of Veterinary Integrative Biosciences, Texas A&M University, College Station, Texas 77843 USA 27National Center for Atmospheric Research, Boulder, Colorado 80307 USA
28Departments of Pathology, Biology and Molecular Genetics and Microbiology,
University of New Mexico HSC, Albuquerque, New Mexico 87131 USA
29School of Biological Sciences, Illinois State University, Normal, Illinois 61790-4120 USA
30Arbovirus Labs, Wadsworth Center, New York State Department of Health, Slingerlands, New York 12159 USA 31School of Public Health, State University of New York at Albany, Albany, New York 12201 USA
32Cary Institute of Ecosystem Studies, 2801 Sharon Turnpike, Millbrook, New York 12545 USA 33Department of Biology, Clark University, Worcester, Massachusetts 01610 USA
34Population Biology, Ecology and Evolution Program, Emory University,
1335 Springdale Road, Atlanta, Georgia 30306 USA
35Department of Microbiology, Immunology & Pathology, Colorado State University,
1690 Campus Delivery, Ft. Collins, Colorado 80523 USA
36CNRS – CIRAD AGIRs, Centre d’Infectiologie Christophe Mérieux du Laos, Vientiane, Laos 37Public Health Agency of Canada, 3200 Sicotte, Saint-Hyacinthe, Quebec J2S 7C6 Canada 38Valles Caldera National Preserve, P.O. Box 359, Jemez Springs, New Mexico 87025 USA 39Department of Biology, San Francisco State University, San Francisco, California 94132 USA
40Department of Population Health, College of Veterinary Medicine, Warnell School of Forestry and Natural Resources and
Southeastern Cooperative Wildlife Disease Study, University of Georgia, Athens, Georgia 30605 USA
Citation: Springer, Y. P., D. Hoekman, P. T. J. Johnson, P. A. Duffy, R. A. Hufft, D. T. Barnett, B. F. Allan, B. R. Amman,
C. M. Barker, R. Barrera, C. B. Beard, L. Beati, M. Begon, M. S. Blackmore, W. E. Bradshaw, D. Brisson, C. H. Calisher, J. E. Childs, M. A. Diuk-Wasser, R. J. Douglass, R. J. Eisen, D. H. Foley, J. E. Foley, H. D. Gaff, S. L. Gardner, H. S. Ginsberg, G. E. Glass, S. A. Hamer, M. H. Hayden, B. Hjelle, C. M. Holzapfel, S. A. Juliano, L. D. Kramer, A. J. Kuenzi, S. L. LaDeau, T. P. Livdahl, J. N. Mills, C. G. Moore, S. Morand, R. S. Nasci, N. H. Ogden, R. S. Ostfeld, R. R. Parmenter, J. Piesman, W. K. Reisen, H. M. Savage, D. E. Sonenshine, A. Swei, and M. J. Yabsley. 2016. Tick- , mosquito- , and rodent- borne parasite sampling designs for the National Ecological Observatory Network. Ecosphere 7(5):e01271. 10.1002/ ecs2.1271
Abstract. Parasites and pathogens are increasingly recognized as significant drivers of ecological and evolutionary change in natural ecosystems. Concurrently, transmission of infectious agents among hu-man, livestock, and wildlife populations represents a growing threat to veterinary and human health. In light of these trends and the scarcity of long- term time series data on infection rates among vectors and reservoirs, the National Ecological Observatory Network (NEON) will collect measurements and samples of a suite of tick- , mosquito- , and rodent- borne parasites through a continental- scale surveil-lance program. Here, we describe the sampling designs for these efforts, highlighting sampling priori-ties, field and analytical methods, and the data as well as archived samples to be made available to the research community. Insights generated by this sampling will advance current understanding of and ability to predict changes in infection and disease dynamics in novel, interdisciplinary, and collabora-tive ways.
Key words: infectious disease; mosquito; National Ecological Observatory Network; NEON design; parasite; pathogen;
reservoir; rodent; sampling design; Special Feature: NEON Design; tick; vector; zoonoses.
Received 4 April 2015; revised 17 August 2015; accepted 14 September 2015. Corresponding Editor: E.-L. Hinckley.
† E-mail: yurispringer@gmail.com
Copyright: © 2016 Springer et al. This is an open access article under the terms of the Creative Commons Attribution
License, which permits use, distribution and reproduction in any medium, provided the original work is properly cited.
I
ntroductIonParasites and pathogens (hereafter, parasites) can be important drivers of ecological and evo-lutionary changes in natural, agricultural, and urban ecosystems and have exerted significant effects on the demography and culture of hu-man populations throughout history (Dobson and Grenfell 1995, Dobson and Carper 1996, Harvell 1999, Swabe 1999, Hudson et al. 2002, Alexander 2010, Brown and Gilfoyle 2010, Brooks and Hoberg 2013). In recent decades, the number of reportedly emerging and re- emerging parasites—many of which are vector- and reservoir- borne zoonoses of public health concern—has increased dramatically (Garnett and Holmes 1996, Dobson and Foufopoulos 2001, Taylor et al. 2001, Anderson et al. 2004, Morens et al. 2004, Woolhouse and Gowtage- Sequeria 2005, Jones et al. 2008, but see Rosen-berg et al. 2013). This trend is believed to reflect both the growing epidemiological connectivity between natural systems and human- associated environments as well as anthropogenic envi-ronmental modification: changes in climate, land- and resource- use practices, and patterns of human trade and travel have enormous po-tential to alter patterns of infection and disease dynamics (Coakley et al. 1999, Patz et al. 2000a, Gubler et al. 2001, Harvell et al. 2002, Patz 2004, Weiss and McMichael 2004, Wolfe et al. 2005, 2007, Patz et al. 2008, Lafferty 2009, Mills et al. 2010b, Rohr et al. 2011, Altizer et al. 2013, Per-ry et al. 2013). In some cases, increases in vec-tor and reservoir abundance, rates of parasite transmission, and the severity of disease out-breaks—particularly those arising from cross- system infection events (e.g., zoonoses)—are predicted (Marano et al. 2007, Myers et al. 2013, Harrigan et al. 2014). In others, environmen-tal change may result in parasite losses, some of which will have important public health or economic consequences (Gomez and Nichols 2013). In both scenarios, changes in the abun-dance of vectors, reservoirs, or parasites, and in the epidemiology of associated diseases, may have important implications for the health of human and livestock populations and the conservation of wildlife (Gubler 1998, Binder et al. 1999, Daszak et al. 2000, Cleaveland et al. 2001, Daszak et al. 2001, Strange and Scott 2005,
Thompson et al. 2010). These changes could also have unanticipated effects on ecological communities at large, particularly when indi-viduals of constituent species play influential roles in community- level interactions or ecosys-tem function (Mitchell and Power 2003, Hud-son et al. 2006, Hatcher et al. 2014).
In light of these patterns and predictions, there is a clear and growing need for increased parasite surveillance efforts that bridge the historical divi-sions among studies of human, domesticated an-imal, and wildlife diseases. For instance, the field of conservation medicine and the OneHealth initiative are both predicated on a synthetic ap-proach that emphasizes the linkages between environmental change and the health of human and wildlife populations (Daszak et al. 2004, Ka-plan et al. 2009, Rock et al. 2009, Atlas et al. 2010, Coker et al. 2011, Aguirre et al. 2012). The impor-tance of understanding these linkages was high-lighted as a critical priority in both the National Research Council’s Grand Challenges (National Research Council 2001, 2003) and the Millenni-um Ecosystem Assessment (Patz 2005). Given the broad spatiotemporal extents over which many important changes in infection and disease dy-namics are likely to occur, and the myriad factors that could underlie those changes, the value of large- scale, multifaceted surveillance efforts is increasingly recognized (Altizer et al. 2013). As the size and scope of surveillance efforts expand, appropriate sampling design and methodologi-cal standardization will greatly facilitate com-parisons across data sets and scales. Although logistically challenging, such large- scale, stan-dardized sampling efforts are critical to charac-terize regional, continental, and multidecadal patterns of disease dynamics. Insights gleaned from such projects hold promise for informing efforts to promote human health and wildlife conservation while furthering our fundamen-tal understanding of the ecology and evolution of host–parasite interactions in natural systems (Kovats et al. 2001, Crowl et al. 2008).
In 2012, the U.S. National Science Foundation (NSF) began funding the construction of the Na-tional Ecological Observatory Network (NEON) with the goal of creating the first continental- scale ecological monitoring system (Keller et al. 2008). Using standardized methods implemented at as many as 60 sites for up to 30 yr, NEON will
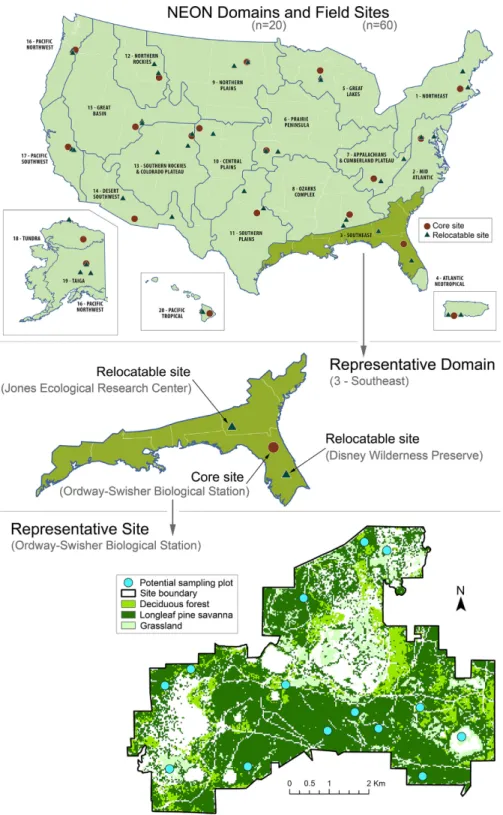
Fig. 1. Overview of the hierarchical spatial structure of the National Ecological Observatory Network. Panels show (from top to bottom) the boundaries of the 20 ecoclimatic domains and locations of associated sites, the distribution of one core site and two relocatable sites in a representative domain, and multiple sampling plots distributed among vegetation types at a representative site.
provide insights into the effects of global change drivers (e.g., climate and land- use change) on the physical and ecological environment across mul-tiple spatial and temporal scales (Schimel 2011). Observatory sites will be distributed throughout the continental United States, Alaska, Hawaii, and Puerto Rico. Statistical methods were used to par-tition this area into 20 ecoclimatic regions termed domains (Hargrove and Hoffman 2004, Fig. 1) that collectively span the range of climate and vegetation communities found within the United States. Multiple Observatory sites are planned in each domain: one core site (location fixed for 30- yr lifespan of the Observatory) and between one and three (typically two) relocatable sites (loca-tion potentially dynamic within the domain, with intended relocation occurring every 6–10 yr). Core sites are located in wildland areas and will provide baseline measurements of the changing biotic and abiotic characteristics of associated do-mains. In many cases, relocatable site locations have been (and will be) selected to represent points along ecological, climatic, or land- use gra-dients of interest (e.g., urban/rural/undeveloped, active silva- or agriculture/discontinued harvest/ uncultivated, highly invaded/minimally
invad-ed/pristine). Other considerations for selecting site locations include anticipated extent and du-ration of access and previous or ongoing research efforts and infrastructure. The sizes of currently selected sites vary according to administrative boundaries and logistical constraints; core sites range from 11 to 214 km2 while relocatable sites
are typically smaller and more variable in size, ranging from small agricultural sites (~5 km2) to
larger wildland locations (up to 50 km2).
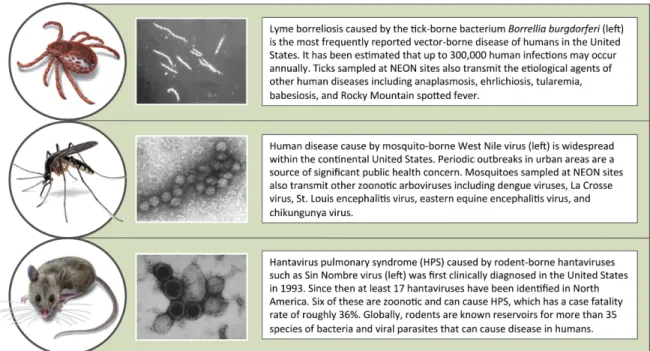
As part of NEON’s terrestrial observation sys-tem (Kao 2012), sampling of parasites and asso-ciated vector (organisms that transmit parasites between hosts) and reservoir (organisms in which parasites can live, multiply, and disperse from) species will be conducted to elucidate the changing ecology of a suite of tick- , mosquito- , and rodent- borne parasites. Among these are the etiological agents of important human ill-nesses including Lyme borreliosis, West Nile virus disease, and Hantavirus pulmonary syn-drome (HPS) (Fig. 2). Others cause diseases in wildlife species that can have important effects on the ecology of natural systems and may rep-resent threats to veterinary health. Unlike most surveillance programs, sampling of vectors,
res-Fig. 2. Overview of targets of National Ecological Observatory Network vector, reservoir, and parasite sampling. Parasite images were obtained from the U.S. Centers for Disease Control and Prevention Public Health Image Library.
ervoirs, and parasites within NEON will not be focused in space and time on acute human health events (e.g., localized in populated areas during short- lived outbreaks of human disease). Instead, sampling will occur continuously over multiple decades and at numerous and ecologically varied sites. Associated data sets will provide unique baselines of and insights into host–parasite and disease dynamics. Additionally, NEON mea-sures of vector/reservoir abundance and parasite prevalence will be made simultaneously with a suite of environmental and organismal sampling. This will include measurements of numerous at-tributes of the physical environment, remotely sensed data on vegetation and biogeochemistry, and phenological, demographic, and biodiversi-ty sampling of sentinel taxa that include soil mi-crobes, plants, insects, birds, and small mammals (Kao 2012). To promote the advancement of open- access science, NEON data and archived samples will be freely available for additional analyses by other members of the research community. Given its broad spatiotemporal scope, varied eco- environmental targets, emphasis on method-ological standardization, and open- access poli-cies, NEON will advance our understanding of and ability to predict changes in host–parasite interactions and associated disease dynamics in novel, interdisciplinary, and collaborative ways.
Here, we detail the sampling designs for NEON’s tick- , mosquito- , and rodent- borne par-asite sampling modules. The sampling designs formalize specific approaches to achieve the gen-eral research and monitoring objectives codified in NEON’s high- level science requirements. These requirements were generated through discus-sions among experts in the ecological community at workshops convened by NSF during the con-ception phase of the Observatory (e.g., American Institute of Biological Sciences 2004) and subse-quently formalized by NSF and NEON, Inc., the independent 501(c)(3) (not- for- profit) corporation that was managing the NEON project at the time these sampling designs were created (Schimel 2011). We begin with a brief discussion of the gen-eral considerations and priorities common across modules and then provide specific information on the formulation and details of the sampling design for each individual module. We based designs on established methods and approaches, particularly those that have been used by other surveillance
programs, and sought to maximize the breadth (number of measurement and sample types) and temporal frequency of sampling within the bounds of currently anticipated logistical and fi-nancial constraints. For each sampling module we report results of power analyses to quantitatively evaluate the ability of the design to detect para-sites and interannual changes in infection preva-lence in vectors and reservoirs. Because sampling protocols flow from these designs, an understand-ing of the priorities and strategic decisions under-lying the latter is integral to contextualizing when, where, and how measurements and samples will be collected. This understanding should facilitate the use of NEON- generated resources and the replication or modification of NEON methods by others attempting to integrate their work with or extend that being conducted within NEON. All associated protocols for NEON field sampling, laboratory analyses, and sample archiving are or will be available online from NEON, Inc. (http:// www.neoninc.org/) or the organization managing the NEON project (the identifiers NEON, NEON, Inc., and “the Observatory” are used interchange-ably herein). Finally, note that these designs reflect the general priorities, background information, methodological options, and logistic and budget-ary constraints associated with NEON sampling and known to the authors when this article was written. It is important to acknowledge that the designs will likely evolve over the lifespan of the Observatory as a result of changes in one or more of these or other factors that facilitate, limit, or otherwise guide- associated sampling plans.
G
enerald
esIGnc
onsIderatIonsand
P
rIorItIesTargets
Sampling within the NEON will broadly target tick, mosquito, and small mammal (specifically, rodent) populations and associated parasites (Appendix S1). These vector/reservoir taxa were selected as sampling targets for two reasons. First, because of their physiology, ecology, and human associations, individuals and popula-tions of these taxa have the potential to respond quickly and measurably to changes in climate and land- use practices. Second, these taxa play important roles in the amplification and trans-mission of a diverse suite of parasites, some
of which are of public health significance. In contrast to a focus on particular parasites, this approach aims to increase the breadth of sam-pling and enhance its long- term flexibility to accommodate previously uncharacterized and/ or emerging parasites. Generally speaking, sam-pling will involve the collection of individuals of target vector/reservoir taxa to quantify their abundance, analysis of associated samples (tis-sues or whole organisms) to estimate the prev-alence of infection by target parasites, and archiving of some or all remaining samples for additional use by other members of the research community.
Ticks and tick- borne parasites.—Ticks transmit a
variety of parasites, many of which are zoonotic and have considerable public health significance (Spach et al. 1993, Sonenshine 1994, Sonenshine and Roe 2014). In northern latitudes, tick- borne parasites are responsible for the majority of cases of vector- borne diseases in humans (Randolph 2001), and Lyme borreliosis is the most frequently reported vector- borne disease in the United States (U.S. Centers for Disease Control and Prevention 2008). First recorded in the United States in 1975 (Steere et al. 1977), the reported number of human cases of Lyme borreliosis within the United States more than doubled between 1995 and 2013 (http://www.cdc.gov/ lyme/stats/index.html, accessed on September 15, 2015). According to a recent analysis, up to 300 000 human infections may occur annually (Kuehn 2013). Other zoonotic tick- borne parasites in North America (e.g., Anaplasma spp., Ehrlichia spp., Babesia spp.) have exhibited similar patterns of emergence in terms of increases in prevalence and spatial extent over the past two decades (Childs and Paddock 2003, Doudier et al. 2010, Centers for Disease Control and Prevention 2012a). Tick- borne parasites are associated with 8% of the infectious conditions in humans currently classified by the U.S. Centers for Disease Control and Prevention (CDC) as nationally notifiable (http://wwwn.cdc.gov/ nndss/conditions/notifiable/2015/, accessed on September 15, 2015).
In addition to the public health significance of diseases associated with tick- borne parasites, the physiology and ecology of ticks make them an ideal target for sampling within NEON. Among arthropods, ticks are particularly sensitive to
abi-otic environmental conditions (Sauer and Hair 1986, Needham and Teel 1991, Stafford 1994, Dis-ter et al. 1997, Jones and Kitron 2000, Teel et al. 2010, Sonenshine and Roe 2014), suggesting that the demography and biogeography of ticks of many species—and the parasites they transmit— will be affected by climate change (Estrada- Pena 2009, Gatewood et al. 2009, Diuk- Wasser 2012, Leger et al. 2013, Medlock 2013, Ogden et al. 2013). Further, the multihost life cycles of ticks of many species increase their ecological connec-tivity and sensiconnec-tivity to community- level pertur-bations associated with changes in human land- and resource- use patterns. These anthropogenic effects can manifest as direct alterations to the physical environment (Barbour and Fish 1993) or changes in community structure that affect the abundance or diversity of available hosts (Childs and Paddock 2003, LoGiudice et al. 2003, Paddock and Yabsley 2007, Allan et al. 2010a, Keesing 2010).
Mosquitoes and mosquito- borne
parasites.—World-wide, mosquito- borne parasites are currently responsible for a human health burden unsurpassed among vector- borne diseases. In 2004 alone over 1.8 million human deaths were attributed to malaria (Murray et al. 2012), and 96 million people are estimated to experience disease associated with infection by dengue viruses each year (Bhatt 2013). Moreover, mosquito- borne parasites can also cause substantial reductions in populations of livestock and wildlife, with potentially important repercussions for human health, economic productivity, and the structure and function of ecological communities (e.g., Daubney et al. 1931, van Riper et al. 1986, Morris 1989, Scott and Weaver 1989, LaDeau et al. 2007, Paweska and van Vuren 2014).
Forecasts of potential ecological and public health consequences of climate change often fo-cus on mosquitoes and the parasites they trans-mit (Shope 1992, Reeves et al. 1994, Sutherst 2004, Harrigan et al. 2014). Although mosquitoes occur worldwide, they are most consistently abundant in localities with tropical or moderately temper-ate climes where relatively warm and wet con-ditions prevail (although populations of some species in subarctic and alpine regions reach extremely high abundance during parts of the year). As a result, increases in temperature or precipitation at higher latitudes or elevations due
to climate change could promote range expan-sions of mosquitoes currently confined to trop-ical areas ( Epstein et al. 1998, Patz et al. 2000b, Caminade et al. 2012, Eisen and Moore 2013, but see Reiter 2001). This geographic spread could be facilitated by the periodic long- distance transport of mosquitoes that can occur inciden-tally as part of human travel and international commerce (Lounibos 2002, Tatem et al. 2006). Establishment and spread of mosquito species into new localities creates the potential for as-sociated parasites to be concurrently introduced (e.g., Gould and Higgs 2009, Weaver and Reisen 2010). Additionally, there is evidence that chang-ing climatic conditions will significantly affect mosquito demography and processes associated with the transmission of mosquito- borne para-sites (Mordecai 2013). For example, changes in ambient temperature are predicted to alter mos-quito vectorial capacity (Watts et al. 1987, Reisen et al. 2006, Paaijmans et al. 2012) and biting rates (Lardeux et al. 2008), and could potentially cata-lyze arboviral host range shifts (Brault and Rei-sen 2013). Because of their extensive geographic distribution, ecological and epidemiological sig-nificance, and sensitivity to processes associated with climate and land- use change, mosquitoes and the parasites they transmit are natural tar-gets for sampling within NEON.
Rodents and rodent- borne parasites.—Small
mammals, and rodents in particular, are common and influential members of most terrestrial ecological communities and play central roles in the amplification and transmission of numerous parasites. Rodentia is the most diverse order of the class Mammalia, including roughly 40% of extant species (Huchon et al. 2002). Rodents of some species are opportunistic foragers that have lived in close symbioses with humans for thousands of years (e.g., Matisoo- Smith et al. 1998). Others inhabit the urban/wildland interface and may serve as epidemiological links between humans and infectious agents endemic to natural ecosystems (Kuenzi et al. 2001, Douglass et al. 2006). As a result of these intimate associations, and because of their shared mammalian pedigree, a variety of parasites can be transmitted from rodents to humans (Meerburg et al. 2009). One of the most notable examples is Yersinia pestis, the etiological agent of plague. The bacterium is usually transmitted to
humans via the bite of a flea that has fed on an infected rodent (Gage and Kosoy 2005). Over the course of recorded history plague has been responsible for multiple human pandemics and tens of millions of fatalities (Gage et al. 2008). More recently, human infection by rodent- borne hantaviruses (Mills et al. 2010a) has received considerable attention following outbreaks of HPS caused by Sin Nombre virus (Nichol et al. 1993, Centers for Disease Control and Prevention 2012b). Of the 17 hantaviruses identified in North America, six are known to cause HPS, which has a case fatality rate of roughly 36% (Mills et al. 2010a, MacNeil et al. 2011). In addition to these highly publicized examples, rodents are known reservoirs for the etiological agents of over 35 human diseases worldwide (http://www.cdc. gov/rodents/index.html, accessed on September 15, 2015) including Lyme borreliosis, typhus, babesiosis, and Rocky Mountain spotted fever (Meerburg et al. 2009).
Rodents and the parasites they carry may also be model systems for investigating the effects of climate and land use changes on the transmission of zoonotic parasites and epidemiology of associ-ated diseases. The often large sizes and high den-sities of rodent populations may favor the main-tenance and spread of parasites, and frequent contact between some rodent species and both do-mestic animals and human populations increases the likelihood of parasite spillover or zoonotic transmission. Additionally, populations of many species of rodents that serve as reservoirs have high reproductive potential and turnover, attri-butes that promote rapid demographic responses to environmental changes with cascading effects on infection dynamics and the risk of human dis-ease (Yates et al. 2002, Luis et al. 2010). Modifica-tions of ecosystems by human activities, including urbanization and agricultural development, may also affect the structure of rodent communities in ways that alter the relative abundance of reservoir- competent species (Mills 2006, Clay et al. 2009). Methods
Our sampling designs prioritize field methods that meet three criteria. First, the method(s) must provide an effective means of collecting indi-viduals of targeted vector/reservoir taxa. Second, utilization of well- established, widely employed methods will promote use of NEON data by
other members of the research community and the integration of these and similar data collected by other groups including private and academic researchers, local and State- level organizations, and Federal agencies such as the CDC or U.S. Department of Agriculture (USDA). As an ex-ample, the CDC miniature CO2 light trap has been used for decades in locations around the world to collect mosquitoes of a variety of spe-cies that play important roles in arbovirus trans-mission (Sudia and Chamberlain 1962, Newhouse et al. 1966, Pfuntner 1979). Analogous methods for the collection of ticks and small mammals include drag sampling (Milne 1943) and mark- recapture live trapping, respectively. Third, be-cause standardization within the Observatory is emphasized to facilitate comparability of data across sites, methods must be widely applicable across the spectrum of site- specific logistic con-straints, environmental conditions, and ecology of sampled populations at NEON sites.
The NEON will contract with experts at external facilities to perform the majority of sample pro-cessing, including most taxonomic identification of vector/reservoir samples and all parasite- related testing. To increase cost efficiency, our sampling designs prioritize testing methods that can simul-taneously detect more than one parasite species over the use of multiple, parasite- specific tests (e.g., a single, general assay for mosquito- borne arboviruses or flaviviruses rather than a panel of individual tests specific to West Nile virus, St. Louis encephalitis virus, and dengue viruses).
Broadly reactive screens will be followed up with more specific assays to identify the parasite(s) pres-ent in samples that test positive. NEON will apply quality assurance and control processes to both field and laboratory sampling methods whenever possible (plans still in development), and report associated error metrics with raw and processed data. Samples that test positive for parasites classi-fied as select agents (see http://www.selectagents. gov/) will be handled in accordance with State and/or Federal regulations as appropriate.
Emphases
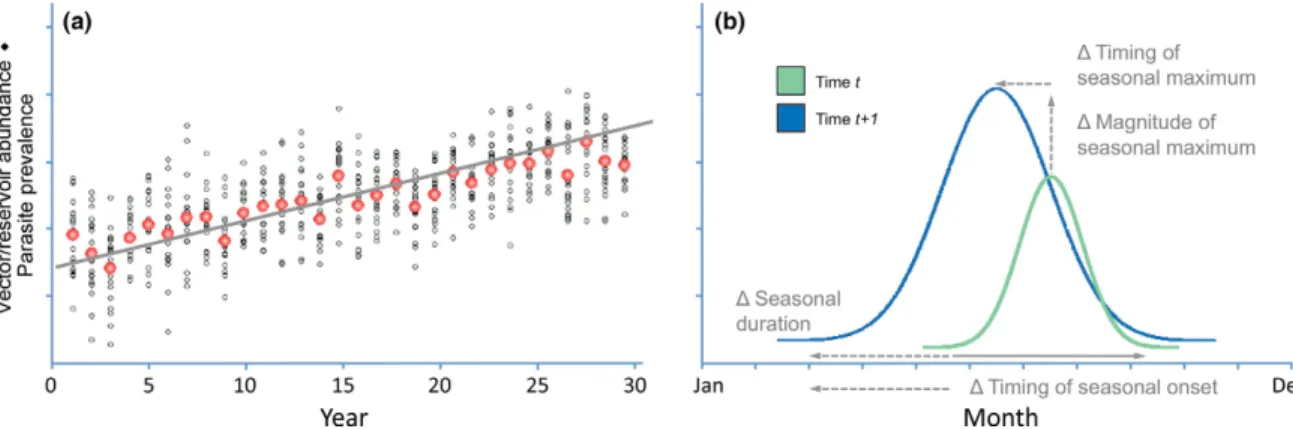
Our sampling designs prioritize a high fre-quency of intra- annual sampling to generate fine- scale time series data. When implemented over the relatively long lifespan of the Observatory (up to 30 yr at core sites), this approach will allow changes in sampled vector, reservoir, and parasite populations to be char-acterized at two temporal scales. Of primary interest are interannual changes in the seasonal mean or maximum of vector/reservoir abun-dance and parasite prevalence (Fig. 3a). Given a sufficiently high sampling frequency, sam-pling could secondarily elucidate changes in aspects of intra- annual phenology of sampled populations (e.g., timing of onset and duration of seasonal cycles, Fig. 3b). The secondary focus is particularly important because the seasonal phenology of many vector, reservoir, and par-asite populations is expected to be sensitive to changes in climate and land- use practices
Fig. 3. Hypothetical data illustrating interannual (a) and intraannual (b) changes in vector/reservoir abundance and parasite prevalence. In general, sampling according to the designs proposed herein is intended to quantify changes in sampled vector, reservoir, and parasite populations at these two temporal scales.
(Altizer et al. 2013). Resulting phenological shifts could have important consequences for the maintenance, abundance, and spread of parasites (Altizer et al. 2006, Fisman 2007).
To maximize the frequency, consistency, and temporal extent of time series data, our sampling designs include two general prescriptions for in-stances in which financial or logistical constraints necessitate reductions in field sampling effort (i.e., frequency of sampling events). First, if reductions in field sampling effort are required, NEON will maintain the specified level of sampling effort at core sites while scaling- back effort at relocatable sites. This will ensure the temporal consistency and continuity of sampling at sites with longer lifespans. Second, when faced with general bud-getary constraints, NEON will attempt to maintain levels of field sampling efforts specified in the de-signs and realize cost savings through reductions in the number of collected samples that are tested for parasites. Foregoing the testing of all samples collected during selected sampling events, rather than reducing the number of samples tested for every event, will facilitate data comparability by maintaining consistent levels of analytical sam-pling effort and associated uncertainty through time. Untested samples can be archived for pro-cessing at a later date, either by NEON or other members of the research community.
Our emphasis on fine- scale time series data is driven largely by fundamental constraints on the spatial resolution of NEON sampling. Because the selection of NEON sites was and will be made with little if any consideration of local vector/ reservoir abundance or parasite prevalence, not all sites will be productive in terms of sampling yields. Within sites, the number of sampling plots will generally be too low to characterize or mea-sure changes in local habitat associations of tar-get taxa. In light of these limitations, our designs seek to characterize changes in vector/reservoir abundance and parasite prevalence at the level of the site rather than the individual sampling plot. While NEON will make plot- level field data available, our designs are predicated on the com-bination of data and samples across plots within sampling events to make site- level inferences. Determining and evaluating sampling effort
Given NEON’s open- access policy, our sam-pling designs attempt to maximize the number
of hypotheses, comparisons, and analyses that can be evaluated using NEON data and samples. The diversity of possibilities complicates decisions related to the spatiotemporal distribution of sampling effort. In general, the proposed allo-cation of effort (e.g., frequency of sampling events, number of plots per site) reflects a balance be-tween anticipated resource availability and lo-gistical constraints and levels of sampling effort commonly reported or deemed reasonable for surveys of tick, mosquito, and rodent populations and associated parasites. Evaluating the adequacy of these plans through traditional power analyses is not wholly appropriate given that this ap-proach is typically used to assess the design of studies motivated by one or a few specific re-search questions. Nevertheless, in each module- specific section we present results of power analyses evaluating the ability of sampling de-signs to detect interannual trends in the seasonal mean prevalence of a parasite at a NEON site. These results provide quantitative insight into just one of the many possible analytical appli-cations of NEON data and are not intended as an evaluation of the project as a whole.
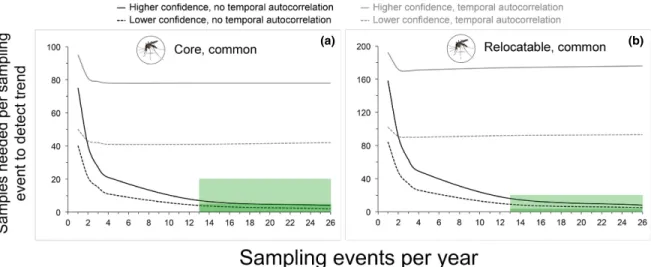
Because NEON will conduct tick- and rodent- borne parasite testing through analysis of individual samples (i.e., not pooled), we per-formed power analyses for trend detection using the negative binomial distribution. Due to the expectation of relatively low rates of infection, mosquito- borne parasite testing will involve pooled samples (20–50 individual mosquitoes physically homogenized and the resulting ho-mogenate tested for parasites). Because of this approach, we performed power analyses for trend detection using the binomial distribution and the complementary log–log (CLL) link function, which accommodates for group testing within a GLM framework (Farrington 1992). We speci-fied trend magnitudes in terms of an interannual increase in parasite prevalence (values varied by module) and set trend detection periods at ei-ther 10 or 25 yr (approximations of the lifespans of NEON relocatable and core sites, respective-ly). Year- zero prevalence was parameterized us-ing values typically reported in the literature or commonly associated with the types of parasites under consideration. We evaluated two combi-nations of type I error rate (α) and power (1 − β = 1 − p(type II error)): a higher confidence scenario
involving α = 0.05 and power = 0.9 and a lower confidence scenario in which α = 0.1 and pow-er = 0.8. We ppow-erformed analyses both with and without a temporal autocorrelation term. A cor-relation of approximately 0.37 (ρ = 1/e) at 6 months was chosen to represent a moderate magnitude of temporal correlation to provide contrast with respect to the case with temporal independence. We considered year- round sampling at frequen-cies proposed for core and relocatable sites in the design for each sampling module as well as for lower frequencies (e.g., one, two, three, and four times per year) in order to generate continuous power curves in accompanying figures. In these figures, we used green boxes to represent regions of sampling space where designs had sufficient power to detect trends of a specified magnitude. Unless otherwise specified in the figure caption, these boxes are bounded along the x- axis by sam-pling frequencies proposed for core and relocat-able sites and on the y- axis by anticipated levels of replication (i.e., number of field- collected samples or laboratory tests) associated with a single sam-pling event. Scripts used to perform these power calculations in R (R Core Team 2013) are provided in Appendix S2.
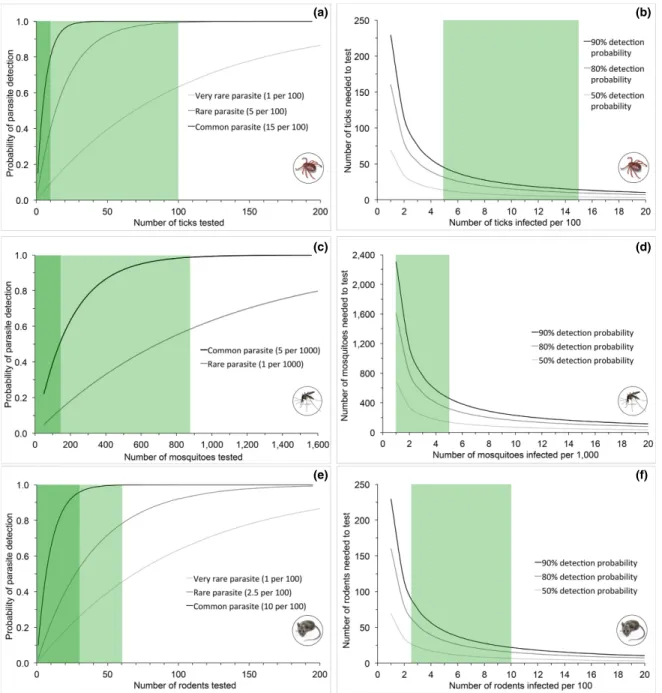
In addition to these power analyses, we used two approaches involving methods detailed in Gu and Novak (2004) to quantify the ability of the sampling designs to simply detect a parasite when it is present at a site. First, we characterized the relationship between the number of samples tested and the probability of detecting a parasite at various levels of parasite infection prevalence. Second, we quantified the relationship between infection prevalence and number of samples that would need to be tested to detect a parasite with varying levels of statistical confidence.
Plot selection
Our sampling designs are predicated on a fixed plot approach to field sampling. In many cases, individuals of target taxa are likely to exhibit relatively clustered patterns of distribu-tion in space. This aggregadistribu-tion can arise from factors such as abiotic tolerances, habitat pref-erences, and/or host- mediated dispersal. The productivity of sampling would be increased by locating at least a portion of sampling plots in areas of aggregation (e.g., adaptive cluster sampling, Thompson 1990, Brown et al. 2013),
but identifying these within- site locations in a systematic way that can be applied across the Observatory is complicated by at least three issues. First, site- specific data on these produc-tive locations are generally unavailable for most sites prior to the start of NEON sampling. Second, inferring patterns of local spatial dis-tribution using regional data or expertise is problematic since the quality and availability of these resources vary considerably among sites and regions. Finally, because populations of target species often exhibit considerable in-terannual fluctuations in size, multiple years of within- site sampling would be required to empirically characterize patterns of site- specific distribution and/or local habitat associations with confidence.
Given these complications, our designs involve the establishment of sampling plots at random locations within sites. This approach has a num-ber of general strengths. First, because the goal of the sampling is to make site- level inferences about vector, reservoir, and parasite populations, the random distribution of sampling plots within sites allows for spatially unbiased site- level es-timates of parameters of interest. Second, given that local patterns of distribution of individuals of target species may change over the lifespan of the Observatory, plot locations based on current patterns of distribution might not be optimal in future years. A strategy of randomized plot dis-tribution would be more robust to these changes. Finally, using the same approach to selecting plot locations as other NEON terrestrial sampling modules will facilitate statistical analyses and modeling involving these data.
For each sampling module, our designs specify a standard number of sampling plots per site. As described in the NEON spatial sampling design (Barnett et al., unpublished manuscript), NEON will use a stratified random approach to select plot locations within the dominant vegetation types (≥5% total cover) at each site. The num-ber of plots per vegetation type will be roughly proportional to the percent cover of each type. NEON will use data collected at these plots during the first few years of sampling to statis-tically evaluate whether the specified number of plots is sufficient to characterize parameters of interest with desired confidence at each site. If analyses of these results indicate that more data
and/or samples are required to achieve this confi-dence, NEON will add additional sampling plots as needed.
Sample archiving
The NEON will archive a subset of field- collected and laboratory- generated samples and make them available for use by other members of the research community. These archival col-lections will include one or more of the following: untested samples (e.g., whole ticks), samples re-maining after parasite testing has been conducted (e.g., residual volumes of rodent blood samples or frozen tissues), and products generated by this testing (e.g., DNA/RNA extractions or (RT- )PCR products). NEON is currently developing sample archive plans and will adopt associated methods that maximize the lifespan of these samples. Frozen samples will be aliquoted prior to storage to minimize the number of freeze/thaw cycles associated with their use. Additionally, voucher specimens will be archived to allow verification of taxonomic identifications.
t
Ickandt
Ick- B
orneP
arasItes
amPlInG TargetsSampling for ticks and tick- borne parasites (hereafter, tick sampling) will broadly target hard ticks (family Ixodidae). Six species are of partic-ular interest for tick- borne parasite testing: Ixodes
scapularis (black- legged tick), Ixodes pacificus
(west-ern black- legged tick), Amblyomma americanum (lone star tick), Amblyomma maculatum (Gulf Coast tick), Dermacentor andersoni (Rocky Mountain wood tick), and Dermacentor variabilis (American dog tick). Collectively, ticks of these species transmit a large and taxonomically diverse suite of parasites, many of which are zoonotic and of public health concern (http://www.cdc.gov/ ticks/diseases/, accessed on September 15, 2015, Spach et al. 1993). Ticks of other species collected through this sampling will be tested for parasites as resources permit and sample sizes warrant. Parasite testing will broadly target bacteria. Sampling methods
The NEON will sample ticks using the drag-ging method, which is arguably the most com-monly used method to sample ticks and is particularly effective for ticks of species that
exhibit questing behavior (i.e., sit- and- wait) (Milne 1943, Falco and Fish 1992). Dragging also most closely approximates the human risk of picking up hard ticks from the environment. During drag sampling, a cloth of standardized size is pulled along the ground at a slow pace. The cloth is periodically examined for attached ticks, which are typically removed with forceps or tape. Ticks that become attached to the clothing of sampling personnel during drag sampling can also be collected when the drag cloth is examined. We recommend that steps be taken to standardize clothing worn by sam-pling personnel. The distance covered during a drag is generally standardized or recorded for use in calculating tick density. In instances where thick vegetation prevents continuous drag sampling, the flagging method can be used as an alternative or in conjunction with dragging (Ginsberg and Ewing 1989a). Flag sampling essentially involves using the drag cloth held in the hand and slowly waved over or underneath vegetation rather than pulled along the ground (Rulison et al. 2013).
While NEON does not currently plan to use them, two additional methods of tick sampling will be considered to supplement drag sampling as resources permit. Collection of ticks using dry ice- baited CO2 traps is well suited for sampling ticks of species such as A. americanum that exhibit active hunting behavior and locate hosts by fol-lowing carbon dioxide plumes (Garcia 1962, Fal-co and Fish 1989, Kinzer et al. 1990). Ticks attract-ed to a CO2 trap are captured on tape attached to the edge of the trap’s base platform. A drag/ flag cloth can be used to collected additional ticks from the ground and vegetation in the vicinity of the trap. If used, CO2 traps will consist of a vented 1.9- L insulated cooler containing approx-imately 1.5 kg of dry ice and be deployed in the center of each sampling plot for 24 h following the completion of drag and/or flag sampling.
The removal of ticks from vertebrate hosts is an-other commonly used method of sampling ticks (Luckhart et al. 1992, Clark et al. 1998, Kollars et al. 2000). Results of sampling using this method can provide important insights into the host associa-tions of ticks and by extension, the transmission cycles of associated parasites (Clark et al. 2001, Eisen et al. 2004). Deer are final hosts for ticks of many species, and researchers often remove ticks
from deer killed by sportsmen (i.e., at hunter check stations) or from road kill (Luckhart et al. 1992, Kollars et al. 2000). This is not a methodological option for NEON as large mammals are not be-ing sampled within the Observatory. In contrast, NEON will conduct regular sampling of small mammals (rodents), including species that are im-portant hosts for ticks and play significant roles as reservoirs of many tick- borne parasites (Donahue et al. 1987, Ostfeld et al. 1996). Because of a need to limit small mammal handling time in the face of other prioritized data and sample collection requirements, NEON is not currently planning to remove ticks from captured small mammals. Instead, NEON will quantify the tick burdens of captured small mammals using visual counts of attached ticks. This latter approach has been shown to generate reliable estimates of absolute tick burdens for some cricetid and sciurid rodents (Brunner and Ostfeld 2008). If these handling con-straints are relaxed, we recommend that NEON collect ticks from captured small mammals. Field sampling plan
An event of tick sampling at a site will involve drag sampling around the perimeter of each of six 1600 m2 square sampling plots per site. As
described in the general introduction and the NEON spatial sampling design (Barnett et al. in prep), a stratified random approach will be used to select plot locations within the dominant vegetation types (≥5% total cover) at each site. The number of plots per type will be propor-tional to the percent cover of each type. During a sampling event, a 1- m2 piece of white, cotton
flannel cloth will be pulled along the ground at a pace not to exceed ~0.3 m/s (i.e., approx-imately 50 s to sample 15 m) and examined at 5–10 m intervals along the drag path. Ticks found attached to the drag cloth and clothing of sampling personnel will be removed using forceps (nymphs and adult ticks) or reusable lint rollers (larval ticks, Savage et al. 2013). The distance of each drag will be recorded for cal-culations of tick density. Flagging will be used along any portions of the sampling path where vegetation prevents continuous drag sampling.
Sampling at each site will begin at a frequency of one sampling event every 6 weeks. This fre-quency will be maintained until one or more ticks are collected during a sampling event, a threshold
that will trigger an increase in sampling frequen-cy to one event every 3 weeks. This frequenfrequen-cy will be maintained for the remaining lifespan of the site irrespective of subsequent sampling suc-cess. This mixed- frequency sampling approach is implemented to reduce sampling effort in areas of the NEON purview where ticks are not pres-ent. While we recommend that sampling be con-ducted year- round, logistic constraints will likely limit sampling to the March–December portion of each year. A given sampling event will only be performed if the high temperature on the day pri-or to planned sampling was >0°C and the mean high temperature in the 5 d prior to planned sam-pling was >7°C. These temperatures represent conservative thresholds below which ticks are generally not active (Duffy and Campbell 1994, Clark 1995, Vail and Smith 1998). Sampling will be postponed whenever this temperature thresh-old is not met, or when the ground is wet (e.g., after a rain event or when dew is heavy). Addi-tionally, sampling will be avoided during the hot-test and/or driest periods of the day (relative to typical temperatures at any given site).
Sample processing
In the field, collected nymphal and adult ticks will be transferred into labeled vials con-taining 95% ethanol. Larvae will be collected using reusable lint rollers and washed into filter paper for subsequent transfer into these vials (Savage et al. 2013). Samples will be transported on ice in portable coolers to a NEON domain lab (one per domain, generally in the vicinity of the core site and <3 h by car from each relocatable site). For each sam-pling event/plot combination, NEON will enu-merate collected ticks by life stage and then transfer them into cold storage at <4°C (−20°C recommended).
The NEON will send collected ticks to one or more external facilities for taxonomic identifi-cation and parasite testing. Nymphal and adult ticks will be identified to species based on visual examination of external morphology (e.g., Cooley and Kohls 1944, 1945, Keirans and Litwak 1989) and enumerated by species and life stage for each sampling event/plot combination. Uncertain iden-tifications can be verified as necessary or desired through examination by a secondary ID facility or using genetic methods such as DNA barcoding
(Hebert et al. 2003, Pons et al. 2006, Mukherjee et al. 2014). Larval ticks will not be taxonomically identified but will be counted and archived.
Following identification, ticks will be com-bined by species, life stage, site (pooling across plots), and sampling event for parasite testing. NEON will test a subset of species- identified nymphal and adult ticks collected during each sampling event for infection by parasites. Actual sample sizes for parasite testing will depend on collection success, analytical costs, and desired levels of statistical power associated with prev-alence estimates. For any species/life stage com-bination tested, a minimum of 10 and a target of 100 individuals per site/sampling event combina-tion are recommended. Ticks will be tested indi-vidually using next- generation sequencing with barcoded, universal 16S rRNA primers (Carpi et al. 2011, Budachetri et al. 2014). This method will allow for the detection of a wide range of parasites including individuals in the genera
Anaplasma, Borrelia, Ehrlichia, Francisella, and Rickettsia. The method will also return
informa-tion on other prokaryotic endosymbionts of ticks (e.g., gut bacteria) and may provide data associ-ated with tick taxonomy akin to DNA barcoding. The development of associated technologies may eventually make it possible to conduct multiplex PCR using additional primers to test for an even broader suite of parasites. For example, detection of eukaryotic parasites (e.g., Babesia spp.) is desir-able but would require use of 18S rRNA primers. Such modified tests, including multiplex assays involving both 16S and 18S rRNA primers, are recommended and will be considered by NEON as technological advances and resources permit. To quantify the likelihood that a given parasite is present within a tested tick, sequences generated during parasite testing will be screened against known parasite sequences in a library to be creat-ed by NEON and bascreat-ed on publishcreat-ed sequences (e.g., available through the National Center for Biotechnology Information, Acland 2013). Design evaluation
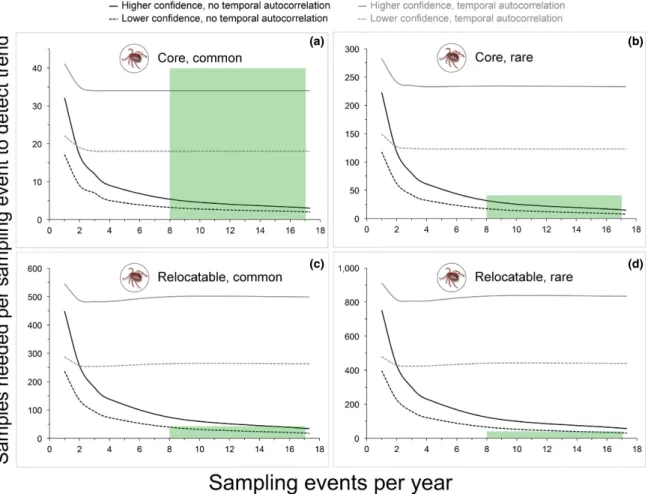
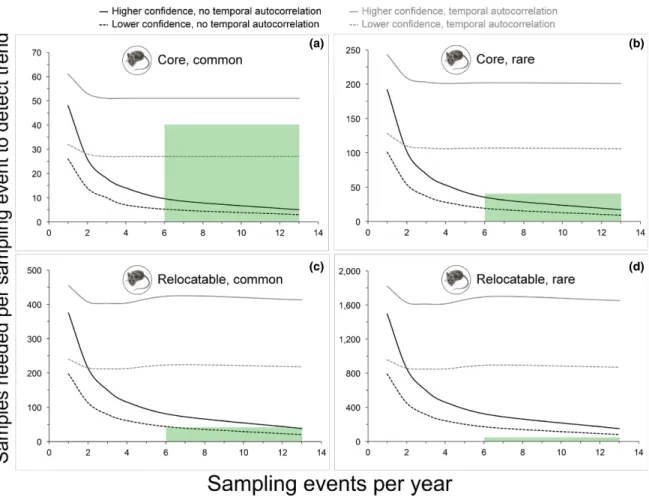
For power analyses to evaluate the ability of sampling and testing to detect interannual trends in the prevalence of tick- borne parasites at a site, we set year- zero prevalence values to 5% (rare parasite) or 15% (common parasite) based on results of studies of B. burgdorferi infection
in I. scapularis populations (e.g., Piesman et al. 1986, Ginsberg and Ewing 1989b, Ogden et al. 2007, Diuk- Wasser 2012). Given plans to test between 10 and 100 ticks of a given species/ life stage combination per sampling event, we used a conservative sample size threshold of 40 ticks tested. Hence, a sampling frequency was deemed adequate if 40 or fewer tested ticks per event were sufficient to detect an in-terannual increase in parasite prevalence of a given magnitude at a site.
When power analyses included a temporal autocorrelation term, the design (sampling events every 3 or 6 weeks) could detect an interannual increase in prevalence of 0.75% for a common par-asite at a core site (i.e., over 25 yr) with higher con-fidence (α = 0.05, power = 0.9) (Fig. 4a). This was the only scenario in which an interannual increase in <1.0% could be detected by the design given tem-poral autocorrelation in parasite prevalence. In the absence of temporal autocorrelation, the design could detect an interannual increase in 0.25% for a common parasite at a core site with higher con-fidence. For a rare parasite at a core site the design could detect an interannual increase in 0.50% with higher confidence (Fig. 4b). An increase in 0.25% could be detected with lower confidence (α = 0.1, power = 0.8), but only at a sampling frequency of one event every 3 weeks. For a common parasite at a relocatable site (i.e., over 10 yr), the design could detect interannual increases of 0.75% (Fig. 4c) and 1.0% with lower and higher confidence, respec-tively. For a rare parasite at a relocatable site, an interannual increase in 1.0% could only be detect-ed with lower confidence at a sampling frequency of one event every 3 weeks (Fig. 4d).
The design essentially had a 100% probability of detecting a common parasite and an 87% prob-ability of detecting a rare parasite at a site when 40 or more ticks per species/life stage were tested per sampling event (Fig. 5a). For very rare para-sites (1% prevalence) the probability of detection was 33%. When analytical sampling effort was reduced by half (to 20 ticks tested) these prob-abilities fell to 96%, 64%, and 18%, respectively. To achieve a 50% probability of detecting a para-site, four, 14, and 68 ticks had to be tested under scenarios when the parasite was common, rare, or very rare, respectively (Fig. 5b). These sample sizes had to be increased to 10, 31, and 160 ticks to achieve an 80% detection probability.
Data reporting
The following data generated by (or relevant to) tick sampling or associated parasite testing will be made available through an online data portal maintained by NEON, Inc. (http://www.neoninc. org/data-resources/get-data) or the organization managing the NEON project. Data will become available as they are collected, processed (including quality control), and posted to the data portal. At the spatiotemporal scales of the sampling plot/ sampling event and the site/sampling event
• Tick abundance: the numbers of nymphal and adult ticks (both by species, also by sex for
adults) and larval ticks (cumulative across species) collected.
• Sampling effort: the distances covered in me-ters during drag and/or flag sampling. • Tick density: the densities of ticks (by species
and/or life stage) estimated using the quotient of number of ticks collected and distance covered during sampling.
For each tick tested for evidence of infection by parasites
• Tick information: species, life stage (nymph or adult), sex (for adults), and date and lo-cation of collection.
Fig. 4. Power analyses to evaluate the ability of sampling to detect interannual trends in tick- borne parasite prevalence. Each panel present results of power analyses involving a different combination of National Ecological Observatory Network site type (core site = modeled at 25 yr duration, relocatable site = modeled at 10 yr duration) and year- zero parasite infection prevalence (rare = 5%, common = 15%). Results for both low (α = 0.1, power = 0.8) and high (α = 0.05, power = 0.9) confidence scenarios, each with and without a temporal autocorrelation term (~0.37 at 6 months), are provided in each panel. Green boxes indicate levels of sampling effort (sampling event frequency and number of samples per event to be tested for parasites) specified in the associated design.
(a) (b)
Fig. 5. Power analyses to evaluate the ability of sampling to detect parasites when they are present. Panels on the left (a, c, e) depict relationships between the number of samples tested for parasites and the probability of parasite detection. Green boxes represent upper (light green) and lower (dark green) estimates of number of organisms likely to be tested per site/sampling event combination, as reported in the text (e.g., between 10 and 100 ticks per sampling site/event combination). Panels on the right (b, d, f) depict relationships between the minimum number of samples required for specified detection probabilities at various levels of parasite prevalence. Green boxes span the range of estimated prevalence for rare and common parasites at National Ecological Observatory Network sites, as indicated in legends of corresponding panels on the left. Target taxa are indicated symbolically.
(a) (b)
(c) (d)
• Sequence data: all raw genomic sequences generated using next-generation sequencing with barcoded 16S rRNA primers.
• Infection status: the presence/absence of each parasite in the NEON reference library based on alignment of testing-generated and library reference sequences above one or more match percentage thresholds (e.g., Altschul et al. 1990). Parasites in the reference library will initially include one or more species in the genera Anaplasma, Borrelia, Ehrlichia,
Francisella, and Rickettsia.
For each combination of tick species/life stage tested for evidence of infection by parasites, at the spatiotemporal scale of the site/sampling event • Testing effort: the numbers of ticks tested for
parasites.
• Testing results: the numbers of ticks that tested positive for each parasite in the NEON ref-erence library.
• Prevalence estimates: the prevalence of infec-tion by each parasite in the NEON reference library estimated using the quotient of number of ticks that tested positive and the total number of ticks tested. Prevalence estimates will be reported with Wilson 90% confidence intervals as error estimates (Zelmer 2013). The type(s), number(s), and availability of archived samples
These will include: whole untested ticks and genomic extractions, and PCR and sequencing products from tested ticks.
m
osquIto- B
orneP
arasItes
amPlInG TargetsMosquito sampling will broadly target all members of the family Culicidae. For mosquito- borne parasite testing, NEON will screen sam-ples for infection by arboviruses (Calisher 1994). Mosquitoes in the genera Aedes and Culex are of particular interest because they collectively transmit a variety of viral parasites (Moore et al. 1993, Turell et al. 2005). NEON will test female mosquitoes (pooled by species within sampling events) for the presence of alphavi-ruses, bunyavialphavi-ruses, and flaviviruses using molecular methods (e.g., RT- PCR, melt curve
analysis) and/or Vero cell culture methods. Virus- positive pools will be subjected to addi-tional parasite- specific tests as needed to identify the parasite(s) present within them.
The mosquito- borne parasite sampling design was formulated in conjunction with the design for NEON mosquito abundance and diversi-ty sampling (Hoekman et al., in press). Because these two sampling efforts differ fundamentally in their objectives, they would be optimized us-ing different strategies if designed independent-ly. Parasite- related sampling seeks to collect and test large numbers of mosquitoes of particular species to quantify rare phenomena (infection by parasites). In contrast, abundance and diversity sampling aims to characterize the community of mosquitoes at a site using spatiotemporally and taxonomically broad sampling. Although a com-bined sampling plan driven by considerations of parasite- related sampling would not be suit-able for robust sampling of mosquito abundance and diversity, a plan based upon the priorities of abundance and diversity sampling would also collect some of the mosquitoes needed for par-asite testing. The design therefore represents a combination of the two sampling efforts into a unified approach (hereafter, mosquito sampling) that is driven largely by priorities of abundance and diversity sampling and that can be augment-ed as neaugment-edaugment-ed (e.g., collection of additional sam-ples) to meet requirements of mosquito- borne parasite sampling.
Sampling methods
The NEON will sample mosquitoes using CDC miniature CO2 light traps (Sudia and Chamberlain 1962), which are one of the most commonly used types of mosquito trap and arguably collect the greatest diversity of mos-quitoes across a broad range of environmental conditions (Service 1993). Traps of this type are regularly deployed as part of arboviral surveillance by public health and vector control organizations. As such, use of this trap type will facilitate the integration of NEON mosquito data with similar data collected by other groups. CDC miniature CO2 light traps primarily attract mosquitoes through the release of carbon di-oxide (e.g., from sublimating dry ice or com-pressed gas cylinders), a component of vertebrate exhalation that female mosquitoes